
ABSTRACT
The role of data within international development is rapidly expanding. However, the recency of this phenomenon means analysis has been lagging; particularly, analysis of broader impacts of real-world initiatives. Addressing this gap through a focus on data’s increasing presence in urban development, this paper makes two contributions. First – drawing from the emerging literature on ‘data justice’ – it presents an explicit, systematic and comprehensive new framework that can be used for analysis of datafication. Second, it applies the framework to four mapping initiatives in cities of the global South. These initiatives capture and visualise new data about marginalised communities: residents living in slums and other informal settlements about whom data has traditionally been lacking. Analysing across procedural, rights, instrumental and structural dimensions, it finds these initiatives deliver real incremental gains for their target communities. But it is external actors and wealthier communities that gain more; thus, increasing relative inequality.
Introduction
Datafication – the growing presence, use and impact of data in social processes – is a worldwide phenomenon, including in the domain of international development (Taylor & Broeders, Citation2015). This growth has seen both hopes and concerns for the developmental impact of new data streams (Spratt & Baker, Citation2015). But, because of the novelty of the phenomenon, writing has sometimes had to be based on overviews or extrapolations from pilot projects or experiences in the global North (Lokanathan, Citation2017; Spratt & Baker, Citation2015). There have been relatively few analyses to date of real-world initiatives, and the field is still assessing analytical approaches to use (Sengupta, Heeks, Chattapadhyay, & Foster, Citation2017).
This paper thus aims to make two contributions. First, we argue that the international development impacts of data can be understood in terms of data justice and injustice. To enable analysis of data initiatives in development, we therefore introduce a new data justice conceptual framework. Second, we demonstrate the application of this framework by using it to analyse a set of data initiatives – community mapping projects – within the domain of urban development. In particular, we seek to understand the full breadth of impact of such initiatives on those who are already marginalised within the physical city: low-income, informally housed populations who lack data and about whom data is lacking (Mitlin & Satterthwaite, Citation2013). This framework will have a generic analytical value in understanding datafication and development. In our specific analysis, it identifies incremental gains from datafication for marginalised urban communities. However, these absolute improvements must be set alongside some increase in relative inequality as other groups tend to gain more from new data streams.
There follows next a review of datafication, particularly in relation to urban development, and presentation of the data justice analytical framework. Then the methods used for this paper are explained: study through primary and secondary research of urban data initiatives that mapped communities in Chennai, Nairobi, Pune and Solo. Findings and conclusions follow relating to the two contributions noted above.
Datafication, (urban) development and data justice
Data has always been part of international development as it is essential and integral to all development decisions. But the advent of digital technologies and their significant diffusion in developing countries during the twenty-first century have led to a step change. The datafication of development can be described in terms of a growing volume, velocity, variety and visibility of data, with greater use of new forms and streams of data in decision-making (Heeks, Citation2018). This then leads to emergent developmental impacts associated with this datafication.
A positive perspective on those impacts sees opportunities: a ‘data revolution for sustainable development’ (UN, Citation2014). Overall, this argues that new data is essential to both delivery and measurement of the Sustainable Development Goals. Specifically, it argues for a set of particular development benefits from datafication: improving agricultural productivity though better advice for farmers, helping stop spread of diseases through better charting of their diffusion, improving accountability of government through greater openness of public sector decisions, etc. (Davies & Perini, Citation2016; Kshetri, Citation2014).
But alongside this is a set of concerns. Some focus on constraints: barriers that prevent the development impacts of datafication from being realised, meaning that development problems and populations remain under-represented in digital datasets and in dataset-driven decisions. Barriers include the ‘digital divide’, data quality problems, and lack of data-related capabilities in developing countries (Ali et al., Citation2016; Hilbert, Citation2016). Other concerns focus on disbenefits: negative developmental impacts of datafication. These include growing surveillance and loss of privacy, capture of development gains by private corporations, and growing inequalities: especially a relative loss of power for individual citizens and civil society (Mann, Citation2018; Taylor & Broeders, Citation2015). However, analysis of real-world experiences is lacking: in part due to the recency of datafication in developing countries but also due to a lack of clear analytical frameworks (Sengupta et al., Citation2017).
This broader picture is mirrored in the various individual domains of development, including the particular focus here: urban development, with the expanding role and importance of data recognised within the New Urban Agenda that is intended to guide future development (UN-Habitat, Citation2017). New forms and flows of data are especially associated with the growth of the ‘smart city’ agenda in the global South (Privacy International, Citation2017; Shekhar, Citation2016), and with the affordances of digital technologies: mapping cities by remote sensing, gathering environmental and other data via ground-based sensors, development of ‘data twins’ of urban areas such as mobility maps created by tracking mobile phone use, etc. (Lokanathan et al., Citation2016; Willis, Citation2017).
These activities come with much promise around the benefits they will bring to urban planning and development. These include: improving its efficiency by enabling decisions and results to occur more quickly and/or more cheaply; and improving its effectiveness by enabling decisions and results that are better-informed, more objective, more transparent, and better-able to meet citizens’ needs (Samarajiva, Lokanathan, Madhawa, Kreindler, & Maldeniya, Citation2015; van Veenstra, Esmeijer, Bakker, & Kotterink, Citation2014). But alongside this have been concerns about datafication of the city (Baud, Citation2016; Kitchin, Citation2014a; Privacy International, Citation2017; Taylor & Richter, Citation2015; Townsend, Citation2013): procedurally that initiatives are not being implemented right; instrumentally that the promised results are not being achieved; ethically that data rights are not being respected; and critically that there are problematic distributive impacts. The main critical concerns are that urban datafication is associated with growing inequality; especially, in developing countries, with the exclusion or adverse incorporation of those who are already marginalised within the physical city, such as those living in slums and other forms of informal settlement (Donovan, Citation2012; Pfeffer & Verrest, Citation2016).
Given the extent of urban inequality – 30% of the urban population in developing countries lives in slums (UN-Habitat, Citation2016) – and the history of this population being excluded from or marginalised by new initiatives, some development actors have begun what we may call pro-equity data initiatives (PEDIs). Though coming with other labels attached, an essence of these activities has been creation of new dataflows and datasets by and/or about and/or for slum communities. These aim to counteract the historical ‘datalessness’ of such communities: e.g., their lack of representation within, and their lack of access to, urban data (Mitlin & Satterthwaite, Citation2013; Patel & Baptist, Citation2012). Examples of initiatives include community wi-fi that enables new dataflows within, into and out of slum communities; open data/right-to-information that enables new dataflows into slum communities; and community mapping that creates new datasets about slum communities (Chakraborty, Wilson, Sarraf, & Jana, Citation2015; Willis, Citation2017).
But how should these (and other) data initiatives in developing countries be understood and evaluated, given the recent recognition of a lack of evaluative frameworks to analyse datafication and development (Hagen, Citation2017; Sengupta et al., Citation2017)? One approach would follow descriptors used for the datafication concerns expressed above: ‘injustice’ (Townsend, Citation2013), ‘ethical concerns’ (Kitchin, Citation2014a), ‘ethical challenges’ (Taylor & Richter, Citation2015). This would suggest analysis using ideas within the emerging literature on ‘data justice’: ‘the specification and pursuit of ethical standards for data-related resources, processes and structures’ (Heeks, Citation2017a). This is a small body of work within critical data studies echoing our specific interests around equity.
This has been conceptualised from a capabilities perspective (Heeks & Renken, Citation2018; Taylor, Citation2017). However, we wanted to take a broader view of data justice that specifically encompassed three things highlighted in recent literature. First, the concerns about datafication expressed earlier: procedural, instrumental, rights-based, critical. Second, a specific focus on data and data praxis, given the understanding from critical data studies that any social injustices may relate more to forms and flows and use of data than to specifics of the technologies that carry and process and display that data (Neff, Tanweer, Fiore-Gartland, & Osburn, Citation2017; Taylor & Broeders, Citation2015). Third, the argument of other critical data studies literature that broader social structure – for example as understood in the notion of the ‘data assemblage’ of discourse, institutions, social relations, material resources, etc. within which a data system is embedded – must be incorporated into any analysis because of its role in shaping data-related outcomes (Dalton & Thatcher, Citation2014; Kitchin, Citation2014b; Kitchin & Lauriault, Citation2018).
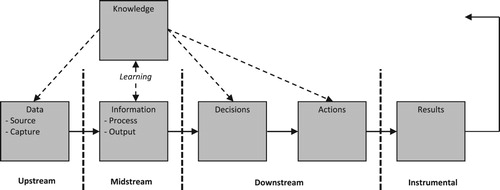
The model developed from these principles is summarised in (adapted from Heeks (Citation2017b) which should be referred to for further details of its development). The core of the model is the particular data system that arises through datafication. The system’s handling of data can be understood in terms of the information value chain: the steps by which data is transformed into developmental results (see ). These are broken into ‘upstream’ steps of data capture, ‘midstream’ steps of processing and visualising data into information, and ‘downstream’ steps of using that information in decisions and actions, leading to the instrumental value of the system in terms of its results.
Figure 1. Conceptual model of data justice (adapted from Heeks, Citation2017b).
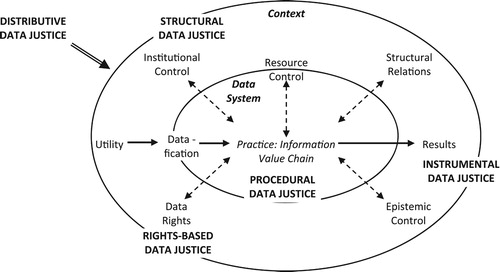
Figure 2. The information value chain (adapted from Heeks, Citation2017b).
Note: Knowledge links to all steps of the chain and therefore is not associated with any individual stage: up-, mid- or downstream.
Surrounding the data system is its context. The system is driven to function by some particular utility or value. It is shaped by a set of data rights and, in turn, shapes those rights as it functions. And it has a similar interrelation – shaping and being shaped by – the key constituents of social structure: formal and informal institutionsFootnote1, social and technical resources, social relations, and epistemics (knowledge and discourse).
This then allows examination of five dimensions of data justice:
Procedural: fairness in the way in which data is handled.
Instrumental: fairness in the results of data being used.
Rights-based: adherence to basic data rights such as representation, privacy, access and ownership.
Structural: the degree to which the interests and power in wider society support fair outcomes in other forms of data justice.
Distributive: an overarching dimension relating to the (in)equality of data-related outcomes that can be applied to each of the other dimensions of data justice.
Further explanation of the two models will follow below. The models are generic and should thus be applicable to analyse all forms of datafication. But, given our central concern with datafication and (urban) development, we will use them as analytical frameworks for evaluation of four urban PEDIs in developing countries. Before doing that, we outline the initiatives and methods used for evidence-gathering.
Case background and methods
Among the possible types of pro-equity data initiative, we chose those involving community mapping. Mapping aims to counter the relative invisibility of (i.e., lack of data about) marginalised communities by gathering, visualising and utilising new data on locations, assets and issues within those communities. Mapping was chosen because it is quite well-established and widespread as a PEDI in cities of the global South (Panek & Sobotova, Citation2015; Patel & Baptist, Citation2012). While the analysis here speaks to broader trends of datafication, this means there is a ready direct literature and constituency of relevance.
Four initiatives were chosen for analysis:
Map Kibera (MK) was begun in 2009 by two US development activists. It initially focused on Kibera, a slum roughly estimated at 250,000 people located in South-West Nairobi, Kenya. Kibera is an area of widespread poverty and low-quality housing, yet also containing many assets: schools, clinics, community centres, etc. MK used local young people to gather data on those assets, and then map them. The intention was to make these assets more widely known-about and visible to decision-makers, in order to improve the planning of new services. Via creation of social enterprise GroundTruth Initiative, expertise from Kibera has subsequently been applied to other slum areas in Africa and the Middle East.
Our Pune Our Budget (OPOB) was begun in Pune, India, in 2006 by local NGO, the Centre for Environment Education (CEE). Unlike Map Kibera, OPOB looked across the whole of the city but focused down on one specific issue: the city’s budgeting process. This was analysed as being politicised and skewed: directing higher allocations towards wards of politically powerful councillors, and away from wards covering low-income and informal housing. OPOB therefore organised a city-wide data-gathering and mapping exercise – covering both formal and informal settlements – which was to be used to bring greater objectivity and fairness into the budgeting process. It was intended to enable budgets to be set on the basis of citizen needs – especially needs of those on lowest incomes living in slum areas – rather than on the basis of politics.
Solo Kota Kita (SKK). Begun in 2010, Kota Kita is an Indonesian NGO based in the city of Solo. Like OPOB, its initiative was also city-wide and driven by concern with shortcomings in the city’s budgeting process. The concern was not primarily about those in informal settlements – which form a much smaller part of the city than in the other three cases – but, more generally, about the lack of input from the city’s residents into the budget. The Solo Kota Kita project – facilitated by mayor (currently Indonesian President) Joko Widodo – sought to enable citizen involvement in the participatory budgeting process. It did this by gathering and mapping data across all city neighbourhoods, both wealthy and poor. This could then be used by meetings in each neighbourhood to identify their specific spending priorities. Kota Kita has subsequently rolled out its methodology to other cities across Asia.
Transparent Chennai (TC) was begun in 2009. It involved a series of projects to gather and map data on issues within the city’s marginalised communities. These included: (a) a project to map the location of the city’s homeless to aid planning of new shelters; (b) a project mapping, and seeking to improve, housing and services in slum areas; (c) a project identifying optimum locations for the siting of new public toilets; (d) a project charting the informal livelihoods of waste-pickers and impact of their lack of formal ID cards which prevented their legitimate access to municipal waste sites. In 2014, Transparent Chennai was rolled into a wider initiative, the Transparent Cities Network – housed in local NGO Citizen Consumer and Civic Action Group – that focuses on data and the urban poor.
These were chosen: because they were relatively long-standing PEDIs, which – unlike many initiatives – moved well beyond pilot stage; because there existed some secondary literature for each; and because they operated in cities with substantial slum populations: 50% of the city population in the case of Nairobi (Kovacic & Lundine, Citation2013), 40% in Pune (Jobst & Malherbe, Citation2017), at least 8% in Solo (Obermayr, Citation2017), and 28% in Chennai (Krishnamurthy & Desouza, Citation2015).
The findings below are drawn from four sources that were combined and then analysed through the thematic lens of the data justice model presented above. First, nine interviews, structured around the concepts of data justice, with senior figures in the data intermediary organisations (MK, CEE, SKK, TC) associated with each of the four projects.Footnote2 Second, evaluation documents from the projects that are reflective, to some degree self-critical, and sometimes based on primary fieldwork (e.g., Hagen, Citation2017; Menon, Citation2013; Padmanabhan, Raman, & Shekhar, Citation2013; Rifai, Asterina, & Hidayani, Citation2016). Third, independent secondary sources of research specifically on these projects, most of which are based on primary fieldwork (e.g., Berdou, Citation2011; Grillos, Citation2017; Jobst & Malherbe, Citation2017). Fourth, broader independent sources that incorporate analysis of these projects among a number of others (e.g., Baud, Citation2016; Donovan, Citation2012; Haklay, Citation2013; Shkabatur, Citation2014).
Background: data injustice and its consequences
Before analysing the cases in terms of data justice, we first outline the rationale behind the initiatives: the data injustices and consequences thereof that existed prior to the PEDIs being undertaken.
The communities studied suffer a range of injustices but of specific attention here was the data rights injustice relating to representation: that the physical marginalisation of these communities was mirrored by a virtual marginalisation within urban datasets. The communities were invisible or poorly visible: not merely that the areas themselves were unmapped as locations but that data on the assets, services, voices and livelihoods of citizens were absent (iMK1b, iOPOB2, iSKK). Data had sometimes been gathered – by NGOs and academics in Kibera, by government in Chennai and Pune – but it fell short on the five ‘OCARA’ measures of data quality: openness, completeness, accuracy, relevance, appropriateness of presentation (Heeks, Citation2018). Data on slums was generally treated as proprietary and was inaccessible to the community or to other organisations (iMK2, iTC1; Shekhar & Padmanabhan, Citation2015). Where it might be accessed, the data covered only part of the settlement, or was many years out-of-date, or was held on paper forms and records scattered across many different government departments (iOPOB2, iTC2; Shekhar & Padmanabhan, Citation2015).
This marginalisation within the data twin of the city – an inequality compared to the better representation of more prosperous and formalised settlements (iTC2; Patel & Baptist, Citation2012) – underpinned infrastructural and political marginalisation. The lack and poor quality of slum data ‘directly results in poor planning and maintenance of public infrastructure, and poor provision of public services’ (Shekhar & Padmanabhan, Citation2015, p. 3). For instance, in Chennai, lack of data on concentrations of population led new toilets to be planned and placed where government had available land rather than where they were needed (iTC3). Or, in Kibera, water points were poorly maintained due to lack of data on their functioning (iMK1b). More generally, in all locations, every type of public service – water, sanitation, roads, lighting, health, education, policing, etc – was provided to a very limited degree or poorly provided or simply not provided at all, in part due to lack of data about locations, needs, existing infrastructure, etc. (iMK1a, iOPOB1, iSKK, iTC3).
Lack of data also marginalised communities politically, ceding and skewing power within decision-making and service provision to political elites and their interests. With data on neither what the community already had nor on what it needed, there was no basis for engagement with urban planning decisions, nor a basis to challenge the decisions already being made, leading to political exclusion (iOPOB2, iTC2). Those who are data-less in the city – the slum dwellers, the homeless, the waste pickers – could be treated much worse than other citizens – subject to police raids or evictions – with few consequences for those guiding these actions (iTC2; Otiso, Citation2002; Padmanabhan et al., Citation2013). Likewise, there was a lack of political accountability around provision of public services given the absence of data on provision decisions or on provision itself (iTC1; Feruglio & Rifai, Citation2017; Menon, Citation2013).
Findings
As per the model shown in , the findings here will be presented in terms of each of the dimensions of data justice in turn, with distributive data justice considered in the final section.
Procedural data justice
We can analyse data system procedures using the elements of the information value chain model; starting on the left side. Because of the sampling or transect approaches used for gathering data, only a minority of community members could be direct sources. Only for Map Kibera were community members used to capture data; otherwise it was students or external organisation staff (iMK1b, iOPOB2, iSKK, iTC1). They gained technical skills, confidence and greater knowledge of the community, and social capital in the form of a network of contacts in the community, intermediary organisation and more widely (iMK1b, iTC1; Berdou, Citation2011).
‘Midstream’ information value chain (see ) activities of recording data onto a geographic information system, processing it, and visualising – e.g., printing out as a paper-based map – were generally undertaken by voluntary or paid professionals from outside the community (iMK2, iOPOB2, iSKK, iTC1; Hagen, Citation2011). These professionals gained higher-level technical skills (iMK2; Haklay, Citation2013). In ‘downstream’ terms, the data produced by PEDIs was not always used; either because no relevant decisions and actions existed, or because decision makers such as government officials did not know about the data or did not want to use it (iMK1b, iOPOB1, iSKK).
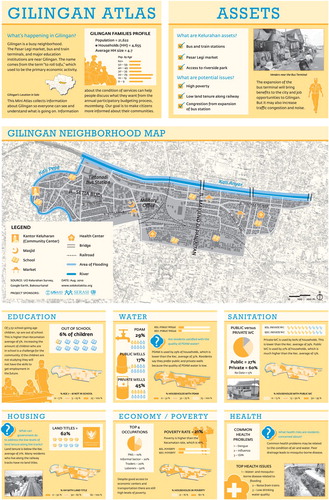
Only in Solo was it intended that data would be used by the community; fed back as a ‘mini-atlas’ (see ; a translation of the actual map provided in Bahasa Indonesia). This was present in community meetings held as part of the overall process of participatory budgeting in the city. However, any use of the data for prioritisation decisions was dominated by richer residents. This arose from the relatively limited extent of informal settlements and poorer residents in each neighbourhood plus time, confidence, literacy and other barriers to participation of the poor (iSKK, Grillos, Citation2017). These meetings were in any case only the first in a chain of budget decisions that were taken outside the community; instrumental results of which are discussed below.
Figure 3. Example mini-atlas from Solo Kota Kita (SKK, Citation2010).
In general, then, these pro-equity data initiatives were somewhat ‘extractive’ in utilising a few community residents as data sources but largely excluding them from all other information value chain processes. Nonetheless, there were some procedural benefits for communities and their members. Even where not directly used for decisions and actions, data has value if fed back into the community e.g., via posters displayed at meetings or on public buildings (Hagen, Citation2017; Jobst & Malherbe, Citation2017; Patel & Baptist, Citation2012). There was an interpretive value: giving residents a feeling of pride and of greater legitimacy as citizens. There was an epistemic value: making residents aware of issues that need addressing, and giving them knowledge of local services of which they might previously have been unaware e.g., the nearby presence of a school, clinic, water point, toilet, etc.
There were other process gains but they always lay outside the community. Skills and contacts were built by those within the intermediary organisation who were involved in using the data for advocacy purposes and in encouraging data-utilising activities by government such as budgeting or other urban planning decisions (iMK1a, iSKK, iTC1). While these external stakeholders continued their relationship with the informal settlements, these accumulations might be applied on behalf of the community.
Rights-based data justice
Data rights – particularly the right to be fairly represented in datasets and the right to hold some aspects private; but also, rights of data access and ownership – were most often discussed in terms of who and what was visible, and to whom.
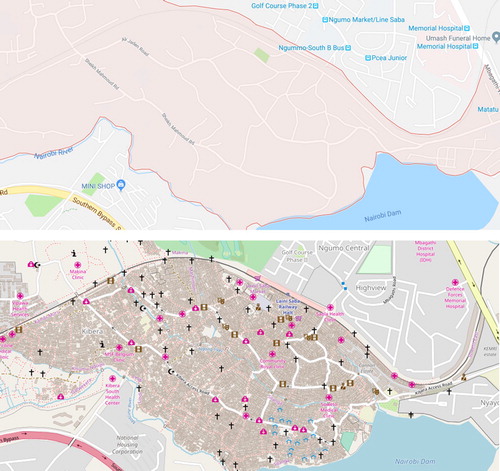
Informal settlements have been partly or wholly invisible within the city; denying them right of representation. All of the PEDIs render these settlements more visible in some way. They map or otherwise record settlements’ locations, boundaries, buildings, roads, paths; their assets: clinics, water points, public toilets, schools, businesses, markets, religious buildings, community offices, lighting; and their issues: e.g., health problems, crime hotspots, levels of poverty (iMK1b, iOPOB1, iSKK, iTC1, iTC2, iTC3). An illustrative comparison can be made, for instance, between Kibera’s appearance on Google Maps and on OpenStreetMap; the latter used to record some of Map Kibera’s data (see ).
Figure 4. (In)visible slums: Google Street Map (top) vs. OpenStreetMap (bottom) views of Kibera.
This external visibility – an exercised right of communities to more accurate representation – brought with it an interpretive value, most often expressed as the changed worldview or ‘slum imaginary’ of government officials. This changed from perceiving Solo residents as passive and ignorant to seeing them as active and knowledgeable (iSKK); from seeing Chennai slums as illegitimate to accepting if not ownership rights than at least rights to basic services (iTC1); and from seeing Kibera as asset-poor to asset-richer (iMK1b).Footnote3 As discussed next, it also brought some instrumental value: the more complete, accurate and objective data now available was seen as the basis to replace or to challenge past decision-making processes that were variously regarded as non-existent and/or of poor quality and/or driven by the politics of external stakeholder interests (iMK1b, iOPOB2, iSKK, iTC2).
But this external visibility draws in Scott’s (Citation1998) notion of legibility: the process by which states simplify and standardise data about their citizens in order to control them. Legibility disrupts local control over data and knowledge, undermining the power and the value of local understandings within slums (Donovan, Citation2012). When data is owned and held within the local community, there is local control; no doubt skewed and imperfect but localised nonetheless. As data becomes more widely circulated – up to the point where web-based digital forms are available to anyone, anywhere with internet connectivity – that local control is lost. These slum areas – all of which now exist virtually in some form of web-based map – are now legible not just to the state but to local and international NGOs, donor agencies, media organisations, academics, etc (iMK1b, iSKK). All of these can know the slum to some extent and make decisions and actions using data about the slum without the permission or even the knowledge of anyone living there. The right to be represented can thus mean that the right to own and control is ceded to these external agents and to their particular interests and agendas, benevolent or otherwise.
This loss of control, plus histories of data extraction to the benefit of others but not the community, have led to resistance to data capture; with rights to privacy being asserted. Some businesses such as schools and pharmacies in Kibera did not wish to be mapped. They feared visibility to the state might lead to closure if their location became known and their informal status or activities (e.g., sales of stolen drugs) were then discovered (Berdou, Citation2011). Particular settlements in Chennai refused to participate in data-gathering. They believed that drawing attention to their existence and informal status – being under the ‘gaze of the state’ – would increase likelihood of eviction (iTC1). Transparent Chennai itself had concerns about this. For example, it captured data on issues facing informal waste-pickers in the city but not their location or legal status, in order to protect them from state action (iTC3). If given a choice (which many were not) most slum dwellers had expressed primacy of their right of representation: to be incorporated into urban datasets. But for some this was seen to be in tension with their right to privacy, and for a few who wished to ‘fly under the state’s radar’, the latter was dominant.
More broadly, there should be recognition of who and what remain invisible, without a realised right to representation. Transient populations (e.g., labourers or street sellers who come daily into the city to make a living but then leave), the homelessFootnote4 and in some cases those without legal citizenship were excluded from data gathering (Feruglio & Rifai, Citation2017). Some aspects of urban decisions also stayed invisible, with community members being granted no right to access: the process by which decisions were made e.g., by government officials; the final decisions; and the extent of implementation of those decisions. As a result, community members were unable to either participate in or monitor the decisions being made about them unless the data intermediary organisations undertook specific actions to counteract this (iTC2; Feruglio & Rifai, Citation2017; Menon, Citation2013).
Instrumental data justice
Instrumental data justice focuses on results. There was little evidence of results arising from direct decisions and actions by community residents and community-based organisations. These results likely exist e.g., residents using a school or clinic they were previously unaware of, or residents attending a community meeting having seen a map of issues. However, these activities were not captured. Users of the open data twin of communities – whether on a public poster or loaded onto a web site – and any resulting actions within the community are untraceable unless they contact or otherwise come to the attention of data intermediaries (Hagen, Citation2017).
In all four cases, government was a presence in the downstream information value chain (see ). Systematic tracking of the value chain through to results seemed, unfortunately, to be rather rare; let alone independent verification. Evidence was thus based more on anecdotes and claims than one would have wished, and more on decisions such as plans than on implemented actions or results:
Gathered data – the ‘mini-atlases’ – was fed into community decision-making to set priorities for spending of devolved budgets in Solo. Actual use of the data as information for prioritisation appears to have been somewhat limited (iSKK). Rifai et al. (Citation2016, p. 63) describe this process as ‘challenging’, in part because it is management committees that then make final decisions on which projects will be funded. While the end result is community development projects, the link to data is unclear, and analysis shows spending to flow disproportionately to the least-poor areas (Grillos, Citation2017).
Community data was used in Pune to set an objective, needs-based budget that took account of the prevalence of poverty and inadequate housing across the city. Unfortunately, that budget was then ‘unset’ by local politicians (iOPOB1). Slum areas did see some investment but there was a skew towards middle-class issues (e.g., road building/improvement) and areas: 40% of Pune’s population lives in slums but only 10% of the budget was allocated for slum improvement (Menon, Citation2013).
Data from Map Kibera was used to improve government resource flows into Kibera schools, including involvement of informal school teachers in government-run activities such as a teachers’ retreat (Hagen, Citation2017). But the resource flow was, as expected, mainly to the 25% of schools that were government-run, while the extent and sustainability of wider results was unclear.
Transparent Chennai engaged more with government from the start of its projects, but the reported outcomes were rather circumscribed. The city built 15 homeless shelters not the 75 that the data had shown to be required (iTC1) or laid on a ceremony to present a few waste-pickers with entry cards to the local waste site, but not the ID cards they had been seeking (iTC2).
Other uses were also limited, and examples were only given for Kibera: of international development agencies and NGOs using the data for improved planning of education resource flows, or for siting of water and sanitation facilities (iMK1b; Hagen, Citation2017).
Structural data justice
Structure shaping data systems
There is evidence of some level of structural determinism in the case studies: of these pro-equity initiatives to still reflect structural inequalities, and for data to flow along the fault-lines of power in society. We can analyse this in terms of the contextual elements shown in the data justice model: utility, institutions, resources, structural relations and epistemics.
A consistent theme across all initiatives was that operation of the full information value chain depended on whether or not the data had utility for powerful local actors. Formal control of urban development decision processes rested with such actors, particularly in local government. In Solo, the mini-atlases became an officially mandated part of participatory budgeting because Mayor Widodo wanted his urban development innovations to work (iSKK, Bunnell, Miller, Phelps, & Taylor, Citation2013). By contrast, government officials in Pune were resistant to participatory budgeting, making it much harder for new data to be utilised (iOPOB1; Jobst & Malherbe, Citation2017).
In relation to institutional forces, data flowed according to the topography of trust in the city. Notwithstanding examples of government officials changing their view of the assets and issues in slum areas, they still tended to mistrust those communities (iSKK, iTC3). At best, substantial investment in advocacy and ‘bridge-building’ activities by the data intermediaries was required to enable those officials to use the data provided. At worst, even this did not stop officials from devaluing data about the community and being reluctant to use it.
All four initiatives were funded to a significant degree by international donors. That control of resources led initiatives to be shaped by the agendas of those donors, which were for highly visible, short-term results (iTC1; Hagen, Citation2017). This meant activity in all projects was a right-skewed curve with rapid early growth but then tailing off to much lower levels that struggled to sustain (iMK2, iTC1). And it meant an upstream‒downstream information value chain disconnect. Donors would pay for production of data artefacts, especially physical and digital maps. But they were much less interested in paying for the longer-term, less-visible activity of getting that data used to change urban decisions; in particular, not funding use of data by communities themselves (iMK1b, iOPOB2).
Conversely, the lack of resources among community members – mainly their financial poverty but also lack of knowledge and skills – shaped their engagement with the PEDIs. For many it meant non-engagement because of the opportunity cost that time invested in the project was time lost from earning a livelihood. So, people: did not respond to requests for data, did not join in mapping of their community, did not engage in community use of data (Grillos, Citation2017; Hagen, Citation2017; Jobst & Malherbe, Citation2017). And where they did engage, they brought an instrumental rather altruistic agenda. Thus, Map Kibera mappers came forward because the work was paid and even volunteer mappers were focused on the skill- and job opportunity-developments the work could offer (iMK1b; Berdou, Citation2011; Lundine, Kovacic, & Poggiali, Citation2012).
Structural relations were most often understood in terms of the relation between state and citizens. For Map Kibera, the state’s monopoly of legitimate violence shaped data use. They avoided ‘provocative’ uses of data that might antagonise state actors and lead to ‘vengeance’ (iMK1b). For example, they did not gather or use data relating to housing demolitions and evictions. They saw this would potentially lead to protests that would be violently suppressed by the authorities and – reflecting state control over NGOs – lead to Map Kibera Trust being shut down. For Transparent Chennai, the lack of accountability of state institutions to citizens shaped data use. As an example, the local Slum Clearance Board and Water Corporation had no elected representatives, no public hearings, and no open reporting policies (iTC1, iTC2). As a result, there were no incentives for them to change their practices and make use of new streams of community data.
Finally, in terms of epistemics, the strength of smart-city discourse shapes outcomes. With its emphasis on data and technology, this discourse drives the idea among funders and other stakeholders that an upstream information value chain focus will be sufficient, and that the addition of digital technologies into urban processes is enough to deliver urban development (iMK1b; Shekhar, Citation2016). This makes it more difficult to engage funds and actors in the more difficult aspects of downstream processes and socio-political factors.
Data systems shaping structure
On the ‘input’ side, then, there was evidence of structural determinism but looking at the ‘output’ side this was not quite a story of full path dependency. No social structure is stable and, while there was substantial reproduction of the structures of power, datafication had enabled some incremental changes to the architecture of urban development, as discussed next. Again, discussion is based around the contextual elements shown in .
Regarding utility, there are always competing agendas and interests in any urban development setting. The new data streams from the PEDIs assist those looking to make more open and/or more objective decisions. Interests in openness were rarely found: it applied only and only to some degree to the mayoralty of Joko Widodo in Solo (Bunnell et al., Citation2013). There were more interests in objectivity: an occasional presence in local government in Pune and Chennai; more strongly felt by external development agencies such as UNICEF and GOAL working with Map Kibera (iMK1b, iOPOB1, iTC2; Hagen, Citation2017). And data itself could modify the perceived interests of decision-makers. It could do this via its advocacy use by data intermediary organisations, local NGOs and local media and/or via concerns that urban decisions were visible to a wider world. This nudged decision-makers in a few cases and temporarily towards greater concern for slum residents (iSKK, iTC1; Kovacic & Lundine, Citation2013).
Institutional change was minor. In formal terms, the only regulatory change was the Solo mini-atlas incorporation. There were no examples of legal recognition of rights to land or even occupancy. In informal terms, there was some trust-building. This was less between citizens and government direct than between some community members and the data intermediary organisation; and then between the intermediary and some government officials.
Structurally, insertion of the data intermediary into the landscape was the most notable feature – acting as that trust-building bridge, translating epistemes and logics, to some degree equalising the power inequalities between citizens and outside agencies (iMK1b, iTC3; Song, Citation2016). But these intermediating relations were contingent: broken off or downgraded, for example, when new government officials came into office (iOPOB1, iTC3). And they were bounded. There were ‘no-go’ areas that were deemed too politically sensitive, for example if touching on corruption (iTC1; Shekhar, Citation2012). They could have been the basis for holding state and other actors to account except, as noted, data on actions and results – on the extent to which new infrastructure, services and resources were being delivered into the slums – was not being gathered (iTC2; Feruglio & Rifai, Citation2017; Menon, Citation2013).
Epistemic change was also bounded. Communities to some extent, and external actors to a greater extent, had better knowledge of these informal settlements. We noted evidence of the ‘slum imaginaries’ of some of those external actors changing to a more positive view. But negative images persisted, at least among some local government officials (iTC3; Menon, Citation2013).
Lastly, the key resource change is the availability of data. This favoured those with the digital technologies and other resources – skills, knowledge, time, confidence, money – necessary to access the data and make the value chain operate; resources more available to those outside than within the marginalised communities. Use of data by external actors could benefit the community. Examples included the data intermediaries empowered to better advocacy on behalf of communities, or the international NGOs empowered to planning better interventions. But control and empowerment still resided outside the community. In particular, the data intermediary organisations are empowered. Interrogating openness, one finds that it is often sub-sets or summaries or visualisations of data that are being circulated. Control over the foundational dataset including ownership and rights to update the data typically rests with the data intermediaries.
Discussion and conclusions
Distributive data justice
Distributive data justice – the concern for who gets what as a result of data systems – is a lens applied across the other dimensions (see ). It has particular relevance here given the foundational concern about marginalisation. It also has particular relevance given the injustices of data-based inequality suffered by the slum communities. As noted above, their location, assets, issues are less visible than those of more affluent areas and residents, with a knock-on to inequality of infrastructure, service provision and political role. We can consider this by summarising each of the other dimensions in turn: procedural, rights-based, instrumental and structural.
Procedurally, the overall picture could be seen as a pyramid. At the base, the majority of community members are not involved in the data-information-decision-action processes of the information value chain. Above them, the largest number of beneficiaries are within the community but they gain only the interpretive value of data. The mappers who capture data are far fewer but gain more. The data processing/visualisation professionals are fewer still but gain greater capabilities. The intermediary organisations benefit most of all.
A similar picture can be seen in terms of rights of representation and visibility. The most marginalised – those without homes, those without identification, those residing on the physical margins who come in to the city to make their living – are rarely made visible by these data initiatives. Yet what also remained largely invisible was data that might truly challenge political elites or enable them to be held to account The communities that are made visible reap some benefit directly. However, they lose control of their representation; becoming legible to others who can make use of the community’s data twin for their own purposes. From this, we can see the ambivalence of legibility. Slums must be legible to government, NGOs, development agencies, etc. if they are to benefit from the resources, services, support, etc. that these external organisations offer. But that same legibility exposes slum residents to any other agendas these organisations may hold. Those agendas may be orthogonal to slum interests or even counter to those interests: extractive, persecutory or predatory. Even if direct evidence of the latter was limited, the fear of it led some data intermediaries to avoid gathering certain types of data. It also led some groups to prioritise their right to privacy and either resist or refuse to engage with data gathering.
In instrumental terms, external agendas have served the slums: these data initiatives bring better-planned and more resources and services. But alongside the glass half-full is a glass half-empty. These absolute improvements are always less than intended or needed, and sometimes merely symbolic or temporary. Marginalised groups find some greater voice and place in urban decision making than was previously the case thanks to these data initiatives. But, particularly in city-wide initiatives as in Pune and Solo, relative inequality still grows as more formalised areas and wealthier residents retain a stronger voice and benefit more.
This overall picture is both explained by and reflected in the structural data justice evidence. Path dependency is the main narrative: the wider structural inequalities of power-interest significantly shape the data systems and operations of the information value chain. In turn, the value chain largely reproduces that wider configuration and constrains pro-equity aspirations. This is not a completely static picture: the value chain does reshape – subtly, incrementally – the structural determinants of power and utility. There is an incremental empowerment in terms of new data access, external perceptions of self-interest and of slums and their residents, and the landscape of organisations and trust. But there is no evidence of a wider transformation of the substrates of urban inequality, with communities potentially more dependent on external forces because of their heightened legibility.
Conclusions and recommendations
Datafication is a key trend within international development; with effects seen in every development sector and effects growing every day. Yet analysis of real-world experiences and their breadth of impact has to date been limited; in part due to a lack of analytical frameworks.
This paper therefore makes two significant contributions. First, it exposes a full picture of the impact of one type of pro-equity data initiative – community mapping – on those who are marginalised within the city. New data flows do have an impact in counteracting the injustice of invisibility, but they disproportionately serve those with the motivation and power to use that data. Results are certainly beneficial for slum communities and other marginalised citizens, and these initiatives can be justified on that basis. However, though there can be no exact calibration from qualitative research, it is likely that these pro-equity initiatives actually increase relative inequalities. Ordinary community members have seen some benefits but external actors who find the data to match their agenda and capabilities, benefit more. It is the latter who are more empowered to access, use and control the new data.
Second, and in order to perform this evaluation, the paper presents and demonstrates an explicit, systematic and comprehensive framework for the analysis of data systems and initiatives. The framework is data-based: acknowledging the important growth in both reality and discourse around datafication by placing data at the heart of the model. But it simultaneously decentres data and digital technology by guiding attention to wider processes, impacts and structures. There was some overlap in the dimensions used; with the rights discussion particularly touching on procedural, instrumental and structural issues. However, in general the perspectives were additive. They offer new insights and particularly substantiate the need to incorporate and understand context – rights, structures, interests – in order to fully understand the implications of datafication.
The framework was applied here to analyse just one type of data initiative. However, its generic nature means it should be equally applicable to all types of datafication. That application will form part of a future research agenda that has a number of potential directions. For example, the framework can be applied in other domains of international development where big and open data are playing an increasing role: agriculture, public health, humanitarian interventions, education, governance, etc. (Ali et al., Citation2016; Davies & Perini, Citation2016). It can also be applied to pro-equity initiatives in industrialised economies such as the ‘data sovereignty’ actions of indigenous peoples and other forms of data activism (Hintz, Dencik, & Wahl-Jorgensen, Citation2019; Kukutai & Taylor, Citation2016).
Another part of the future research agenda will be action research; working with data intermediary and other organisations in using the framework to guide design and implementation of data initiatives. In advance of that, one can – building from Fox (Citation2015) – identify three approaches to pro-equity data initiatives: technical, social and critical.
A technical approach focuses just on the digital data and technology, and the findings here show this to be too limited a view that falls short in terms of both conceptualisation and impact. A social approach focuses on achievement of development results. Findings here suggest such an approach should recognise the procedural benefits that can emerge alongside instrumental results. And they suggest that such projects need a clear theory of change, with the information value chain providing the basis for that. Project design can either look for or seek to create a functioning information value chain; one that has utility as its driver and the necessary resources present as enablers.
A critical approach would encompass the wider context of rights, power and interests. The findings suggest three things. First, value in modesty of expectations for what can be achieved through pro-equity data initiatives: accepting incremental rather than transformational outcomes; and accepting absolute improvements in informal settlements, even if broader relative inequalities may widen. Second, the importance of identifying tensions and disjunctures within the context. For example, seeking out NGOs that see an advantage over others within the competitive funding environment if they make use of new or more-objective data. Or looking for newly appointed mayors or urban commissioners or development agency directors who bring a new agenda that new or more-objective data could be seen to assist. Third, the important structural role performed by data intermediary organisations. These are channels through which citizens can influence the balance of representation/privacy and the nature of data ownership and access. They are also important determinants of the constitution and distributive benefits of information value chains.
More generally, the findings support the value of imbuing data projects with the values of data justice; ensuring their design and implementation follow principles of procedural, rights-based, instrumental, structural and distributive justice. Such principles may be found, for example, in the ‘Data-Justice-for-Development Manifesto’ (Heeks, Citation2017b):
Demand just and legal uses of development data.
Demand data consent of citizens that is truly informed.
Build upstream and downstream data-related capabilities among those who lack them in developing countries.
Promote rights of data access, data privacy, data ownership and data representation.
Promote data system outcomes that address international development goals and priorities; including the goals and priorities of data subjects.
Support ‘small data’ uses by individuals and communities in developing countries.
Advocate sustainable use of data and data systems.
Create a social movement for the ‘data subalterns’ of the global South.
Stimulate an alternative discourse around data-intensive development that places issues of justice at its heart.
Develop new organisational forms such as data-intensive development cooperatives.
Lobby for new data justice-based laws and policies in developing countries (including action on data monopolies).
Open up, challenge and provide alternatives to the data-related technical structures (code, algorithms, standards, etc.) that increasingly control international development.
These can be a guiding framework, particularly for data intermediary organisations given these organisations are focal nodes for emancipatory action.
Disclosure statement
Author Shekhar works for the Citizen Consumer and Civic Action Group which was involved in the Transparent Chennai initiative and the Transparent Cities Network.
Notes on contributors
Richard Heeks is Chair in Development Informatics at the Global Development Institute, University of Manchester; and Director of the Centre for Development Informatics (http://www.cdi.manchester.ac.uk). He has been consulting and researching on informatics and development for more than 30 years. His book publications include India's Software Industry (1996), Reinventing Government in the Information Age (1999), Implementing and Managing eGovernment (2006), ICTs, Climate Change and Development (2012) and Information and Communication Technology for Development (2018). His research interests are data-intensive development, e-resilience and e-sustainability, digital development, and the digital economy in developing countries. He has a PhD in Indian IT industry development, directs the MSc programme in ICTs for Development, and runs the ICT for Development blog: http://ict4dblog.wordpress.com [email: [email protected]].
Satyarupa Shekhar leads the work on urban governance at CAG, India. Satyarupa works to overcome challenges to access to basic services posed by a lack of data and information, while improving transparency and accountability. Her areas of interest are public administration, role of elected representatives, open data, and the use of technology to improve governance. She has been a part of innovative action-research projects that re-look at common urban challenges, including those on informal waste workers, public toilets and decision making for municipal services. She has worked with Chennai's city government and one Tamil Nadu state department to improve their data management practices to plan civic infrastructure better, and has supported the creation of data that has been used by the city government and courts to provide evidence for failures in service provision. Satyarupa is recognised as a commentator on transparency and accountability and (open) data, and the role of data intermediaries [email: [email protected]].
Notes
1 Institutions are ‘the humanly devised constraints that shape human interaction … They can be both formal (rules) or informal (conventions)’ (North, Citation1990, pp. 3–4).
2 These will be referred to below as iMK1a, iMK1b, iMK2, iOPOB1, iOPOB2, iSKK, iTC1, iTC2 and iTC3.
3 Hagen (Citation2017) cites the District Education Officer expecting there to be around 100 schools in Kibera. The data mapped from the community then showed her that there were more than 330.
4 Save one TC project specifically mapping homelessness.
References
- Ali, A., Qadir, J., Ur Rasool, R., Sathiaseelan, A., Zwitter, A., & Crowcroft, J. (2016). Big data for development: Applications and techniques. Big Data Analytics, 1(2), 1–24.
- Baud, I. (2016). Digitisation and participation in urban governance. In G. M. Gomez & P. Knorringa (Eds.), Local governance, economic development and institutions (pp. 86–97). Basingstoke: Palgrave Macmillan.
- Berdou, E. (2011). Mediating voices and communicating realities. Brighton: IDS University of Sussex.
- Bunnell, T., Miller, M. A., Phelps, N. A., & Taylor, J. (2013). Urban development in a decentralized Indonesia. Pacific Affairs, 86(4), 857–876.
- Chakraborty, A., Wilson, B., Sarraf, S., & Jana, A. (2015). Open data for informal settlements. Journal of Urban Management, 4(2), 74–91.
- Dalton, C., & Thatcher, J. (2014). What does a critical data studies look like, and why do we care? Society + Space, 29.
- Davies, T., & Perini, F. (2016). Researching the emerging impacts of open data. Journal of Community Informatics, 12(2), 148–178.
- Donovan, K. (2012). Seeing like a slum. Georgetown Journal of International Affairs, Winter/Spring, 97–104.
- Feruglio, F., & Rifai, A. (2017). Participatory budgeting in Indonesia. Making All Voices Count.
- Fox, J. A. (2015). Social accountability. World Development, 72, 346–361.
- Grillos, T. (2017). Participatory budgeting and the poor. World Development, 96, 343–358.
- Hagen, E. (2011). Mapping change. Innovations, 6(1), 69–94.
- Hagen, E. (2017). Open mapping from the ground up. Making All Voices Count.
- Haklay, M. (2013). Neogeography and the delusion of democratisation. Environment and Planning A, 45(1), 55–69.
- Heeks, R. (2017a, May 22–24). Data justice. Presentation at IFIP WG9.4 conference ICTs for Promoting Social Harmony, Yogyakarta, Indonesia.
- Heeks, R. (2017b). A structural model and Manifesto for data justice for international development (GDI Development Informatics Working Paper No.69). Manchester: University of Manchester.
- Heeks, R. (2018). Information and communication technology for development. Abingdon: Routledge.
- Heeks, R., & Renken, J. (2018). Data justice for development. Information Development, 34(1), 90–102.
- Hilbert, M. (2016). Big data for development. Development Policy Review, 34(1), 135–174.
- Hintz, A., Dencik, L., & Wahl-Jorgensen, K. (2019). Digital citizenship in a datafied society. Cambridge: Polity Press.
- Jobst, M., & Malherbe, M. (2017). Participatory budgeting in Pune. Sweden: Uppsala University.
- Kitchin, R. (2014a). The real-time city? GeoJournal, 79(1), 1–14.
- Kitchin, R. (2014b). The data revolution: Big data, open data, data Infrastructures and their consequences. London: Sage.
- Kitchin, R., & Lauriault, T. (2018). Towards critical data studies. In J. Thatcher, J. Eckert, & A. Shears (Eds.), Thinking big data in geography (pp. 3–20). Lincoln, NE: University of Nebraska Press.
- Kovacic, P., & Lundine, J. (2013). Mapping Kibera. In S. Livingston & G. Walter-Drop (Eds.), Bits and atoms (pp. 115–129). Oxford: Oxford University Press.
- Krishnamurthy, R., & Desouza, K. C. (2015). Chennai, India. Cities, 42, 118–129.
- Kshetri, N. (2014). The emerging role of big data in key development issues. Big Data & Society, 1(2), 1–20.
- Kukutai, T., & Taylor, J. (Eds). (2016). Indigenous data sovereignty. ACT: ANU Press.
- Lokanathan, S. (2017). Mapping big data for development and the global goals. Colombo: LIRNEasia.
- Lokanathan, S., Kreindler, G. E., de Silva, N. N., Miyauchi, Y., Dhananjaya, D., & Samarajiva, R. (2016). The potential of mobile network big data as a tool in Colombo’s transportation and urban planning. Information Technologies & International Development, 12(2), 63–73.
- Lundine, J., Kovacic, P., & Poggiali, L. (2012). Youth and digital mapping in urban informal settlements. Children Youth and Environments, 22(2), 214–233.
- Mann, L. (2018). Left to other peoples’ devices? A political economy perspective on the big data revolution in development. Development and Change, 49(1), 3–36.
- Menon, S. (2013). Participatory budgeting in Pune. Pune: Centre for Environment Education.
- Mitlin, D., & Satterthwaite, D. (2013). Urban poverty in the global south. Abingdon: Routledge.
- Neff, G., Tanweer, A., Fiore-Gartland, B., & Osburn, L. (2017). Critique and contribute. Big Data, 5(2), 85–97.
- North, D. (1990). Institutions, institutional change and economic performance. Cambridge: Cambridge University Press.
- Obermayr, C. (2017). Sustainable city management. Cham: Springer.
- Otiso, K. M. (2002). Forced evictions in Kenyan cities. Singapore Journal of Tropical Geography, 23(3), 252–267.
- Padmanabhan, V., Raman, N. V., & Shekhar, S. (2013). Plan B: Practical Strategies to improve planning in Indian cities. New Delhi: Indian Council for Research on International Economic Relations.
- Panek, J., & Sobotova, L. (2015). Community mapping in urban informal settlements. Electronic Journal of Information Systems in Developing Countries, 68(1), 1–13.
- Patel, S., & Baptist, C. (2012). Documenting by the undocumented. Environment and Urbanization, 24(1), 3–12.
- Pfeffer, K., & Verrest, H. (2016). Perspectives on the role of geo-technologies for addressing contemporary urban issues. European Journal of Development Research, 28(2), 154–166.
- Privacy International. (2017). Smart cities: Utopian vision, dystopian reality. London: Author.
- Rifai, A., Asterina, N., & Hidayani, R. (2016). Improving the transparency, inclusivity and impact of participatory budgeting in Indonesian cities. Making All Voices Count.
- Samarajiva, R., Lokanathan, S., Madhawa, K., Kreindler, G., & Maldeniya, D. (2015). Big data to improve urban planning. Economic & Political Weekly, 50(22), 43–48.
- Scott, J. C. (1998). Seeing like a state. New Haven, CT: Yale University Press.
- Sengupta, R., Heeks, R., Chattapadhyay, S., & Foster, C. (2017). Exploring big data for development (GDI Development Informatics Working Paper No.66). Manchester: University of Manchester.
- Shekhar, S. (2012, November 22–24). The unequal access to municipal services and the role of local elected representatives. Paper presented at N-AERIS XIII, Paris.
- Shekhar, S. (2016). Introduction: (Re)prioritising citizenship in smart cities governance. In S. Shekhar (Ed.), (Re)prioritizing citizenship: Setting a new agenda for smart cities governance (pp. 5–8). Chennai: CAG.
- Shekhar, S., & Padmanabhan, V. (2015). The quality of civic data in India and the implications on the push for open data. Chennai: Transparent Chennai, Institute for Financial Management and Research.
- Shkabatur, J. (2014). Interactive community mapping. In S. Bailur & B. Gigler (Eds.), Closing the feedback loop (pp. 71–106). Washington, DC: World Bank.
- SKK. (2010). Gilingan neighbourhood Map. Solo: Solo Kota Kita.
- Song, L. K. (2016). Planning with urban informality. International Development Planning Review, 38(4), 359–381.
- Spratt, S., & Baker, J. (2015). Big data and international development. Brighton: IDS, University of Sussex.
- Taylor, L. (2017). What is data justice? Big Data & Society, 4(2), 1–14.
- Taylor, L., & Broeders, D. (2015). In the name of development. Geoforum; Journal of Physical, Human, and Regional Geosciences, 64, 229–237.
- Taylor, L., & Richter, C. (2015). Big data and urban governance. In J. Gupta, K. Pfeffer, H. Verrest, & M. Ros-Tonen (Eds.), Geographies of urban governance (pp. 175–191). Cham: Springer.
- Townsend, A. M. (2013). Smart cities. New York, NY: W.W. Norton.
- UN. (2014). A world that counts: Mobilising the data revolution for sustainable development. New York, NY: Author.
- UN-Habitat. (2016). World cities report 2016. Nairobi: Author.
- UN-Habitat. (2017). New urban agenda. Nairobi: Author.
- van Veenstra, A. F., Esmeijer, J., Bakker, T., & Kotterink, B. (2014). Data and the city. Delft: TNO.
- Willis, K. (Ed.). (2017). Whose right to the smart city? Plymouth: Plymouth University.