
ABSTRACT
The internet is an increasingly influential actor and arena for debating emerging sustainability controversies, but studies often overlook the role of visualisations in online spreading of information. This paper offers a way to better understand this role: what images do competing online actors use, are there differences between opponents and proponents, differences between internet regions, and are there shifts in their online visualisations over time? Adopting a controversy studies perspective and the digital methods approach, we studied the online spread of visual information. We compared the use of visualisation about shale gas on top-ranked pages in the internet regions of South Africa, Mexico and the United Kingdom in 2018 and 2019. The results indicate a connection between the actor’s standpoints in the controversy and the type of image used. In Mexico, proponents and neutrals used, most of all, photographs of people (officials). Opponents posted more data visuals. South African and British neutral actors used more data visuals, while proponents posted landscapes and opponents photographs of people (protesters). Also, we noticed that changes in the actor’s position in the controversy between 2018 and 2019 coincided with changes in the use of type and content of visualisations. Context-specifics of each country offered possible explanations for these shifts in standpoint and visualisation of the controversy. Our study indicates that visuals are highly relevant digital objects in public debate and the decision-making process.
Introduction
Public debates about sustainability issues often become highly politicised and these debates increasingly shape policies for environmental and sustainability issues (Dodge & Metze, Citation2017; Hansen & Cox, Citation2015; Williams & Sovacool, Citation2019). Although almost everyone will support sustainable and environmentally friendly policies and attitudes (Lindahl et al., Citation2016); many issues, such as new energy technologies or siting issues have an impact on public perception, and may induce public and policy controversies (Boudet, Citation2019).
Hydraulic fracturing or ‘fracking’ for shale gas is a relatively new technology that generated a global controversy (Dodge & Metze, Citation2017; Hopke & Simis, Citation2017; Williams et al., Citation2017). The debate consisted of diverging interests and has a geopolitical dimension all discursively uttered in disagreements about shale gas exploration as an environmental risk and economic opportunity (Bomberg, Citation2017; Bugden et al., Citation2017; Dodge & Lee, Citation2017; Lis & Stankiewicz, Citation2017; Valerio-Ureña & Rogers, Citation2019; Williams et al., Citation2017; Williams & Sovacool, Citation2020). Some studies highlight the debate’s visual aspects, as they influence how this controversy has evolved in different domains (Hendriks et al., Citation2017; Krause & Bucy, Citation2018; Metze, Citation2017; Sarge et al., Citation2015). Among these, the internet is a particular arena where the shale gas controversy evolved (Metze, Citation2018a).
Online, different publics than in traditional media or in parliamentary debates engage around an issue (Rogers & Marres, Citation2000). They take stances, share information, and aim to gain attention for that information by use of visualisations. In addition, those internet actors often promote possible solutions. As such, the internet and social media platforms have become one of the main arenas where controversies are debated (Marres, Citation2015; Rogers, Citation2013). Understanding the internet as a field of governance, we acknowledge it as a space for public and networked production, circulation and exchange of information, that is ultimately shaping behaviours, decisions and alignments (Castells, Citation2008; Mol, Citation2006). The internet is no longer merely a space, a medium and a source; rather, it has become an influential actor. Websites and digital platforms – such as Twitter, Facebook, Google, Wikipedia, etc. – are non-human actors with affordances, content, and dynamics of circulation of information. They are fundamental to understanding social practices and decision-making dynamics (Rabello & Gouveia, Citation2019; Rogers, Citation2019; Stevens et al., Citation2016). They also have an important role in making information accessible and created an overabundance of information for the general public (Camargo & Grant, Citation2015).
Within this data-profusion, visual content is essential as it engages the public by telling a story about the policy issue, which can significantly affect the public’s interpretation and alignment to sides of the contest (Hullman & Diakopoulos, Citation2011). As digital objects and networked content, visuals cross boundaries, influencing the problem definition and pointing to specific positions and solutions (Metze, Citation2020; Niederer, Citation2018; van Beek et al., Citation2020). For instance, images of flames from tap water from the documentary Gasland circulated online and can be considered an essential element in how the debate about shale gas exploration evolved. For instance, in the United States, visuals strengthened the association with risk (Gommeh et al., Citation2021; Mazur, Citation2016). In the Netherlands, visualisations contributed to a frame-shift and possibly to the debate’s evolution until the technology was banned (Metze, Citation2017, Citation2018b, Citation2020).
In this paper, we investigate the visual aspects of the online debate about hydraulic fracturing in three different internet regions, or web spheres.Footnote1 The countries associated with these spheres were each in a different stage of the emerging controversy in 2018. In the United Kingdom (UK) it was a full-fledged controversy (Bomberg, Citation2017); in South Africa (SA), it was becoming contested (Atkinson, Citation2018; De Wit, Citation2011); and in Mexico, governing actors were still exploring the potential of shale gas production (Valerio-Ureña & Rogers, Citation2019).
In this exploratory study, we aimed to gain more insights into the importance of visualisations as distributors of information in emerging online controversies. We identified how proponents, opponents and neutral actors visualised the controversy at two different points in time: 2018 and 2019. The research questions were: a) who are the online actors involved in the controversy (the online public); b) which types of visuals does each position – pro, anti or neutral – use to support their standpoint? c) Are standpoint and type and content of visualisations shifting over time? d) What are possible country-specific explanations of these shifts?
Below, we first give a short overview of the shale gas controversy's contextualities in each country. Second, we conceptualise the role of visuals on the internet, especially in debates like shale gas exploration, and the relevance of applying digital methods to understand them. Third, we present our methods for selecting, gathering, and analysing the data. Fourth, we present the results of the visual analysis and actor analysis. To conclude, we explore possible explanations for the shifts in the standpoints and use of visualisations over time for each country.
Country background information
The three regions we selected, all considered shale gas a considerable potential source of energy based on numbers provided by, for example the US Energy Information AssociationFootnote2, about estimations of technically retrievable shale gas. In addition, academic publications indicate for each of the countries an emerging controversy. This makes them interesting cases to investigate the role of visuals on this online controversy.
Mexico has one of the largest gas shale reserves of the globe: ∼545 trillion ft³, (US Energy Information Administration, Citation2011). In 2014, the at the time President Enrique Peña approved the Hydrocarbons Law and several thousands of wells have been installed. In parallel, environmental organisations and political opposition groups have pointed out the potential negative consequences of this activity (El Universal, Citation2018). In August 2018, the newly elected President Andres Manuel López Obrador announced the intention to end shale gas production practices (Reforma, Citation2018). In contrast, public figures, such as the former president of Mexico Vicente Fox, continued to support hydraulic fracturing (Loredo, Citation2018).
In SA, shale gas reserves were estimated to be ∼390 trillion ft³, and contestation revolved around environmental risks, economic and energy opportunities, and the place of shale gas in a complete energy mix (Andreasson, Citation2018). The controversy in South Africa has unique characteristics. Particularly in the Great Karoo area, for which shale gas production was foreseen, there is a greater risk of water contamination. It is an arid area with low rainfall and scarce potable water reservoirs (De Wit, Citation2011; Tucker & van Tonder, Citation2015). Studies point out the dangers of fracturing for biodiversity and fragile flora. However, Karoo citizens live in extreme poverty and hydraulic fracturing is seen as an opportunity to create jobs in the region (De Wit, Citation2011).
In the UK, estimations of shale gas reserves were 1,329 trillion ft³, and the national government attempted to position itself as a pioneer of European, safe, sustainable shale gas exploration. Some studies identified coalitions on both sides of the controversy. Bomberg (Citation2017) pointed to the anti-shale coalitions as the most successful and dominant until 2017. More recent studies indicate that pro-shale framing has become prevalent in the policy debate. Most UK governments have supported shale development over the last years (Williams & Sovacool, Citation2019, Citation2020). Nonetheless, the authors also found a high level of anti-shale framings, which suggests an ongoing contest at formal national political sites. These anti-shale discourses are more focused on land use issues and impacts on the landscape, like the claims identified by Bomberg (Citation2017), and point more specifically to governance affairs.
Digital methods for mapping visual aspects of online controversies
‘Mapping controversies’ originates from Bruno Latour's studies of scientific claims made to defend different perspectives, gain knowledge and engage in a public debate on science and technology themes (Latour, Citation1987). To map a controversy, we usually identify and track arguments and claims of expertise presented by opposing actors in a debate. It also allows understanding the complexity of the controversial object in the dispute (Latour, Citation2005).
Since his first writings about controversies, Latour has highlighted the importance of the visuals in a debate. Images are mobile, presentable, readable, combinable, and embeddable in different settings and contexts. Therefore, they are strategic elements for arguing and convincing someone of a particular perspective (Latour, Citation1986). In online controversy mapping, visual content has been considered a key aspect due to its networked nature, matching the same logics as the web (Metze, Citation2018a; Niederer, Citation2018; Pearce et al., Citation2019).
Studies about sustainability controversies have proposed digital methods for mapping online public debates and the many objects – visuals included – that are used in debates about controversial issues on digital platforms (Marres & Moats, Citation2015; Marres & Weltevrede, Citation2013; Metze, Citation2018b; Rogers, Citation2013, Citation2015, Citation2019; Pearce et al., Citation2018, Citation2019). Digital methods consist of ‘the deployment of online tools and data for the purposes of social and medium research’ (Rogers, Citation2019, p. 21). They can be used to study society with the web as a medium. It acknowledges the internet and social media platforms not only as a source of ephemeral information, but also as a non-human actor itself in the dynamics of social practices and decision-making (Marres & Moats, Citation2015; Marres & Weltevrede, Citation2013; Rogers, Citation2013, Citation2015).
Digital methods usually focus on an object or on a combination of them, such as a ‘digitalised object’ (e.g., text, images, profiles) or ‘natively digital objects’ (e.g., hashtags and URLs) (Rogers, Citation2013). As methodology, they help track how these objects or topics combine, travel, collapse and are repurposed online. (Omena, Citation2019; Rogers, Citation2019). The analysis of digital objects can be conducted using open web content, such as links and web pages’. Usually, from this data, we build lexical maps, source actors lists and perform visual analyses of the topic (Rogers, Citation2019).
These authors also acknowledge that, when mapping online controversies, the visuals, metaphor, issue, or any other digital or digitalised object can be central. Additionally, understanding the online debate by grounding it in its context is pivotal. The controversy will not be the same in one place as the other. In addition, we need to take into account actors and standpoints in the debate: to who is this topic controversial and what positions are defended by debaters? (Marres, Citation2015; Marres & Moats, Citation2015; Marres & Weltevrede, Citation2013; Rogers, Citation2015, Citation2019).
Building upon studies that used the digital methods approach to discuss phenomena of online public debates in different topics (Marres & Moats, Citation2015; Marres & Weltevrede, Citation2013; Metze, Citation2018a; Pearce et al., Citation2018, Citation2019; Rogers, Citation2013, Citation2015, Citation2019), for the shale case study, we focused on the visuals embedded on the URL's content, acknowledging them to be entities acting in the debate. Understanding these images as a networked artefact (Niederer, Citation2018), we conducted a visual network analysis, in which we read visual properties (what is in the image) and the network's spatial configuration (clustering of similar type of visualisations). In doing so, clusters of elements (here images) emerge based on the type and number of connections between them. Clustering them by similarity in content and digital affordances like hashtags or hyperlinks rendering is a common way to create maps for illustrating these images’ circulation across platforms (Pearce et al., Citation2018; Venturini, Citation2010; Venturini et al., Citation2018).
Methods
To answer our research questions, we used academic literature and policy documents from the three countries to gain a contextual understanding of the controversies. In addition, we scraped text and visuals from the Google top-ranked URL’sFootnote3 in the web spheres of the United Kingdom, South Africa, and Mexico on 10 July 2018 and 19 December 2019.Footnote4
Our research protocol contained five steps: 1) mapping the actors and coalitions in the three-country web spheres involved in the shale gas controversy; 2) tagging the actors as a proponent, opponent, or neutral through a content analysis of their URLs; 3) running a visual network analysis by scraping the visuals each actor use to depict their point, determining how these actors frame shale gas exploration, and what kind of visuals clusters are used to illustrate these framings on the debate; 4) contextualising the visuals characteristics between proponents, opponents and neutral actors across these web spheres’ local situation; 5) relating the findings to the context specifics of the controversies in each country.
Following Latour’s concept of programme and anti-programme as opposite agendas in a controversy (Akrich, Citation1997; Latour, Citation1990, Citation2005), in the first step we chose keywords that represented different sides on the shale gas exploration controversy. As proposed by Rogers (Rogers, Citation2017, Citation2019), the term ‘programme’ refers to claims and efforts promoting a particular proposal campaign or project. Conversely, the ‘anti-programme’ opposes these efforts or projects. A third position would be the neutral, which applies a neutral discourse aiming more to inform than to defend a position.
We first designed queries representing pro-exploration, anti-exploration and neutral positions. Based on Hopke and Simis (Citation2017), we adopted the three keywords: ‘fracking’, to represent the anti-position (opponents); ‘shale gas’, as a pro-position (proponents); and ‘hydraulic fracturing’ as a neutral expression.Footnote5 We opted to use Google to identify a source list of actors that debated it online. This search engine also operates as a ranker for actors (websites) in each social issue (keywords queried), which points to the trends of dominant voices online and their concerns. (Rogers, Citation2017, Citation2019). Using the tool Googlescraper (Lippmannian Device)Footnote6, we scraped top-ranked URLs per country, querying different searches for each keyword. We scraped the 15 most relevant results according to Google's rank algorithm (duplicates resulted in fewer data points). Then, we merged the outputs per search in a single list of the most significant actors and URLs per country.
The second step was manually classifying the URLs as an informant (a general website mentioning actors, news webpages like bbc.com) or an actor itself (an active person or organisation on the debate, like www.greenpeace.org). For informants, we registered the name of actor(s) mentioned, then merged the actors from original URLs with those referred by informants in one single list of actors. Finally, after entering each website and checking for direct declarations, two independent researchers (for validation and bias control) classified them as pro (proponent or supporter), anti (opponent or against) or neutral on shale gas exploration.
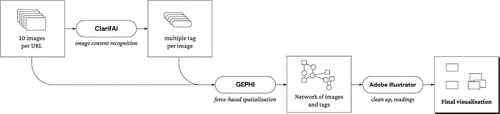
Our third step involved using the Google Image ScraperFootnote7 tool to extract up to 20 top-ranked images connected to the shale gas controversy from their websites with the previously used queries. Obtaining the visual repertoire used by actors in shale gas controversy allows us to understand more about the connection with their positioning and the visuals they chose to adopt. In this step, we identified recurring and connected visual content and type of visualisations posted by the actors of various stances in different countries. For this, we used the results from step 1 and 2, and in addition conducted a visual analysis to mapped the related images (Niederer & Colombo, Citation2019). The images were run through ClarifAI API (Sood, Citation2017), a computer vision algorithm that recognises tags (concepts, entities, or objects) in the content. The tagging was done through a web interfaceFootnote8 developed by DensityDesign Lab. Images and tags by ClarifAI API were turned into nodes of a networkFootnote9 and connected when they share one or more concepts in the dataset. The network was visualised with Gephi (Bastian et al., Citation2009), an open-source programme that computes nodes’ spatialisation based on how they are interconnected using a force-based algorithm, called ‘Force Layout’. In addition, images were superimposed on the network using Adobe Illustrator (Adobe Inc., Citation2019) to obtain the final visualisation: the closer they are, the higher the number of tags they share.
The fifth step consisted of reading, interpreting and annotating results from the network through a visual analysis (Venturini et al., Citation2014). When clusters of similar images emerge and are highlighted, the stance of the actors that used them could be traced back from the original dataset. This procedure allowed us to examine the shale gas visual content on actors’ websites. We ran a controversiality analysis comparing all the image networks per position and per country [actors-keywords-URL-images-position] with data visualisation techniques.
Finally, the actor analysis and visual analysis results were grounded and related to policy events in each of the country to explore possible explanations for shifts in the standpoints in the debate and the use of visualisations over time .
Figure 1. Visual rendition of the protocol to realise the networks of images later analysed.
Findings
In this section, we answer the research questions a) who are the actors involved on the controversy online debate; b) which types of visuals does each position – pro, anti or neutral – use to support their position? c) Is the position in the debate and the use of type and content of visualisations shifting within one year? d) we ground these findings in the context-specifics of each country and explore possible explanations for the shifts over time.
Who is involved in the shale gas controversy in these countries and what do they defend online?
In 2018 the URL’s of the Mexican web sphere were dominated by proponents of shale gas, s such as the – at the time president of Mexico Enrique Peña Nieto, governmental departments, and public associations, such as Petróleos Mexicanos, Secretaría de Energía and Asociación Mexicana de Empresas de Hidrocarburos (Amexhi). In 2019, there were fewer proponents on the internet, and those in favour were mostly companies and international organisations that support shale gas exploration. Between 2018 and 2019, Centro Mario Molina was the only actor who shifted position from opponent to neutral. Other remarkable changes were governmental departments’ positions, such as Secretaría de Medioambiente y Recursos Naturales, from neutral to anti-fracking, as well as Agencia de Seguridad, Energía y Ambiente, Petróleos Mexicanos, Secretaría de Energía that changed from pro-fracturing to neutral. As previously mentioned, the outgoing government's official position (2012-2018) was more pro-fracking, while the incoming government's initial position was more anti-fracking. A possible explanation for these changes most probably was the government change on December 1st, 2019.
The South African online debate included more, and more varied group of actors than in Mexico. Interestingly, there were no shifts in positions between 2018 and 2019. However, many actors from 2018 disappeared from the online debate in 2019 and new actors engaged in the second year, which indicates an ongoing controversy. In addition, this also seems to signal a minor shift from a general favourable online public to a more neutral one. For example, the Department of Science and Technology participated in de online debate in 2018 but disappeared in 2019. A possible explanation is that in 2018 there was a close collaboration between the Department of Science and Technology and the DMR and they both were in favour of hydraulic fracturing. In 2019, the head of the Department of Science and Innovation (formerly Department of Science and Technology), Blade Nzimande, no longer prioritised fracking, and both departments were no longer visible in the online debate. In addition, the Supreme Court of Appeal ruled that the fracking regulations published by the Minister of Mineral Resources in 2015 would not be enforced (Andreasson, Citation2018; De Wit, Citation2011).
In the online debate of the web sphere of the UK, different actors participated in 2018 and 2019; however, the controversy remained balanced with opposing, proposing and neutral actors. Most striking differences in participating actors was the absence in 2019 of the previously opponents Quackers.org and the Scottish government, the European Commission and Historic England (neutrals), and the UK Onshore Oil and Gas (proponents). Newcomers were some opposing local committees, such as the City of York Council and the North Yorkshire County Council. Larger organisations, such as the National Park Authority and Young People's Trust for Environment, were also against hydraulic fracturing in the UK. In 2019, there were more academics active on the internet that had analysed possible impacts of fracking. Governmental organisations, such as the National Audit Office, the Oxford Institute for Energy Studies and the Royal Academy of Engineering published technical reports. Finally, Exxon Mobil, Shell and Tendeka participated in the online controversy as proponents and investors on the British shale gas market in 2019. Remarkable shifts were (1) those from neutral to anti-fracking from the Lancashire County Council and Oil and Gas Authority between 2018 and 2019. This shift may have been caused by the publication of studies about local impacts of fracking, leading these actors to adopt the opponent discourse online; and (2) the UK Conservative Party and the UK Government changed from proponents to neutral precisely during the elections and the Brexit debate. This suggests that this topic was relevant for politics. No listed actor shifted the position from opponent to neutral or proponent.
Which types of visuals does each position – pro, anti or neutral – use to depict their claims?
We retrieved visuals from the URLs of the actors identified in 2018 (2.341 images) and 2019 (2,167 images) in the three web spheres. We analysed these visuals for similarities and differences in type of image and content and we also checked whether different positions in the debate led to different visualisations. show a network of resembling images that the online actors used in 2018. show those from 2019.Footnote10
Figure 2. Visuals on the debate (all the images used by actors, 2018). The network is clustering the images per theme/content.
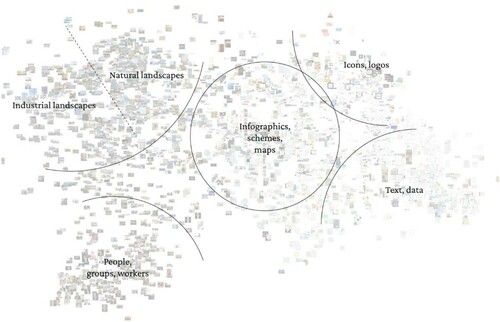
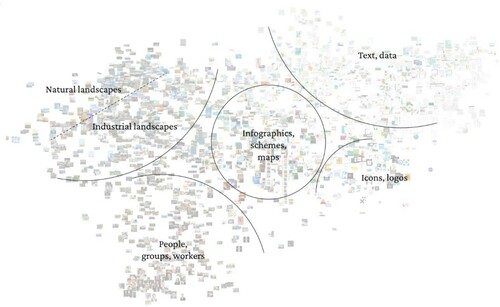
Figure 3. Visuals on the debate (all the images used by actors, 2019). The network clusters the images per theme/content.
There are three general themes in the 2018 visuals: images depicting people, landscapes, and data. When taking a closer look, we identify six clusters in the image sort: on the upper left, there are industrial landscapes and hydraulic fracturing fields, followed by natural landscapes. Down left, there are images of workers and people like politicians, spokespersons, and groups. On the right side of the network, there is a predominance of data in infographics and maps in the centre, together with a reasonable number of icons and logos on the upper right and text (mostly images of papers and statistics) right below.
Even though the online actors’ composition was different between the three web spheres, approximately the same relative use of images in each cluster were detected in both points of time. The spread of use of the type and content of visuals was rather similar, which points to a thematic saturation of the shale gas online controversy.
We than investigated if certain image types and content were posted in relation to the actors’ standpoint in the debate. shows the number of images retrieved per year/country, according to the actor’s position. The and below depict the same clusters of images as shown in and , but now with each image coloured according to the actor's position who posted it: green for images used by pro-fracking actors, grey for images used by neutral actors, and red for images used by anti-fracking actors.
Figure 4. Visual network of shale gas controversy in 2018, per country. The colour of the images converted to dots represents the positioning of the actor on the debate. The place of the dot in the network represents the type of cluster the image belongs to (see ).
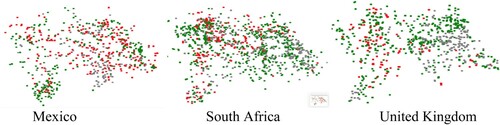
Figure 5. Visual network of shale gas controversy in 2019 per country. The colour of the images converted to dots represents the positioning of the actor on the debate. The place of the dot in the network represents the type of cluster the image belongs to (See ).
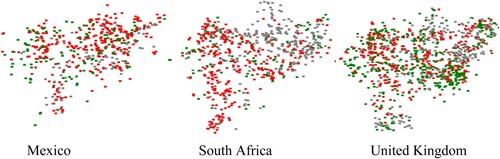
Table 1. Images retrieved per year/country, according to the actor’s position.
Relating the type and content of the visual to the debate's position, these networks in and show that pro-fracturing actors use all kinds of images in South Africa and the United Kingdom. In Mexico, proponents and neutrals use more visuals depicting people (most of all officials), although data and logos/icons also appear considerably. South African and British neutral actors tend to use more visuals connected to all sorts of data and facts. Antifracking actors in both web spheres tend to focus more on landscapes and people (protestors). In the Mexican case, anti-fracking actors used all kinds of images to depict the debate, but they are using more infographics, schemes, and other data-related visuals most of all depicting environmental risks.
Comparing the predominance of coloured dots in 2018 and 2019, we observe a decrease in visual usage amongst pro- actors (green dots). The spreading of red dots in 2019 shows opponents using all types of visuals, which can point to their awareness of the impact of visuals on the debate. This increase of opponents visual is more prominent in South Africa and United Kingdom.
In 2019 the pro-actors in the United Kingdom again posted a broad variety of types of images. Neutral actors in South Africa started to use more data visualisations. In Mexico, there was a decrease in posting images of people, and an increase in data visualisations about environmental risks. Striking is also a higher number of pro actors’ visuals in Mexican URLs.
In general, the is little presence of academic or scientific entities’ URL in the digital debate for the three countries must be highlighted. Furthermore, when manually coding the actors per position, we noticed that the political agenda largely dominated the internet's debate.
Grounding results
So far, we have explored possible connections between the content and type of posted images on one hand, and positions of online actors in a controversy on the other. We also compared this between three different internet regions and in two different points in time. These analyses indicated that shifting of positions relates to shifts in posting image types and content. In this section, we aim to explore possible explanations of these findings by linking these online debate findings with the events in each country. In digital methods, this is called ‘grounding the debate’ (Rogers, Citation2013, Citation2019), which allows a better understanding of the role of online visuals when depicting a local debate.
The Mexican data show that the prominent online actors in 2018 were most of all companies and the government that were promoting the shale gas agenda, and some civil organisations arguing against it based on the experiences and data from other countries. Images of people and groups – mostly governmental officials – were, then more prominent amongst proponents. In 2019, after a change of president and political party, and with a more technical and internationalised debate, Mexican pro-actors decreased (mostly companies), and some actors made a shift from proponent to neutral and from neutral to opponent. In 2019, we see opponents using more types of images (e.g., data visualisations), while proponents, in general, spread the visual presence on the debate.
In South African results of 2018 and 2019, we see mainly four groups of actors: industry actors (who are, in general, proponents), activists and NGOs (which are typically opponents), governmental actors, and scientists. There is a lower rate of industry actors in 2019 top rank results than 2018, and a higher rate of activists and NGOs in 2019 than 2018. Besides, we see a lower rate of pro-actors and a higher rate of against-actors in 2019 than in 2018. The lower rate of participating industry actors, the higher rate of activists and NGOs, and the fact that they are mostly against-fracking actors might indicate a change in public involvement. In 2019, the presence of pro- hydraulic fracturing firms, at least in the digital sphere, is weaker, while actors that voice interests of specific populations (such as farmers) have a more substantial online presence. This observation is an important finding, as South Africa is a country in which interests of the community are rarely part of the discourse.
As for the UK, the controversy was as intense in 2018. Local associations were pressuring the government (pro shale gas exploration) to ban this method. In 2019, the government became neutral and signed no exploration agreements after some anti-fracking local pressure. This shifting was probably a consequence of imminent elections and Brexit discussions when many government sectors opted to ‘neutralise’ the discourse to preserve votes on other agendas. The British visuals in 2018 were linked to technocratic concerns (such as safe operations, economic viability) and possible danger to cultural and natural local heritage. Over the next eighteen months, more significant community protest groups put pressure on local governments, especially in areas where shale gas exploration was about to be implemented. It resulted in a higher prominence of these actors in the online debate in 2019, together with the presence of a more substantial visualisation against hydraulic fracturing in all clusters of images.
Discussion
This study was based on a conceptual approach in which visuals are digital objects in online controversy mapping, and we adopted digital methods to study the spread of visual information by online actors with a positive, negative, or neutral stance about hydraulic fracturing for shale gas exploration. The results revealed (1) the top-ranked actors in the online debate in three different internet regions, (2) their positions in the debate, and (3) indicated patters in the relations between position in the controversy, and the posting of particular image types. In addition, we showed that online actors do change their position over time, and the posting of visualisations changes accordingly.
One main conclusion is that there were no changes in the general spread of type and content of visuals, which in this case were people (spokesperson, protest groups, workers), landscapes (natural and industrial) and data (graphs, text, icons, and infographics). The division over these different categories remained the same between 2018 and 2019. This indicates a thematic saturation on shale gas controversy's visuals, meaning that there is a specific set of visualisation types (people, landscapes, and data) that are strongly associated with shale gas extraction discussions.
Besides, controversy stage, actor's position in the debate, and the use of these visuals seem to be related. In the early stages when shale gas seemed a promising energy source, governmental actors and industry dominated the online debates, and posted photographs of governmental officials (Mexico), but when the controversy intensified opponents varied more in types of images. They used relatively more data visualisations of environmental risks. In SA and the UK, the online controversy made significant shifts between 2018 and 2019. In SA, the opponents became more dominant in the online debate, mostly because of a drop out of proponents. In the UK, the debate became more neutral-negative, probably because of a shift in attention in the public and policy debates toward Brexit. This shift in issue attention is a phenomenon well known in media-attention studies (Downs, Citation1972).
Hence, when ‘grounding’ the results, local ephemerides in each country offer interesting insights about the differences in these images’ usage when comparing places and positions over time. The findings were achieved through classic content analysis techniques, manual coding (for the identification of relevant actors’ position), and automated visual network analysis (which relied mostly on computer vision for clustering images per type and content and identifying stances). Therefore, when discussing the results, we must consider the dialogic interaction between human and machine involved. There is no ‘human vision’ opposing a ‘machine vision’. Our results have analytical value when the machine mode of seeing is contextualised – what we explored when ‘grounding’ the online products (Rogers, Citation2019).
Moreover, when working with computer-generated visual networks, we must account for the implications of statistically treating visual content. The machine associates the image content based on a labelling and tagging system of the image, enabling the algorithm to operate to cluster the images. This approach is appropriate to specific research questions like ours, but it does discard other possibly relevant visual information. Due to the algorithm's dependence on the ‘textual representation of the image’ in the tag, we run the risk of considering the computer vision output as the truth. The manual interpretation of the visuals and relating it to context specifics – the ‘grounding’ – worked to address this limitation. This also helped to bridge the division between image and text. To integrate textual and visual analysis, without overlooking our main object – visuals – we used the actors’ textual content to inform their positioning by integrating interpretive (qualified) and digital (quantified) understanding.
Another criticality is that many important actors in the controversy were not speaking for themselves online (through personal websites, for instance), being recognisable and reachable only through informants. To mitigate this bias, we included on our actor's list those who were mentioned by top-ranked news and stakeholders URLs (as explained on Methods section). We determined each actor's position based on their online content. Even though we were not able to verify whether this is their real position within the scope of this research, we minimised bias in the positioning with two independent researchers’ assessment.
In the future, visual network and visual framing studies of all sorts of sustainability controversies can build on our automated visual analysis combined with actors’ stances and improve the complementarity of interpretive and digital methods. Moreover, our exploratory study can be further strengthened by statistical analyses of the relations between actors’ standpoints and the use of type and content of the visuals to better comprehend the role visuals play in spreading online information and misinformation.
Conclusion
This paper employed digital methods to map the visual elements involved in the online debate about shale gas exploration. We specifically investigated how actors used visuals to support their positions in the three different web spheres of Mexico, South Africa and the UK. We explored the role visuals play in depicting different sides of a sustainability controversy, and how it evolved.
We found that the shale gas controversy overtime was visualised in similar ways, pointing to an established visual vernacular for this topic. Landscapes (natural and industrial), people (individual and groups), and data (text, infographics, maps, icons) were types of visual used equally in both years and with different intensities by different actors and country-related web spheres. South Africa's actors used the highest number of images in the dataset, of which a considerable amount were landscape images. They also used research paper images in neutral and positive stances. The UK most neutral actors posted data visualisations from research papers. Mexican actors posted mostly photographs of people (proponents) and data visualisations of risks taken from research papers and maps (opponents).
Differences found in the usage of these images when comparing views on the debate led to the presumption that the shifting on certain actors’ position over time, and consequently, the dominance of specific visual stances, can be explained by country specificities.
Overall, our results illustrate the web as a field of governance dynamics. As digital objects, visuals play an essential part in sustainability controversies, public debate, and decision-making process.
Supplementary Material.docx
Download MS Word (40.9 KB)Disclosure statement
No potential conflict of interest was reported by the author(s).
Additional information
Funding
Notes on contributors
Elaine Teixeira Rabello
Elaine Teixeira Rabello is currently working at KIT Royal Tropical Institute. She was associate professor at the Social Medicine Institute, State University of Rio de Janeiro, and worked as a postdoctoral researcher at the Public Administration and Policy Group, Wageningen University & Research.
Efrat Gommeh
Efrat Gommeh is a PhD candidate at the Public Administration and Policy Group. Her research integrates interpretive and digital methods to investigate digital images in various policy domains.
Andrea Benedetti
Andrea Benedetti is working as a PhD candidate at the DensityDesign Lab. His research focusses on how data representation of large archival collection can enhance the creative process.
Gabriel Valerio-Ureña
Gabriel Valerio-Ureña is a research professor at the Tecnologico de Monterrey, Mexico. He is a computer system engineer and has a Master's degree in Information Technology Management. He has published several scientific articles on the impact of social media in educational, commercial and social environments.
Tamara Metze
Tamara Metze is Associate Professor at the Public Administration and Policy Group. Her research focusses on controversies in sustainability transitions, and the role of framed facts in those. She is the PI of the NWO-MVI project Traveling of Framed Facts and Uncertainties. [email: [email protected]]
Notes
1 Here, we borrow the idea of web spheres from Rogers (Citation2013) to characterize internet domains related to countries (ex: ".uk", ".mex", and ".sa"). According to the author's discussion, what happens in these internet "regions" is somehow connected and representative of the geographic setting. Therefore, mapping the web sphere would allow us to "ground" digital research results.
3 Google has different national domains (country-based versions). Top-ranked URLs are the top search engine results for three queries in distinct languages and distinct national domains of Google web search engine. Details on the researched domains and queries are given further in this section. For discussions and examples of national domains of Google's relevance for digital research, see Ben-David et al. (Citation2018); Rogers (Citation2013).
4 On 10 July 2018, during the Digital Methods Initiative Summer School at the University of Amsterdam, the team made the first data collection and decided to follow-up with a second time period to add a comparative analysis, after noticing shifting perspectives in the news and grey literature (e.g El Universal, Citation2018; Loredo, Citation2018; Reforma, Citation2018) by the end of 2019. This comparison could offer insights about the topic and allow us to ‘ground’ the results seen in local context changes. The day of December 19th was random.
5 The three keywords were also investigated in Spanish, in consideration to Mexican publications.
6 Also known as ‘The Search Engine Scraper’, this tool allows scraping the search results for a given query. It has as output a list of results the search engine returned for the query, algorithmically ranking considered. You can choose which search engine you want to scrape. For this study, we searched on Google. See https://tools.digitalmethods.net/beta/searchEngineScraper/.
7 This tool uses images.google.com to query specific sites for images connected to particular tags. For each URL given, Google is asked if a keyword occurs on each URL. Creators alert that Google uses its algorithms for determining if a particular image belongs to a specific keyword, so it is by no means exhaustive, correct or complete. See https://tools.digitalmethods.net/beta/googleImages/
8 DensityDesign Lab’s ‘Image tagging tool interface’: https://densitydesign.github.io/dd-image-tagging/
9 Networks are comprised of nodes (entities, people, images, or others) and links, that define the connections between the various nodes, therefore building a network.
10 High-definition and interactive versions of these image networks are available in https://observablehq.com/@andreabenedetti/shale-gas-2018 and https://observablehq.com/@andreabenedetti/shale-gas-2019.
References
- Adobe Inc. (2019). Adobe Illustrator. (Version 23.0.2) [Computer Software]. https://adobe.com/products/illustrator
- Akrich, M. (1997). The de-scription of technical objects. In W. E. Bijker & J. Law (Eds.), Shapin technology, building society (2nd ed., pp. 205–224). MIT Press.
- Andreasson, S. (2018). The bubble that got away? Prospects for Shale gas Development in South Africa, 5(4), 453–460. https://doi.org/10.1016/j.exis.2018.07.004
- Atkinson, D. (2018). Fracking in a fractured environment: Shale gas mining and institutional dynamics in South Africa’s young democracy. The Extractive Industries and Society, 5(4), 441–452. https://doi.org/10.1016/j.exis.2018.09.013
- Bastian, M., Heymann, S., & Jacomy, M. (2009). Gephi: An open source software for exploring and manipulating networks. International AAAI Conference on Weblogs and Social Media, San Jose, California.
- Ben-David, A., Amram, A., & Bekkerman, R. (2018). The colors of the national Web: Visual data analysis of the historical Yugoslav Web domain. International Journal on Digital Libraries, 19(1), 95–106. https://doi.org/10.1007/s00799-016-0202-6
- Bomberg, E. (2017). Shale we Drill? Discourse dynamics in UK fracking debates. Journal of Environmental Policy & Planning, 19(1), 72–88. https://doi.org/10.1080/1523908X.2015.1053111
- Boudet, H. S. (2019). Public perceptions of and responses to new energy technologies. Nature Energy, 4, 446–455. https://doi.org/10.1038/s41560-019-0399-x
- Bugden, D., Evensen, D., & Stedman, R. (2017). A drill by any other name: Social representations, framing, and legacies of natural resource extraction in the fracking industry. Energy Research & Social Science, 29, 62–71. https://doi.org/10.1016/j.erss.2017.05.011
- Camargo, K., & Grant, R. (2015). Public health, science, and policy debate: Being right Is Not enough. American Journal of Public Health, 105(2), 232–235. https://doi.org/10.2105/AJPH.2014.302241
- Castells, M. (2008). The new public sphere: Global civil society, communication networks, and Global governance. The ANNALS of the American Academy of Political and Social Science, 616(1), 78–93. https://doi.org/10.1177/0002716207311877
- De Wit, M. J. (2011). The great shale debate in the Karoo. South African Journal of Science, 107(7/8), 9. https://doi.org/10.4102/sajs.v107i7/8.791
- Dodge, J., & Lee, J. (2017). Framing dynamics and political gridlock: The curious case of hydraulic fracturing in New York. Journal of Environmental Policy & Planning, 19(1), 14–34. https://doi.org/10.1080/1523908X.2015.1116378
- Dodge, J., & Metze, T. (2017). Hydraulic fracturing as an interpretive policy problem: Lessons on energy controversies in Europe and the U.S.A. Journal of Environmental Policy & Planning, 19(1), 1–13. https://doi.org/10.1080/1523908X.2016.1277947
- Downs, A. (1972). Up and down with ecology—The issue-attention cycle. The Public interest, 28(Summer), 38–50.
- El Universal. (2018, August 4). Piden a AMLO cancelar proyecto hidráulico en NL. Hora Cero Web. https://www.horacero.com.mx/nacional/piden-a-amlo-cancelar-proyecto-hidraulico-en-nl/
- Gommeh, E., Dijstelbloem, H., & Metze, T. (2021). Visual discourse coalitions: Visualization and discourse formation in controversies over shale gas development. Journal of Environmental Policy & Planning, 23(0), 363–380. https://doi.org/10.1080/1523908X.2020.1823208
- Hansen, A., & Cox, R. (2015). The Routledge Handbook of Environment and communication. Routledge.
- Hendriks, C. M., Ercan, S. A., & Duus, S. (2017). A picture worth a thousand words? Visuals in public deliberation. 3rd International Conference on Public Policy (ICPP3), 37.
- Hopke, J. E., & Simis, M. (2017). Discourse over a contested technology on twitter: A case study of hydraulic fracturing. Public Understanding of Science, 26(1), 105–120. https://doi.org/10.1177/0963662515607725
- Hullman, J., & Diakopoulos, N. (2011). Visualization rhetoric: Framing effects in narrative visualization. IEEE Transactions on Visualization and Computer Graphics, 17(12), 2231–2240. https://doi.org/10.1109/TVCG.2011.255
- Krause, A., & Bucy, E. P. (2018). Interpreting images of fracking: How visual frames and standing attitudes shape perceptions of environmental risk and economic benefit. Environmental Communication, 12(3), 322–343. https://doi.org/10.1080/17524032.2017.1412996
- Latour, B. (1986). Visualisation and cognition: Drawing things together. In knowledge and society studies in the sociology of culture past and present (Vol. 6, p. 1/40). Elsevier Science Limited. http://www.bruno-latour.fr/sites/default/files/21-DRAWING-THINGS-TOGETHER-GB.pdf
- Latour, B. (1987). Science in action: How to follow scientists and engineers through society. Harvard University Press.
- Latour, B. (1990). Technology is society made durable. The Sociological Review. 38(suppl 1), 103–131. https://doi.org/10.1111/j.1467-954x.1990.tb03350.x
- Latour, B. (2005). Reassembling the social: An introduction to actor-network-theory. Oxford University Press.
- Lindahl, K. B., Baker, S., Rist, L., & Zachrisson, A. (2016). Theorising pathways to sustainability. International Journal of Sustainable Development & World Ecology, 23(5), 399–411. https://doi.org/10.1080/13504509.2015.1128492
- Lis, A., & Stankiewicz, P. (2017). Framing shale gas for policy-making in Poland. Journal of Environmental Policy & Planning, 19(1), 53–71. https://doi.org/10.1080/1523908X.2016.1143355
- Loredo, D. (2018, October 10). Sin fracking, México dejaría de aprovechar casi el 50 por ciento de sus reservas: CNH. El Financiero. https://elfinanciero.com.mx/economia/sin-fracking-mexico-dejaria-de-aprovechar-casi-el-50-por-ciento-de-sus-reservas-cnh
- Marres, N. (2015). Why map issues? On controversy analysis as a digital method. Science, Technology, & Human Values, 40(5), 655–686. https://doi.org/10.1177/0162243915574602
- Marres, N., & Moats, D. (2015). Mapping controversies with social media: The case for symmetry. Social Media + Society, 1(2), 205630511560417. https://doi.org/10.1177/2056305115604176
- Marres, N., & Weltevrede, E. (2013). Scraping the social?: Issues in live social research. Journal of Cultural Economy, 6(3), 313–335. https://doi.org/10.1080/17530350.2013.772070
- Mazur, A. (2016). How did the fracking controversy emerge in the period 2010-2012? Public Understanding of Science (Bristol. Public Understanding of Science, 25(2), 207–222. https://doi.org/10.1177/0963662514545311
- Metze, T. (2017). Fracking the debate: Frame shifts and boundary work in Dutch decision making on shale gas. Journal of Environmental Policy & Planning, 19(1), 35–52. https://doi.org/10.1080/1523908X.2014.941462
- Metze, T. (2018a). Visual framing for policy learning: Internet as the ‘eye of the public’. In N. F. Dotti (Ed.), Knowledge, policymaking and learning for European cities and regions (pp. 165–180). Edward Elgar Publishing.
- Metze, T. (2018b). Framing the future of fracking: Discursive lock-in or energy degrowth in the Netherlands? Journal of Cleaner Production, 197, 1737–1745. https://doi.org/10.1016/j.jclepro.2017.04.158
- Metze, T. (2020). Visualization in environmental policy and planning: A systematic review and research agenda. Journal of Environmental Policy and Planning, 22(5), 745–760. https://doi.org/10.1080/1523908X.2020.1798751
- Mol, A. P. J. (2006). Environmental governance in the information age: The emergence of informational governance. Environment and Planning C: Government and Policy, 24(4), 497–514. https://doi.org/10.1068/c0508j
- Niederer, S. (2018). Networked Images: Visual methodologies for the digital age. Inaugural Lecture, 1–58.
- Niederer, S., & Colombo, G. (2019). Visual methodologies for Networked Images: Designing visualizations for collaborative research, cross-platform analysis, and public participation. Cross-platform Analysis, and Public Participation. Diseña, 14, 40–67. https://doi.org/10.7764/disena.14.40-67
- Omena, J. J. (2019). Métodos Digitais: Teoria-prática-crítica. 23.
- Pearce, W., Niederer, S., Özkula, S. M., & Querubín, N. S. (2019). The social media life of climate change: Platforms, publics, and future imaginaries. WIRES Climate Change, 10(2), e569. https://doi.org/10.1002/wcc.569
- Pearce, W., Özkula, S. M., Greene, A. K., Teeling, L., Bansard, J. S., Omena, J. J., & Rabello, E. T. (2018). Visual cross-platform analysis: Digital methods to research social media images. Information, Communication & Society, 23(2), 161–180. https://doi.org/10.1080/1369118X.2018.1486871
- Rabello, E. T., & Gouveia, F. C. (2019). Métodos digitais nos estudos em saúde: Mapeando usos e propondo sentidos. In J. J. Omena (Ed.), Métodos digitais: Teoria-prática-crítica (1st ed., pp. 143–160). FCSH Universidade Nova de Lisboa.
- Reforma. (2018, October 6). Descarta AMLO fracking. https://www.mural.com/aplicaciones/articulo/default.aspx?id=1508846
- Rogers, R. (2013). Digital methods. MIT Press.
- Rogers, R. (2015). Digital methods for web research. In R. A. Scott & S. M. Kosslyn (Eds.), Emerging trends in the social and behavioral sciences (pp. 1–22). John Wiley & Sons, Inc. https://doi.org/10.1002/9781118900772.etrds0076
- Rogers, R. (2017). 5. Foundations of digital methods query design. In M. T. Schäfer & K. van Es (Eds.), The datafied society (pp. 75–94). Amsterdam University Press. https://doi.org/10.1515/9789048531011-008
- Rogers, R. (2019). Doing digital methods. SAGE.
- Rogers, R., & Marres, N. (2000). Landscaping climate change: A mapping technique for understanding science and technology debates on the World Wide Web. Public Understanding of Science, 9(2), 141–163. https://doi.org/10.1088/0963-6625/9/2/304
- Sarge, M. A., VanDyke, M. S., King, A. J., & White, S. R. (2015). Selective perceptions of hydraulic fracturing: The role of issue support in the evaluation of visual frames. Politics and the Life Sciences, 34(1), 57–72. https://doi.org/10.1017/pls.2015.6
- Sood, G. (2017). Clarifai: R Client for the Clarifai API. R package version 0.4.2.
- Stevens, T., Aarts, N., Termeer, C., & Dewulf, A. (2016). Social media as a new playing field for the governance of agro-food sustainability. Current Opinion in Environmental Sustainability, 18, 99–106. https://doi.org/10.1016/j.cosust.2015.11.010
- Tucker, A. R., & van Tonder, G. (2015). The karoo fracking debate: A christian contribution to the world communities of faith. Science and Engineering Ethics, 21(3), 631–653. https://doi.org/10.1007/s11948-014-9563-7
- US Energy Information Administration. (2011). Annual Energy Outlook 2011 with Projections to 2035. EIA. https://www.eia.gov/outlooks/aeo/pdf/0383(2011).pdf
- Valerio-Ureña, G., & Rogers, R. (2019). Characteristics of the digital content about energy-saving in different countries around the world. Sustainability, 11(17), 4704. https://doi.org/10.3390/su11174704
- van Beek, L., Metze, T., Kunseler, E., Huitzing, H., de Blois, F., & Wardekker, A. (2020). Environmental visualizations: Framing and reframing between science, policy and society. Environmental Science & Policy, 114(9), 497–505.
- Venturini, T. (2010). Diving in magma: How to explore controversies with actor-network theory. Public Understanding of Science, 19(3), 258–273. https://doi.org/10.1177/0963662509102694
- Venturini, T., Jacomy, M., Bounegru, L., & Gray, J. (2018). Visual network exploration for data journalists. In S. A. Eldridge & B. Franklin (Eds.), The routledge handbook of developments in digital journalism studies (1st ed., pp. 265–283). Routledge. https://doi.org/10.4324/9781315270449-21
- Venturini, T., Jacomy, M., & Pereira, D. (2014). Visual Network Analysis. Working Paper, 20.
- Williams, L., Macnaghten, P., Davies, R., & Curtis, S. (2017). Framing ‘fracking’: Exploring public perceptions of hydraulic fracturing in the United Kingdom. Public Understanding of Science, 26(1), 89–104. https://doi.org/10.1177/0963662515595159
- Williams, L., & Sovacool, B. K. (2019). The discursive politics of ‘fracking’: Frames, storylines, and the anticipatory contestation of shale gas development in the United Kingdom. Global Environmental Change, 58, 101935. https://doi.org/10.1016/j.gloenvcha.2019.101935
- Williams, L., & Sovacool, B. K. (2020). Energy democracy, dissent and discourse in the party politics of shale gas in the United Kingdom. Environmental Politics, 29(0), 1239–1263. https://doi.org/10.1080/09644016.2020.1740555