
Abstract
Objectives
The aim of this study is to assess the cost-effectiveness of fruquintinib compared to regorafenib as third-line treatment for patients with metastatic colorectal cancer (mCRC) in China.
Methods
A three-state Markov model with monthly cycle was constructed to estimate lifetime incremental cost-effectiveness ratio (ICER) of fruquintinib versus regorafenib as third-line treatment for patients with mCRC from Chinese health care perspective. Survival analysis was applied to calculate transition probabilities using the data from the clinical trials FRESCO and CONCUR, which were also the data sources accessing probabilities of adverse events. Background mortality rate and drug costs were derived from government published data. Costs for medical services were obtained from real-world data and published literatures. Utilities applied to calculate the quality-adjusted life years (QALYs) were obtained from literature review. One-way sensitivity analysis and probabilistic sensitivity analysis were adopted to verify the robustness of the results.
Results
Fruquintinib provided 0.74 QALYs at a cost of CNY 151,058 (USD 22,888), whereas regorafenib provided 0.79 QALYs at a cost of CNY 226,657 (USD 32,224). Compared to fruquintinib, the ICER of regorafenib was CNY 1,529,197/QALY (USD 231,697/QALY) from Chinese health care perspective, which was above the triple GDP per capita of China in 2019 (CNY 212,676) (USD 32,224) as the threshold to define the cost-effectiveness. One-way sensitivity analysis showed the results were generally robust. Cost-effectiveness acceptability curves derived from probabilistic sensitivity analysis demonstrated the probability that fruquintinib was more cost-effective was 100% when the threshold was the triple GDP per capita of China.
Conclusions
Compared to regorafenib, fruquintinib, which leads to forego about 0.05 QALYs and save about CNY 75,599 (USD 11,454), is a cost-effective choice as the third-line treatment for patients with mCRC in China.
Introduction
Colorectal cancer is the most commonly diagnosed malignancy of the digestive system with 1.3 million new patients diagnosed annually worldwideCitation1. According to a cancer registry study in China, the incidence of colorectal cancer was 28.20 per 100,000 in 2015, and the mortality rate was 13.61 per 10,000 in 2015, making it the 3rd most common cancer and the 5th leading cause of cancer-related death in ChinaCitation2. Approximately, half of the patients are diagnosed with metastatic colorectal cancer (mCRC) at their first hospital visit, and the liver is the most common metastatic siteCitation3. According to the guideline for colorectal cancerCitation4, multiple drug regimens are available for the treatment of mCRC, including combination therapies with fluorouracil, oxaliplatin, irinotecan, bevacizumab, cetuximab, and panitumumab. However, the 3rd-line options are limited when Chinese patients experience failure of the 2nd-line treatment. Regorafenib was included in the National Basic Insurance in 2018, and it is recommended as a 3rd-line treatment for mCRC in China.
Fruquintinib is a VEGFR inhibitor that blocks new blood vessel growth associated with tumor proliferationCitation5. In 2018, it was approved to treat Chinese patients with mCRC who had experienced failure of second-line treatment. The results of the FRESCO trial demonstrated a median overall survival (OS) benefit of 2.7 months (9.3 months vs. 6.6 months) and a median progression-free survival (PFS) benefit of 1.9 months for fruquintinib when compared with placebo (3.7 months vs. 1.8 months)Citation6.
Both fruquintinib and regorafenib have been shown to be effective 3rd-line treatments for Chinese patients with mCRC and have been the only two therapies recommended as the 3rd-line treatment regardless of RAS and BRAF gene status by the guidelineCitation4, but there is no research comparing the cost-effectiveness of fruquintinib and regorafenib. This study aimed to assess the cost-effectiveness of fruquintinib compared to regorafenib as a third-line treatment for patients with mCRC in China.
Methods
Analytic overview
The base-case intention-to-treat (ITT) population modeled in the study consisted of patients with mCRC after the failure of 2nd-line therapy in China. The perspective of the analysis was that of the health care system. This research compared the cost-effectiveness of fruquintinib vs. regorafenib as 3rd-line treatment. Due to the perspective in this research, the analysis only included direct medical costs. The effectiveness indexes in the analysis were life-years (LYs) and quality-adjusted life years (QALYs). According to the recommendation of China guideline for pharmacoeconomics evaluation, a discount rate of 5% per annum was used for both cost inputs and health outcomesCitation7. The primary economic endpoint was the lifetime incremental cost per QALY gained (incremental cost-effectiveness ratio, ICER).
Model structure
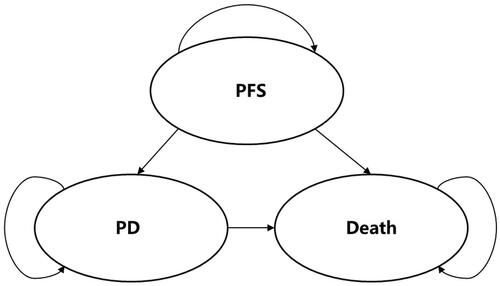
The structure of the model, which was informed by a review of the literatureCitation8–10 and expert opinion, was simple and had often been used to simulate the progression of metastatic cancers. A three-state Markov model () with monthly cycle was used to represent the progression of mCRC, including PFS, progressive disease (PD), and death. At the end of each cycle, patients either remained in their current health state or moved to a more severe state. All patients entered the model either receiving fruquintinib-based therapy or regorafenib-based therapy. After 3rd-line treatment discontinuation, 4th-line treatment or best supportive care (BSC) was modeled.
Figure 1. Markov model structure.
Model inputs
Transition probabilities
Given that there was no single RCT with all treatment arms, it was necessary to perform an indirect comparison using the data from the FRESCO trial and the CONCUR trialCitation6, Citation11. The baseline treatment for the indirect comparison was BSC taken from the FRESCO trial. The clinical effectiveness in patients in the BSC arm was also available from the CONCUR trial. This, however, was not considered appropriate for the baseline treatment because the survival curves reported by the CONCUR trial were distorted in the paper and were not suitable for recreating individual patient data. However, the hazard ratios (HRs) calculated by original data would not be affected by the distorted figures. The implicit assumption underlying the indirect comparison was that the baseline patient characteristics in the two studies were reasonably similar, which was shown to be true (Appendix Table 1).
The FRESCO trial was used to model the probabilities of remaining in the PFS state or experiencing disease progression in the fruquintinib arm. This research recreating individual patients data (IPD) from Kaplan–Meier (KM) survival curves in FRESCO by the method published by Guyot et al.Citation12. To predict the events of death and progression beyond the observation period, several parametric models were fit in different distributions, including exponential, Weibull, Gompertz, generalized gamma log-normal and log-logistic. After comparing the goodness-of-fit of different parametric models by the Akaike information criterion (AIC) and the Bayesian information criterion (BIC) (Appendix Table 2), assessing the conformities of parametric models to the original KM survival curves in the FRESCO trial and considering about proportional hazard model used for the indirect comparison, the Weibull distribution model was chosen for the base case analysis (Appendix Figure 1 and Appendix Figure 2).
We used the PFS curves to estimate the transition probability from PFS state to PFS state and the transition probability from PFS state to another states (PD and death) and used the OS curve to estimate the overall mortality. The model assumed the transition probability from PFS state to death was estimated by the background mortality obtained from Chinese government data, which based on actuarial estimates of mortality among the general population in China. According to the background mortality and the transition probability from PFS state to another states (PD and death), we calculated the transition probability from PFS state and PD. Moreover, the transition probability from PD state to PD state could calculated by overall mortality and background mortality.
We also calculated the transition probabilities in the BSC arm by a Weibull-distribution hazard function using the survival data from the FRESCO trial. The model assumed that the survival curves of BSC both in FRESCO and CONCUR would be identical if the patients in BSC arm was identical, and the HR of regorafenib versus BSC would not change even if the patients receiving BSC in CONCUR became exactly same as the patients receiving BSC in FRESCO. Hence, we adjusted the transition probabilities of the regorafenib arm using the transition probabilities of the BSC arm modeled from the FRESCO trial and the HR of regorafenib versus BSC taken from the CONCUR trial.
Health state utilities
Each health state was assigned a health utility score based on the data collected from published literature. In the model, we assumed that the utilities were only related to health states and had no connection with therapies. The utility of patients in the PFS state was set at a value of 0.78, and the utility of patients in the PD state was estimated at a value of 0.69Citation10.
Disutilities associated with adverse events (AEs), including fatigue, hand-foot syndrome, diarrhea, and hypertension, were obtained from published data in the literatureCitation13. The duration of AEs was estimated based on Expert Consultation. From the opinions of many doctors in China, regardless of patients in the arm of fruquintinib or regorafenib, hand-foot syndrome would last for 14 days and the disutility was −0.116. Hypertension would last for five days and the disutility was 0. Diarrhea would last for five days and the disutility was −0.103Citation8. The duration-adjusted disutility was subtracted from the baseline utility to calculate the overall utility of each health state.
Costs
The analysis included the costs of drugs, management of AEs and follow-up and therapeutic costs, estimated in 2020 China Yuan.
Data on drug costs for fruquintinib and regorafenib were based on open government dataCitation14,Citation15. Fruquintinib was administered in 5-mg capsules, and the recommended dose was 5 mg per day. Meanwhile, regorafenib was administered in 40-mg capsules, and the recommended dose was 160 mg. Patients received fruquintinib or regorafenib for 21 days and followed by seven days off in 28-day cycles. According to the FRESCO trial and CONCUR trial, the median daily dose received of fruquintinib was 3.5 mg per day, and the median daily dose received of regorafenib was 145.40 mg per day. It was one of the most important elements affecting the survival time and providing an average value for assessing the expected costs of fruquintinib and regorafenib in a patient cohort. Therefore, we used the median daily dose rather than the recommended dose to calculate the drug costs. Moreover, the label price of fruquintinib in China was CNY 378 (USD 57) per 5 mg and the label price of regorafenib was CNY 196 (USD 30) per 40 mg. The cost of each drug per cycle is shown in .
Table 1. Parameters used in the model.
For BSC, according to the opinions of several doctors from different provinces in China, patients needed receiving oncology assessment (CNY 26 per time) (USD 4 per time), blood routine examination (CNY 21 per time) (USD 3 per time), blood biochemistry examination (CNY 113 per time) (USD 17 per time) every cycle and CT scan (CNY 320 per time) (USD 48 per time) every two cycles.
!!The costs of follow-up and therapeutic costs were estimated based on real world data and open government data. Based on the results of the FRESCO trial, 45.19% of patients in the PD state accepted the 4th-line treatment, and the other patients only received BSC. Based on a real-world study in China, approximately 66.09% of patients receiving 4th-line therapy were treated with chemotherapy and targeted drugs, and the other patients were treated with chemotherapy aloneCitation16.
The mean cost of AEs for each arm was estimated by multiplying the probability of the occurrence of individual AEs by the cost of managing each AE. The costs of managing AEs were obtained from the published studiesCitation8.
According to the data released by the Bank of China, the exchange rate from CNY to USD used in this research was 6.60.
includes a summary of parameters used in the model.
Sensitivity analyses
Both one-way sensitivity analysis and probabilistic sensitivity analysis were conducted to verify the robustness of the results. In one-way sensitivity analysis, a Tornado diagram would be presented to determine the impacts of changes in each variable within limits on the ICER. A probabilistic sensitivity analysis would be also performed using second-order Monte Carlo simulations to derive the cost-effectiveness acceptability curves (CEACs).
Recreating IPD was conducted with R version 3.60 (R Foundation, Vienna, Austria). Survival analyses were conducted with STATA/MP version 13.0 (Stata Corp LP, College Station, TX). What is more, Markov model and cost-effectiveness analysis were conducted with Microsoft Excel 2016 (Redmond, WA).
Results
Base case analysis
shows the detailed results of the base case analysis. According to the simulation of the Markov model, the fruquintinib arm provided 0.74 QALYs and 1.02 LYs (approximately 12.24 months) at a cost of CNY 151,058 (USD 22,888), whereas the regorafenib arm provided 0.79 QALYs and 1.10 LYs (approximately 13.20 months) at a cost of CNY 226,657 (USD 34,342). Thus, the ICERs comparing the regorafenib arm to the fruquintinib arm were CNY 1,529,197 per QALY (USD 231,697 per QALY) gained and CNY 923,877 per LY (USD 139,981 per LY) gained, which was more than three times the GDP per capita of China in 2019 (CNY 212,676) (USD 32,224), which was the threshold used to define cost-effectiveness.
Table 2. Base case results.
Sensitivity analyses
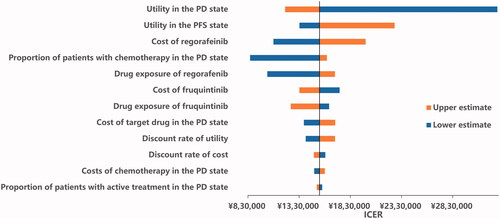
The results of the one-way sensitivity analyses are presented in the Tornado diagram (). The parameters with the greatest influence on the ICER were utility in the PD state, cost of regorafenib, utility in the PFS state, the proportion of patients receiving 4th-line treatment and drug exposure to regorafenib. Across broad variation in the ranges for each parameter, the ICER was above CNY 212,676 per QALY (USD 32,224 per QALY), which meant the results were generally robust.
Figure 2. Tornado diagram.
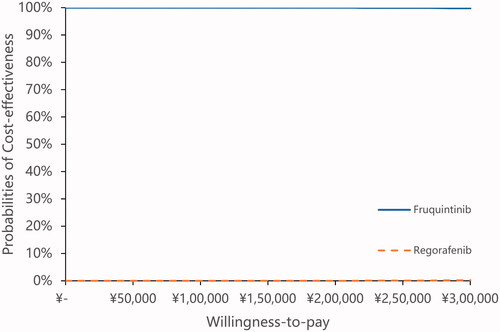
The results of the probabilistic sensitivity analyses are shown in CEACs in . These curves showed the probability that the fruquintinib arm was cost-effective across increasing willingness-to-pay (WTP) values. These results demonstrated a 100% probability that the fruquintinib arm was more cost-effective when the threshold was three times the GDP per capita of China, and a 98.90% probability that the fruquintinib arm was cost-effectiveness when the threshold was CNY 500,000 (USD 75,758), which was more than two times of WTP in China. The results of PSA showed the results of base case analysis were robust.
Figure 3. Cost-effectiveness acceptability curves.
Discussion
This is the first full published study of the cost-effectiveness of fruquintinib versus regorafenib as the 3rd-line treatment for Chinese patients with mCRC. Even though patients in China only need to pay 20–30% of medical costs as out-of-pocket expense, the total costs treated for mCRC, according to the simulated results, were excessively high. It is important to recommend a cost-effective treatment for both patients and China Healthcare Security Administration. In our base case analysis, compared to regorafenib, fruquintinib could be a more cost-effective 3rd-line option, as the ICER of regorafenib versus fruquintinib was CNY 1,529,197 per QALY (USD 231,697 per QALY) gained. According to the Markov model, the clinical outcomes in the fruquintinib arm were similar to those in the regorafenib arm. The ICER was mainly affected by the difference in costs between the two arms. The approximation of the survival benefit and the significant difference in costs led the ICER to become too high, so regorafenib was highly unlikely to be cost-effective versus fruquintinib.
If we compared the survival benefit of the fruquintinib arm in the FRESCO trial (PFS 3.7 months, OS 9.3 months) with that of the regorafenib arm in the CONCUR trial (PFS 3.2 months, OS 8.8 months) directly, patients in the fruquintinib arm compared with those in the regorafenib arm, would gain more QALYs (0.74 vs. 0.63) and LYs (1.01 vs. 0.83) at a lower cost (CNY 151,647 vs. CNY 168,482) (USD 22,977 vs. USD 25,528). However, this direct comparison method would lead to high bias, and an indirect comparison was required in this research. We used the HR of regorafenib versus BSC to adjusted for the effectiveness of regorafenib. After the adjustment, in our Markov model, patients in the fruquintinib arm could stay longer in the PFS state (5.88 months vs. 4.92 months), but patients in the regorafenib arm could survive longer (1.10 LYs vs. 1.02 LYs). In the PFS state, fruquintinib provided 0.38 QALYs and 0.49 LYs (approximately 5.88 months) at a cost of CNY 34,364 (USD 5,207), whereas regorafenib provided 0.32 QALYs and 0.41 LYs (approximately 4.92 months) at a cost of CNY 75,848 (USD 11,492). The effectiveness of fruquintinib was greater than that of regorafenib. Moreover, compared to using regorafenib, patients using fruquintinib could save CNY 41,484 (USD 6,285). Furthermore, in the PD state, fruquintinib provided 0.37 QALYs and 0.53 LYs (approximately 6.36 months) at a cost of CNY 116,694 (USD 17,681), whereas regorafenib provided 0.47 QALYs and 0.68 LYs (approximately 8.16 months) at a cost of CNY 150,808 (USD 22,850).
In addition to the CONCUR trial, there is another phase III clinical trial named CORRECT that compares the efficacy and safety of regorafenib and BSCCitation17. Although the CORRECT trial screened more patients and had a longer follow-up, the CONCUR trial was the better choice because all participants in the CONCUR trial were Asian patients whose characteristics were more similar to those of the participants in the FRESCO trial.
The limitations of our study included the lack of primary health utility data to measure patients’ quality of life in the different arms. We had to obtain health utility data from published studies. The utility data collected from other countries could produce bias when applied to Chinese patients. However, the results of the one-way sensitivity analysis showed that changing utility data within a reasonable range would not overturn the results of the base case analysis. Moreover, the CEAC also showed the robustness of the base case results.
Conclusions
Based on the current Chinese WTP (three times the current GDP per capita of China in 2019, CNY 212,676) (USD 32,224), compared to regorafenib, fruquintinib, which leads to forego about 0.05 QALYs and save about CNY 75,599 (USD 11,454), is a more cost-effective choice as a 3rd-line therapy for patients with mCRC in China.
Transparency
Declaration of financial/other relationships
CP, NW and XM worked for Eli Lilly China Drug Development and Medical Affairs Center. The authors have no other relevant affiliations or financial involvement with any organization or entity with a financial interest in or financial conflict with the subject matter or materials discussed in the manuscript apart from those disclosed. JME peer reviewers on this manuscript have received an honorarium from JME for their review work, but have no other relevant financial relationships to disclose.
Acknowledgements
No assistance in the preparation of this article was to be declared.
Previous presentations
This study was accepted for poster presentation at ISPOR 2019.
Supplemental Material
Download MS Word (41.9 KB)Additional information
Funding
References
- Ferlay J, Soerjomataram I, Ervik M. GLOBOCAN 2012 v1.0, cancer incidence and mortality worldwide: IARC CancerBase No. 11. Lyon, France: International Agency for Research on Cancer; 2013.
- Zheng R, Sun K, Zhang S, et al. Report of cancer epidemiology in China, 2015. Chin J Oncol. 2019;41:19–28.
- Cai J, Cai S, Qin X, et al. Guideline for the diagnosis and comprehensive treatment of colorectal cancer with liver metastases (2016 edition). Chin J Dig Surg. 2016;36:858–869.
- Chinese Society of Clinical Oncology (CSCO) Diagnosis and Treatment Guidelines for Colorectal Cancer Working Group. Chinese Society of Clinical Oncology (CSCO) diagnosis and treatment guidelines for colorectal cancer 2019. Beijing: People's Medical Publishing House; 2019.
- Xu RH, Li J, Bai Y, et al. Safety and efficacy of fruquintinib in patients with previously treated metastatic colorectal cancer: a phase Ib study and a randomized double-blind phase II study. J Hematol Oncol. 2017;10(1):22.
- Li J, Qin S, Xu RH, et al. Effect of fruquintinib vs placebo on overall survival in patients with previously treated metastatic colorectal cancer: the FRESCO Randomized Clinical Trial. JAMA. 2018;319(24):2486–2496.
- Liu GG. China guidelines for pharmacoeconomic evaluation. Beijing, China: China Market Press; 2020.
- Goldstein DA, Ahmad BB, Chen Q, et al. Cost-effectiveness analysis of regorafenib for metastatic colorectal cancer. J Clin Oncol. 2015;33(32):3727–3732.
- Tumeh JW, Shenoy PJ, Moore SG, et al. A Markov model assessing the effectiveness and cost-effectiveness of FOLFOX compared with FOLFIRI for the initial treatment of metastatic colorectal cancer. Am J Clin Oncol. 2009;32(1):49–55.
- Hoyle M, Peters J, Crathorne L, et al. Cost-effectiveness of cetuximab, cetuximab plus irinotecan, and panitumumab for third and further lines of treatment for KRAS wild-type patients with metastatic colorectal cancer. Value Health. 2013;16(2):288–296.
- Li J, Qin S, Xu R, et al. Regorafenib plus best supportive care versus placebo plus best supportive care in Asian patients with previously treated metastatic colorectal cancer (CONCUR): a randomised, double-blind, placebo-controlled, phase 3 trial. Lancet Oncol. 2015;16(6):619–629.
- Guyot P, Ades AE, Ouwens MJ, et al. Enhanced secondary analysis of survival data: reconstructing the data from published Kaplan–Meier survival curves. BMC Med Res Methodol. 2012;12:9.
- Lloyd A, Nafees B, Narewska J, et al. Health state utilities for metastatic breast cancer. Br J Cancer. 2006;95(6):683–690.
- Jiangsu Public Resource Trading Platform. Platform JPRT. Part of the record purchase and the direct-linked network purchases drugs in Jiangsu Province. Nanjing; 2019. Available from: http://news.pharmnet.com.cn/news/2019/05/10/521748.html
- Ministry of Human Resources and Social Security of the People's Republic of China (MoHRSS). Administration CMS. Notification about including 17 anti-cancer drugs into the national basic insurance, work-related accident insurance and maternity insurance. Beijing; 2018. Available from: http://www.gov.cn/xinwen/2018-10/10/content_5328891.htm
- Shen L, Ying X, Li Q, et al. PCN67 – treatment patterns and economic burden of Chinese metastatic colorectal cancer patients: a retrospective study of electronic medical records from urban China. Value Health. 2018; 21:S23.
- Grothey A, Van Cutsem E, Sobrero A, et al. Regorafenib monotherapy for previously treated metastatic colorectal cancer (CORRECT): an international, multicentre, randomised, placebo-controlled, phase 3 trial. Lancet. 2013;381(9863):303–312.