
Abstract
Objective
Women in midlife face a range of biopsychosocial stressors that increase the risk of depression, with potential negative consequences in older adulthood. Lower self-compassion is known to predict subsequent depressive symptoms, but little is known about whether depressive symptoms predict subsequent levels of self-compassion. This study examined the longitudinal and reciprocal relationships between self-compassion and depressive symptoms over a 5-year period in midlife.
Method
This longitudinal study used data from 272 women aged 40–60 years at baseline. Cross-lagged panel analysis was used to investigate reciprocal relationships between depressive symptoms and self-compassion at baseline and 5-year follow-up.
Results
After controlling for autoregressive effects, self-compassion at baseline explained 4% of unique variance in depressive symptoms 5 years later. Baseline depressive symptoms also predicted subsequent levels of self-compassion, with 2% of unique variance explained.
Conclusion
This is the first study to report a bidirectional longitudinal relationship between self-compassion and depressive symptoms. Midlife women may experience a negative cycle whereby low self-compassion and depressive symptoms reinforce each other through midlife and into older adulthood. Clinical trials examining self-compassion interventions in midlife are indicated.
摘要
目的: 中年妇女面临一系列生物心理社会压力, 增加抑郁的风险, 并在老年期导致潜在的负面后果。人们知道较低的自我同情会预示随后的抑郁症状, 但很少知道抑郁症状是否预示随后的自我同情水平。这项研究在5年的时间里调查了自我同情和中年抑郁症状之间的纵向和相互关系。
方法:这项纵向研究使用了272名基线年龄为40-60岁的妇女的数据。在基线和5年随访时, 使用交叉滞后的面板模型分析来调查抑郁症状和自我同情之间的相互关系。
结果:在控制了自回归效应后, 基线时的自我同情可以解释5年后抑郁症状唯一变异的4%。基线抑郁症状也预测了随后的自我同情水平, 2%的独特差异得到了解释。
结论:这是第一个报告自我同情和抑郁症状之间的双向纵向关系的研究。中年妇女可能经历一个消极的循环, 在中年和老年期间, 低自我同情和抑郁症状相互强化。临床试验检查自我同情干预中年指出。
Introduction
Epidemiological research has found that, on average, women are nearly twice as likely to experience a depressive disorder compared with men, with this trend starting in early adolescence and persisting into midlife [Citation1]. However, relative to depression in younger women, depression in midlife has received much less attention in the literature [Citation2], an example of the overall neglect of the midlife period in lifespan research [Citation3]. Between 15% and 26% of women experience clinically significant levels of depressive symptoms in midlife [Citation4–6] and research indicates that across the lifespan, women aged 45–49 years are most likely to be hospitalized for depression [Citation7]. Longitudinal studies have identified stable low, stable high, increasing and decreasing depression trajectories throughout the midlife period [Citation8,Citation9]. This highlights the importance of monitoring depressive symptoms over multiple time points, as for many midlife women levels of depression do not remain stable. A number of factors contribute to the variance in midlife depression trajectories, including the menopausal transition, changes in sleep and sexual functioning, general health issues, psychosocial stressors, changes in professional and caregiving roles including distress related to the so-called ‘empty-nest syndrome’ [Citation10–12] and, moreover, the interplay between the aforementioned biopsychosocial factors [Citation13].
As women in midlife are often at the peak of assuming responsibility for others, poor mental health in midlife can have serious consequences for both children and older parents who rely on this middle generation for financial, caregiving and emotional support. Experiences in midlife also pave the way for well-being and functioning in older adulthood. Depressive symptom severity in midlife is a strong predictor of poor depression trajectories in older adulthood [Citation14], which in turn are associated with increased cortisol levels and higher mortality [Citation15]. Given the significant impact of depressive symptoms on cognitive and physical functioning in the aging population [Citation16], consideration of modifiable psychological resilience factors in midlife is warranted. One such factor is self-compassion.
Self-compassion can be understood as a healthy self-attitude, which involves responding to oneself with care and kindness in times of suffering [Citation17]. Neff describes six facets of self-compassion, including the presence of self-kindness, common humanity and mindfulness (together known as positive self-compassion) and the absence of self-judgment, isolation and over-identification (together known as negative self-compassion) [Citation17]. Self-kindness, as opposed to self-judgment, involves approaching one’s shortcomings, painful emotions and difficult experiences with care and understanding. Providing kindness to oneself in times of suffering should be consistent with how one would extend warmth, comfort and understanding to a loved one faced with similar suffering. Common humanity, as opposed to a sense of isolation, involves recognizing one’s experience of suffering as consistent with the shared human condition. This connects an individual’s experience of the imperfect self to the imperfect experience of others, fostering an inclusive and connected view of self and shifting away from an isolated view of self. Mindfulness involves the ability to be aware of and observe painful thoughts and emotions. This is in contrast to ignoring or over-identifying with such thoughts and emotions, which can subsequently magnify the pain. Rather, mindfulness involves responding to the self with acceptance of what is, which is crucial to being able to offer compassion toward oneself [Citation17]. Self-compassion appears to play an important role in navigating difficult life transitions, as individuals who respond to such transitions with self-compassion report lower levels of depression [Citation18]. A wealth of cross-sectional research has confirmed a negative association between self-compassion and depressive symptoms in both clinical and general population samples [Citation19], and research amongst midlife women suggests that higher self-compassion is associated with lower depressive symptoms [Citation20–22], but few studies have examined this relationship longitudinally.
One study with a short 5-month follow-up period found a longitudinal association between self-compassion and depressive symptoms [Citation23], whereby higher levels of self-compassion protected against subsequent depressive symptoms. Carvalho et al. also reported that baseline self-compassion scores predicted subsequent depressive symptoms 6 months and 12 months later, in a sample of women with musculoskeletal chronic pain [Citation24]. These studies, however, are limited in that they did not account for the possibility of a bidirectional relationship. To our knowledge, only one study has investigated whether self-compassion is a cause or consequence of depressive symptoms. Using multi-wave longitudinal data, Krieger et al. analyzed a clinically depressed sample of men and women aged 19–66 years over a 1-year period [Citation25]. The authors found that while self-compassion significantly predicted subsequent depressive symptoms, depressive symptoms did not predict subsequent levels of self-compassion. These preliminary findings warrant further examination to determine whether these results remain stable over a greater length of time.
While the cross-sectional relationship between self-compassion and depressive symptoms has been established in midlife women [Citation20–22], this study will use a longitudinal approach to understand the way in which self-compassion and depressive symptoms interact with each other over a 5-year time frame. It is hypothesized that when controlling for baseline depressive symptoms, self-compassion at baseline (T1) will predict depressive symptoms 5 years later (T2). Given the lack of research investigating the reverse time-lagged relationship, the analysis of the relationship between depressive symptoms at T1 and self-compassion at T2 is exploratory in nature.
Materials and methods
Study design
This observational cohort study utilized longitudinal methods to examine relationships between self-compassion and depressive symptoms, in data collected across two time points: 2013 and 2018.
Participants
The participants in this study were selected from a large community sample of men and women aged between 18 and 101 years (N = 7615) [Citation26], who had been randomly recruited from the electoral roll. Midlife women who had expressed interest in participating in additional mental health and well-being research were recruited for the present study. Women living in rural Victoria and New South Wales, Australia aged between 40 and 60 years participated in the first wave of data collection in 2013 (n = 517) [Citation20–22]. The same group was invited to participate in the second wave of data collection 5 years later. Two hundred and seventy-two participants took part in the second wave of data collection, resulting in a response rate of 52.61%.
Materials
Demographics
Demographic information regarding age, menopausal status, body mass index (BMI), education, ethnicity, employment status, relationship status and living situation was collected.
Depressive symptoms
The Center for Epidemiologic Studies Depression Scale (CES-D) is a 20-item self-report measure scored on a 4-point scale, ranging from 0 (rarely or none of the time) to 3 (most or all of the time) [Citation27]. Items are added to yield a total score (0–60). Higher scores indicate greater depressive symptomatology, where a cut-off score ≥ 16 indicates risk of clinical depression. Cronbach’s α was 0.92 at both T1 and T2.
Self-compassion
The Self-Compassion Scale (SCS) is a 26-item measure scored on a 5-point scale ranging from 1 (almost never) to 5 (almost always) [Citation17]. The SCS uses three subscales to measure positive facets of self-compassion (self-kindness, common humanity, mindfulness) and three subscales to measure negative facets of self-compassion (self-judgment, isolation, over-identification). Higher scores on positive self-compassion and lower scores on negative self-compassion indicate higher levels of self-compassion, and items measuring negative self-compassion are reverse scored to calculate a total self-compassion score. In this study, the self-compassion scale had high internal consistency, with Cronbach’s α ranging from 0.90 to 0.94 across both T1 and T2.
Procedure
In 2013, participants received an information statement, questionnaire package, consent form and reply-paid envelope via post. For participants who did not complete the questionnaire within 2 months, a second copy of the questionnaire package was sent out. In 2018, participants (n = 517) were mailed an invitation to participate in the second wave of data collection, along with the plain language statement, questionnaire package, reply-paid envelope and summary of findings from wave one. A link to complete the questionnaire online was also provided as an alternative option. Participant responses were assigned to a unique ID code to facilitate longitudinal analyses across two waves of data collection.
Statistical analysis
Descriptive statistics were reported for demographic variables, and bivariate correlations between demographic variables and study variables were examined. To track longitudinal change and analyze the directional nature of the relationship between self-compassion and depressive symptoms, structural equation modeling analyses were carried out using Mplus. Cross-lagged panel analyses are recommended for exploratory research [Citation28], where limited research exists regarding the directional nature of the relationship between variables. In this study, a cross-lagged panel analysis examined the interaction between self-compassion and depressive symptoms, while controlling for stabilities over a 5-year period. The effect of self-compassion at T1 on depressive symptoms at T2 was examined, as well as the effect of depressive symptoms at T1 on self-compassion at T2, while controlling for age, relationship status, BMI, autoregressive effects and the opposite cross-lagged effect. While cross-lagged panel analysis rests on the assumption of stability, it should be noted that there may be between-subject differences in stability of depressive symptoms over time. Maximum likelihood was used to handle missing data in the cross-lagged panel analyses.
Results
Descriptive results
Demographic characteristics are presented in . At T2, the mean age of the sample was 57.47 years (standard deviation [SD] = 5.44) and most women (74.6%) were postmenopausal. The sample consisted mostly of women from an Australian background (92.6%) who were married (77.6%), living with a spouse or partner (57%) and working part-time (43%) or full-time (28.3%). CES-D scores were significantly higher in non-responders (mean = 14.38, SD = 12.11), compared with those who remained in the study (mean = 10.54, SD = 9.52), t(509) = 4, p < 0.001. No significant differences in age, BMI, relationship status or self-compassion scores were found between the study group and non-responders.
Table 1. Demographic characteristics.
Bivariate analyses
Bivariate associations between self-compassion scales, depressive symptoms and demographic variables were examined with Pearson’s r correlation and one-way analysis of variance. Younger age was associated with lower levels of self-compassion (r = 0.17, p < 0.01) and higher depressive symptoms (r = −0.13, p < 0.05). Higher BMI (r = 0.16, p < 0.05) and not being in a relationship (r = 0.15, p < 0.05) were also associated with higher depressive symptoms. Thus, age, relationship status and BMI were included as control variables in analyses. Means, SDs and intercorrelations between variables across both time points are presented in . Demographic variables such as education, ethnicity, menopausal status, employment and living situation were excluded from the model as correlations with study variables were non-significant.
Table 2. Intercorrelations, means and standard deviations for demographic variables, depressive symptoms and self-compassion.
Missing data
A missing values analysis indicated that eight participants had missing data on the self-compassion scale (T2), seven participants had missing data for age and one participant had missing data for relationship status. Little’s missing completely at random (MCAR) test indicated that the missing cases specified were missing completely at random (p = 0.26) [Citation29]. Due to the relatively large sample size (N = 272), the listwise deletion method was applied.
The cross-lagged panel model: longitudinal relationships between self-compassion and depressive symptoms
The cross-lagged panel model () explained 38% of the variance in depressive symptoms at T2 and 51% of the variance in self-compassion at T2. presents the autoregressive and cross-lagged effects in this model. Self-compassion (β = 0.59, p < 0.001) was more stable across the 5-year period than depressive symptoms (β = 0.37, p < 0.001). Synchronous correlations between self-compassion and depressive symptoms at T1 (r = −0.62) and T2 (r = −0.45) are shown in . Relationship status was the only significant demographic predictor of depressive symptoms at T2 (β = 0.11, p = 0.03), and no demographic variables significantly predicted self-compassion. Both cross-lagged paths were significant. Self-compassion at T1 negatively predicted depressive symptoms at T2 (β = −0.28, p < 0.001) and depressive symptoms at T1 negatively predicted self-compassion at T2 (β = −0.16, p = 0.005), while controlling for autoregressive effects and the opposite cross-lagged effect. Self-compassion at T1 explained 20% of unique variance in self-compassion at T2, while depressive symptoms at T1 explained 9% of unique variance in depressive symptoms at T2. Self-compassion at T1 explained 4% of the unique variance in depressive symptoms at T2, over and above the contribution of depressive symptoms at T1. On the other hand, depressive symptoms at T1 explained 2% of the unique variance in self-compassion at T2, over and above the contribution of self-compassion at T1.
Figure 1. Cross-lagged model of self-compassion and depressive symptoms. Coefficients are standardized β values. * p < 0.05. ** p < 0.01. *** p < 0.001. T1, baseline; T2, after 5 years.
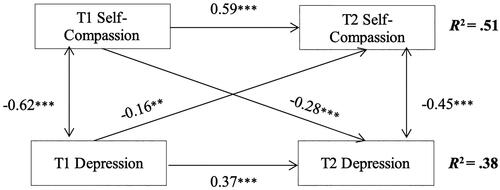
Table 3. Autoregressive and cross-lagged effects for self-compassion and depressive symptoms.
Discussion
This study aimed to examine the longitudinal relationships between self-compassion and depressive symptoms over a 5-year time frame. A cross-lagged panel analysis revealed a significant bidirectional relationship, whereby the effect of self-compassion on subsequent depressive symptoms was stronger than the effect of depressive symptoms on subsequent levels of self-compassion. These findings offer a new lens through which to interpret and understand the nature of the cross-sectional relationship between self-compassion and depressive symptoms in midlife women [Citation20–22], in that the association between the variables is not only determined by the protective effect of self-compassion on depressive symptoms, but also by the significant effect of depressive symptoms on self-compassion.
The current study strengthens the accumulating longitudinal evidence that self-compassion scores predict subsequent levels of depression, expanding on the 5-month, 6-month and 12-month investigation periods reported by Raes [Citation23], Carvalho et al. [Citation24] and Krieger et al. [Citation25], respectively. While this research suggests that lower levels of self-compassion predict higher levels of depression, it also suggests that self-compassion can be considered a resilience factor for midlife women, in that the more self-compassionate a woman is, the more she is protected against depressive symptoms 5 years later.
This is the first longitudinal study to demonstrate that depressive symptoms at baseline predict future levels of self-compassion. Individuals experiencing higher levels of depressive symptoms may have negative core beliefs and may not view themselves as deserving of self-compassion, and therefore may have difficulty responding to themselves in a compassionate way. In the only other study to examine the cross-lagged relationship between self-compassion and depressive symptoms, Krieger et al. found that depressive symptoms did not predict subsequent self-compassion [Citation25]. Krieger et al.’s smaller sample comprised both men and women who had received a diagnosis of depression and had completed psychotherapy treatment. Therefore, these participants may have already learnt skills for responding to their suffering in a healthy and compassionate way.
Results of this study provide evidence for a bidirectional, reinforcing relationship between self-compassion and risk of depressive symptoms that can be either protective or harmful. In terms of a cycle of risk, low levels of self-compassion and increased depressive symptoms may continue to perpetuate each other over time, thus increasing the risk of depression in later life. However, the cycle can potentially be used to advantage. As self-compassion is a learnable skill [Citation30,Citation31], it is plausible that training in self-compassion may reduce future risk of depression, subsequently bolstering future self-compassion across late life – a hypothesis to be tested in future experimental and longitudinal research.
While this study offers new insights into the nature of the longitudinal relationship between self-compassion and depressive symptoms, it should be noted that we found evidence of responder bias, in that women who dropped out of the study from T1 to T2 had higher mean levels of baseline depression, which may limit generalizability of findings to exclude those with the most severe depressive symptoms. As this is one of only two studies investigating the reciprocal relationship between self-compassion and depressive symptoms, replication in independent samples is necessary to clarify the differing findings. Although cross-lagged panel models are known to produce stable results and are recommended for research questions focused on exploring between subject differences in longitudinal change, cross-lagged panel models have known limitations [Citation32]. Therefore, alternative methods for testing prospective effects, such as random intercepts cross-lagged panel models, may be considered for future research examining the longitudinal relationship between self-compassion and depressive symptoms.
Conclusion
A considerable number of women experience clinically significant levels of depressive symptoms in the midlife period, with long-term consequences for health and well-being in later life. This study is the first to demonstrate a longitudinal reciprocal relationship between depressive symptoms and self-compassion. Further research into self-compassion is required to understand how this modifiable resilience factor can be harnessed to both prevent and treat depression in midlife women and minimize the impact of depressive symptoms through midlife and into older adulthood.
Potential conflict of interest
The authors report no conflict of interest.
Source of funding
None.
Acknowledgements
The authors would like to acknowledge the time and effort that participants took to contribute to this study.
Data availability statement
This dataset is not publicly available as the data are currently being used by the authors for ongoing projects.
References
- Salk RH, Hyde JS, Abramson LY. Gender differences in depression in representative national samples: meta-analyses of diagnoses and symptoms. Psychol Bull. 2017;143(8):783–822. doi: 10.1037/bul0000102.
- Rich JL, Byrne JM, Curryer C, et al. Prevalence and correlates of depression among Australian women: a systematic literature review, January 1999–January 2010. BMC Res. 2013;6(1):424.
- Lachman ME. Mind the gap in the Middle: a call to study midlife. Res Hum Dev. 2015;12(3–4):327–334. doi: 10.1080/15427609.2015.1068048.
- Bromberger JT, Matthews KA, Schott LL, et al. Depressive symptoms during the menopausal transition: the Study of Women’s Health across the Nation (SWAN). J Affect Disord. 2007;103(1–3):267–272. doi: 10.1016/j.jad.2007.01.034.
- Jackson KL, Janssen I, Appelhans BM, et al. Body image satisfaction and depression in midlife women: the study of women’s health across the nation (SWAN). Arch Womens Ment Health. 2014;17(3):177–187. doi: 10.1007/s00737-014-0416-9.
- Li R, Ma M, Xiao X, et al. Perimenopausal syndrome and mood disorders in perimenopause: prevalence, severity, relationships, and risk factors. Medicine. 2016;95(32):e4466. doi: 10.1097/MD.0000000000004466.
- Draper B, Low L. Patterns of hospitalisation for depressive and anxiety disorders across the lifespan in Australia. J Affect Disord. 2009;113(1–2):195–200. doi: 10.1016/j.jad.2008.05.004.
- Bromberger JT, Schott LL, Avis NW, et al. Psychosocial and health-related risk factors for depressive symptom trajectories among midlife women over 15 years: Study of Women’s Health across the Nation (SWAN). Psychol Med. 2019;49(2):250–259. doi: 10.1017/S0033291718000703.
- Hickey M, Schoenaker D, Joffe H, et al. Depressive symptoms across the menopause transition: findings from a large population-based cohort study. Menopause. 2016;23(12):1287–1293. doi: 10.1097/GME.0000000000000712.
- Sassarini DJ. Depression in midlife women. Maturitas. 2016;94:149–154. doi: 10.1016/j.maturitas.2016.09.004.
- Soares CN. Depression and menopause: an update on current knowledge and clinical management for this critical window. Med Clin North Am. 2019;103(4):651–667. doi: 10.1016/j.mcna.2019.03.001.
- Stotland NL. The contexts of midlife in women. In: Stewart D, editor. Menopause: a mental health practitioner’s guide. Washington DC: American Psychiatric Publishing; 2005. p. 1–14.
- Judd F, Hickey M, Bryant C. Depression and midlife: are we overpathologising the menopause? J Affect Disord. 2012;136(3):199–211. doi: 10.1016/j.jad.2010.12.010.
- Xiang X, Cheng J. Trajectories of major depression in Middle-aged and older adults: a population-based study. Int J Geriatr Psychiatry. 2019;34(10):1506–1514. doi: 10.1002/gps.5161.
- Musliner KL, Munk-Olsen T, Eaton WW, et al. Heterogeneity in long-term trajectories of depressive symptoms: patterns, predictors and outcomes. J Affect Disord. 2016;192:199–211. doi: 10.1016/j.jad.2015.12.030.
- Fiske A, Wetherell JL, Gatz M. Depression in older adults. Annu Rev Clin Psychol. 2009;5(1):363–389. doi: 10.1146/annurev.clinpsy.032408.153621.
- Neff KD. The development and validation of a scale to measure self-compassion. Self Identity. 2003;2(3):223–250. doi: 10.1080/15298860309027.
- Terry ML, Leary MR, Mehta S. Self-compassion as a buffer against homesickness, depression, and dissatisfaction in the transition to college. Self Identity. 2012;12(3):1–13.
- MacBeth A, Gumley A. Exploring compassion: a meta-analysis of the association between self-compassion and psychopathology. Clin Psychol Rev. 2012;32(6):545–552. doi: 10.1016/j.cpr.2012.06.003.
- Brown L, Bryant C, Brown VM, et al. Self-compassion weakens the association between hot flushes and night sweats and daily life functioning and depression. Maturitas. 2014;78(4):298–303. doi: 10.1016/j.maturitas.2014.05.012.
- Brown L, Bryant C, Brown V, et al. Investigating how menopausal factors and self-compassion shape well-being: an exploratory path analysis. Maturitas. 2015;81(2):293–299. doi: 10.1016/j.maturitas.2015.03.001.
- Brown L, Bryant C, Brown V, et al. Self-compassion, attitudes to ageing and indicators of health and well-being among midlife women. Aging Ment Health. 2016;20(10):1035–1043. doi: 10.1080/13607863.2015.1060946.
- Raes F. The effect of self-compassion on the development of depression symptoms in a non-clinical sample. Mindfulness. 2011;2(1):33–36. doi: 10.1007/s12671-011-0040-y.
- Carvalho SA, Trindade IA, Gillanders D, et al. Self-compassion and depressive symptoms in chronic pain (CP): a 1-year longitudinal study. Mindfulness. 2020;11(3):709–719. doi: 10.1007/s12671-019-01292-7.
- Krieger T, Berger T, Holtforth MG. The relationship of self-compassion and depression: cross-lagged panel analyses in depressed patients after outpatient therapy. J Affect Disord. 2016;202:39–45. doi: 10.1016/j.jad.2016.05.032.
- Murray G, Judd F, Jackson H, et al. Rurality and mental health: the role of accessibility. Aust N Z J Psychiatry. 2004;38(8):629–634. doi: 10.1080/j.1440-1614.2004.01426.x.
- Radloff LS. The CES-D scale: a self-report depression scale for research in the general population. Appl Psychol Meas. 1977;1(3):385–401. doi: 10.1177/014662167700100306.
- Kearney MW. Cross-lagged panel analysis. In: Allen MR, editor. The SAGE encyclopedia of communication research methods. Thousand Oaks (CA): SAGE Publications; 2017. p. 312–314.
- Little RJA. A test of missing completely at random for multivariate data with missing values. J. Am. Stat. Assoc. 1988;83(404):1198–1202. doi: 10.1080/01621459.1988.10478722.
- Neff KD, Germer CK. A pilot study and randomized controlled trial of the mindful self-compassion program. J Clin Psychol. 2013;69(1):28–44. doi: 10.1002/jclp.21923.
- Smeets E, Neff K, Alberts H, et al. Meeting suffering with kindness: effects of a brief self-compassion intervention for female college students. J. Clin. Psychol. 2014;70(9):794–807. doi: 10.1002/jclp.22076.
- Orth U, Clark DA, Donnellan MB, et al. Testing prospective effects in longitudinal research: comparing seven competing cross-lagged models. J Pers Soc Psychol. 2021;120(4):1013–1034. doi: 10.1037/pspp0000358.