
ABSTRACT
This article examines the extent to which parental socioeconomic status (SES) affects the likelihood of a child becoming a top-performing student, offering an international perspective by reporting this relationship in 31 developed countries. The impact of 3 important educational system characteristics (differentiation in terms of early tracking, standardisation, and private schooling) on the relationship between parental SES and top performance was determined. We employed multilevel logistic regression models on data from the Programme for International Student Assessment (PISA) 2015 (N = 216,980) to reveal that children with low parental SES have a lower probability of becoming a top-performing student than those with high parental SES, although this association differs between countries. The negative relationship between a disadvantaged parental background and top performance was not affected by the educational system characteristics under investigation.
Introduction
Ongoing globalisation and worldwide technological progress means that countries all over the world are competing to increase their numbers of highly skilled workers (Organisation for Economic Co-operation and Development [OECD], Citation2009a; Rutkowski, Rutkowski, & Plucker, Citation2012). High-ability workers possess the competence to create innovative ideas and knowledge, and therefore are required for economic growth and technological development (Gelade, Citation2008; Olszewski-Kubilius & Clarenbach, Citation2012). The proportion of students who achieve the highest levels of education could be an important determinant of the number of highly skilled workers in the future, as these students have the potential to acquire complex abilities. As high-level skills can partially determine economic progress, research into excellence is considered highly relevant. Top-performing students can be characterised in multiple ways; according to the OECD (Citation2009a), top performers possess the ability to “identify, explain and apply scientific knowledge and knowledge about science in a variety of complex life situations” (p. 80).
One common area of study in the field of educational research is the unequal educational opportunities for specific groups of students, particularly those with low parental socioeconomic status (SES) (Tomlinson & Jarvis, Citation2014). Research into the high achievement of disadvantaged students is important for two reasons. First, achievement gaps between students with low and high parental SES can lead to income disparity in the future (Montt, Citation2011), which can become a vicious cycle, which means that it is laborious and demotivating for students from disadvantaged families to climb the social ladder. Second, Hardesty, McWilliams, and Plucker (Citation2014) argue that students should have equal opportunities to fully develop their talents, regardless of their background; however, Wai and Worrell (Citation2016) state that the needs of students with low parental SES are often neglected, resulting in underdevelopment. Similar to the findings regarding SES and average educational performance (Sirin, Citation2005), scholars generally agree on the existence of so-called excellence gaps, that is, the presence of achievement differences at the highest educational levels (Rutkowski et al., Citation2012). Despite this issue only recently receiving attention, previous studies have shown that the link between student backgrounds and school performance varies between countries (OECD, Citation2009a); while the majority of top-performing students tend to come from advantaged backgrounds in all countries, the percentage of top performers from disadvantaged backgrounds differs internationally. Cross-national studies on excellence gaps are rather limited; therefore, this article focuses not only on the relationship between parental SES and the probability of a child becoming a top-performing student, but also on international differences in this relationship.
Countries differ in the available pathways in which students can form their educational career and eventually their position within the labour market (Kerckhoff, Citation2001); however, these differences in educational systems seem to create unequal opportunities for certain groups (Montt, Citation2011). The institutional characteristics of educational systems that are often mentioned in this respect are differentiation and standardisation (Pfeffer, Citation2008; Van de Werfhorst & Mijs, Citation2010). Differentiation refers to curricular tracking, the practice of allocating students to school programmes or classes that are homogeneous in terms of cognitive ability, while standardisation consists of the standardisation of output (central examinations) and input (the school’s control over the input of education). The latter aspect of standardisation means that boundaries are set to dictate how schools and teachers should reach their educational goals; for example, by prescribing exactly which courses schools should offer. Multiple studies have investigated the reasons for the international variation in the inequality of general achievement while emphasising these educational system characteristics (e.g., Bol, Witschge, Van de Werfhorst, & Dronkers, Citation2014; Woessmann, Citation2016); however, the extent to which these institutional characteristics might influence the share of top-performing students from (dis)advantaged backgrounds is unknown (Van Damme & Bellens, Citation2017).
Another frequently examined feature of the educational system is private schooling (Hanushek & Woessmann, Citation2011). In general, it has been shown that students from private schools perform better than students from public schools (Dronkers & Robert, Citation2008). Not all students benefit from the (local) availability of private schools; therefore, in this study we also examine the extent to which the relationship between parental SES and the likelihood that a child is a top-performing student is affected by the proportion of private schools in each country.
This article aims to contribute to the existing knowledge on excellence by assessing the relationship between parental SES and the probability that a child is a top-performing student in 31 countries. We build upon previous research by using recent data to determine the extent to which the important characteristics of the educational system, which are often studied in research on average achievement, influence the relationship between parental SES and excellence. Using an authoritative, cross-national dataset (Programme for International Student Assessment [PISA] 2015), the following three research questions are answered:
To what extent does low parental SES negatively affect the probability of a child being a top-performing student?
To what extent does the negative effect of low parental SES on the probability of a child being a top-performing student vary between countries?
To what extent is the negative effect of low parental SES on the probability of a child being a top-performing student moderated by the institutional characteristics of the educational system between countries?
Theoretical framework
Among the top-performing students, those with low parental SES are underrepresented (Plucker, Hardesty, & Burroughs, Citation2013). Parental SES and educational excellence are understandably connected, as disadvantaged parents have more limited resources than advantaged parents (Roscigno & Ainsworth-Darnell, Citation1999). Students with more highly educated and wealthy parents are provided with “better material, educational and cultural resources” (OECD, Citation2009a, p. 84). These higher amounts of parental capital provide these students with more and better opportunities, both inside and outside the home. At home, high-SES parents are able to help and support their children to a greater extent (e.g., Domina, Citation2005; Tam & Chan, Citation2009); for example, providing more help with their homework. Outside the home, these parents are more likely to be able to support their children with, for instance, the provision of extra tuition. Subotnik, Olszewski-Kubilius, and Worrell (Citation2011) also mention that high-SES parents are more conscious of the needs of their children with high levels of ability and are more able to provide a suitable education. Hardesty et al. (Citation2014) added that disparities in top performance may also result from differences in parental stimulation in the student’s education and use of digital technologies, which are increasingly being used as an educational tool. In less well-resourced families, the availability of such tools is often lacking (Livingstone & Helsper, Citation2007), which means children from these families are less familiar with new technologies.
Altogether, students with low parental SES are provided with less resources to fully develop their abilities, and for this reason, our first hypothesis reads as follows: A child with low parental SES has a lower probability of being a top-performing student (Hypothesis 1).
As mentioned above, previous research has shown that the distribution of student backgrounds among top performers varies between countries (OECD, Citation2009a). In general, Asian countries tend to have more top-performing students from low-SES families than the OECD average. On the other hand, at least 80% of top-performing students from North European countries come from advantaged families. Although the data used in this OECD report stem from 10 years ago and are therefore outdated to some extent, it is plausible the cross-national variation in excellence gaps concerning parental background continues to exist. Moreover, Rutkowski et al. (Citation2012) more recently reported that the excellence gap between native students and students with an immigrant background varies between countries. Considering this prior research into cross-country variation in excellence gaps, the following hypothesis is formulated: The negative effect of low parental SES on the probability of a child being a top-performing student varies between countries (Hypothesis 2).
Any cross-national variation in the excellence gap between different levels of parental SES will mean the impact of characteristics of the educational system on this relationship needs to be explored. One of the most influential features of the educational system in terms of student performance is educational tracking (Woessmann, Citation2016), which refers to the way in which students are grouped into homogeneous tracks, often based on ability. In systems where students are selected for a certain path or track at an early age, the influence of parental SES on educational performance is known to be stronger (Horn, Citation2009; Marks, Citation2005). Tracking can be operationalised in several ways: Students can be assigned to separate schools with different educational programmes, attend the same school with different curricula per level, or be positioned in classes with different levels. Countries vary in both the manner of differentiation and the age at which children are separated.
With regard to socioeconomic background, tracking does not seem to increase the performance levels of students, although it increases the inequality in achievement (Woessmann, Citation2016). As discussed above, it is assumed that low parental SES negatively influences the probability of a child being a top performer and that this varies across countries. Differences in tracking systems between countries might affect this negative relationship, as Hanushek and Woessmann (Citation2011) argue that differentiation can influence educational performance in several ways. In tracked systems, students with the same abilities are brought together, which potentially leads to a better learning environment for them. It is easier for more homogeneous groups to concentrate on certain learning goals and educational progress. On the other hand, disadvantaged groups, that is, children from low-SES families, are separated from children with more parental resources at an early age (Bol & Van de Werfhorst, Citation2013). In educational systems where tracking occurs early in the school career, the early lack of resources means that children with low parental SES are less able to compensate for their background. These students are put into lower educational levels, despite having the potential ability to be able to catch up with the others in less tracked educational systems at a later stage. For that reason, the third hypothesis is as follows: The earlier that educational tracking occurs in a country, the stronger is the negative effect of low parental SES on the probability of a child being a top-performing student (Hypothesis 3)
In addition to tracking, another frequently mentioned institutional characteristic is educational standardisation (Bol et al., Citation2014), which can be conceptualised in various ways (Van de Werfhorst & Mijs, Citation2010). Educational programmes, for example, can be made uniform by the national government to apply the same standard across schools. The government would then decide on the curriculum, and minimum levels and grades that students should obtain to be able to move up to the next class or grade. According to Woessmann (Citation2016), external centralised exams positively affect student performance; however, Pfeffer (Citation2008) found neither an association between standardisation and educational inequality, nor between standardisation and intergenerational educational mobility.
Despite mixed results from earlier research, educational standardisation can make the process of selecting students more transparent and objective. As was argued by Bol et al. (Citation2014), students with low parental SES would particularly benefit from standardisation as they rely more heavily upon the educational system for learning. Since there are standardised criteria at the national level, all students who achieve a certain level follow approximately the same curriculum. In addition, research has shown that nationwide programmes, central exams, and uniform school resources decrease the impact of parental background on student achievement (Van de Werfhorst & Mijs, Citation2010). The uniformity of the educational programme makes the determination of student ability more objective and their subsequently chosen educational level will likely be a better fit, which is especially beneficial for students from a disadvantaged background. These assumptions lead to the fourth hypothesis: The higher the degree of educational standardisation in a country, the weaker the negative effect of low parental SES on the probability of a child being a top-performing student (Hypothesis 4).
In general, students in private schools perform better than students in public schools (Dronkers & Robert, Citation2008). Even though various theories emphasise the influence of institutional characteristics on educational performance, these theories remain ambiguous about the effects of private versus public schools (Fuchs & Woessmann, Citation2007). It is argued that private schools have higher quality education, but it is also important to bear in mind the sorting processes of public and private schools. Enrolment in private schools is focused not only on the ability of potential students, but also on parental resources such as income and educational attainment (Brunello & Checchi, Citation2007). Since it is likely that private schools ask for (high) fees from parents, students with high parental SES have a higher probability of attending a private school than students with low parental SES. The composition of a private school in terms of student socioeconomic backgrounds is therefore markedly different from the composition of a public school. Even if this compositional effect is statistically controlled for, the performance levels of private schools were found to remain higher than those of public schools (Dronkers & Robert, Citation2008); however, in a repeated study by Dronkers and Avram (Citation2010), this finding was not confirmed.
Woessmann (Citation2016) argues that there is international variation in the relative numbers of public versus private schools. In countries where the proportion of private schools is higher, the degree of segregation between students with low and high parental SES is higher than in countries with relatively higher numbers of public schools (Dronkers & Avram, Citation2010). It is assumed that in countries where the proportion of private schools is high, the probability of being a top performer is lower for socioeconomically disadvantaged students, as a result of the greater difference in the quality of education between school types. When the proportion of private schools is high, more pupils with high parental SES likely attend private schools with more facilities for high-ability students, while students from low-SES parents typically attend public schools with fewer opportunities for them. In line with this reasoning, the following hypothesis is formulated: The higher the proportion of private schools in a country, the stronger the negative effect of low parental SES on the probability of a child being a top-performing student (Hypothesis 5).
Research design
Data
In order to empirically test the formulated hypotheses, the PISA 2015 data were analysed. This triennial, high-quality international survey is collected by the OECD, and is representative of 15-year-olds in 72 countries. Towards the end of their compulsory education, more than half a million students were assessed on, among other things, their reading and mathematics competencies. Furthermore, additional information on their backgrounds, learning styles, and environment was collected using questionnaires (OECD, Citation2017a). In the present article, only the OECD countries were investigated, because it is assumed that these industrialised countries are comparable in terms of their development (Van Hek, Citation2016). Four OECD countries were excluded from the empirical analysis (Chile, Estonia, France, Mexico), since no information on one (or more) educational system characteristic(s) was available for these countries, which eventually resulted in 31 countries on which the empirical analysis was based. After removing respondents who had an invalid answer on one or more of the analysed variables, the analytical sample consisted of a total of 216,980 students from 8,390 schools.
Measurements
Top-performing students
Individual student performance was measured on the basis of the PISA test scores in the domains of reading and mathematics. These scores are highly comparable between countries, as the tests do not focus on the curriculum taught at school but on the application of the student’s knowledge to real-life challenges. Both multiple-choice and open-ended questions were included in the assessment.
The PISA dataset contains information on a large set of similar questions which assess student competencies, with each student answering only a random fraction of the available questions. As not every student answered the same questions, PISA 2015 calculated 10 so-called “plausible values” for each domain (OECD, Citation2017b), based on item response theory (Mislevy & Sheehan, Citation1987). These plausible values “are a representation of the range of abilities that a student might reasonably have [… .] Instead of directly estimating a student’s ability, a probability for a student’s ability is measured” (OECD, Citation2009b, p. 96). It is not permitted to compute an average based on these 10 plausible values beforehand. Following Bol et al. (Citation2014), the parameters were averaged after the separate estimation of the models in the multivariate analysis performed here. The standard errors were calculated, taking into account the within and between variance of the plausible values.
To determine the proportion of top-performing students in reading, the OECD definition of top performers was used. In PISA 2015, the reading assessment was divided into six levels of complexity. According to the OECD (Citation2009a), top performers in reading are students who reached Level 5; therefore, the students who reached Levels 5 or 6 in PISA 2015, that is, who scored 626 or more points on the achievement test, were considered top-forming students in this study. A dichotomous variable was constructed to distinguish top performers in reading from the rest of the population. The measurement of top performers in mathematics was similar; students proficient at Levels 5 or 6 (over 607 points) in the mathematics test were considered top performers.
Individual variables
Parental socioeconomic status (SES) was measured by the index of economic, social and cultural status (ESCS). This index combines the parents’ highest level of education, highest occupation status, and home possessions. The latter is a proxy for family wealth, as it includes the ownership of items such as books, a television, computers, and musical instruments. A score of zero on this index represents an average OECD student. For students who had a missing value on one of the three variables, missing data were imputed. In case of more than two missing values for one of the three variables, the index of ESCS was scored as missing. The constructed measurement was included in the empirical analysis as a scale variable, with the original scores reversed so that a high score indicates low parental SES.Footnote1
Contextual variables
Early tracking in a country is indicated by the age of students at the first selection, number of different curricular tracks available for 15-year-old students, and the duration of the tracked curriculum. These three measurements were all derived from the OECD (Brunello & Checchi, Citation2007; OECD, Citation2006) and combined into a tracking index as determined by Bol et al. (Citation2014). Although the measurements in the index might be considered relatively outdated, it is unlikely that major changes to the educational system occurred in multiple countries (Van Hek, Citation2016), since these kinds of transitions take a long time to reinforce.
Educational standardisation refers to the presence of central examinations in a country as the most vital tool for school accountability, because they implement nationwide transparency in performance. In this article, the definition of Bol et al. (Citation2014) is used, which is based on the operationalisation of Bishop (Citation1997), who proposed five criteria for central exams: (1) The diploma has real consequences and is not merely symbolic, (2) diplomas are tested against a national standard, (3) central examinations are organised by discipline, (4) the outcome is not dichotomous (pass/fail), and (5) the exam is part of secondary education and covers most of the student population in secondary education. If countries meet these criteria, they were coded 1 (central exams), while most other countries received a value of 0 (no central exams). Four countries received a different value (Australia, Canada, Germany, and the United States) because central examinations are held in only some states or provinces within the country.
The last contextual variable that was constructed is the proportion of private schools within a country. Derived from the OECD (Citation2012), the percentage of enrolment in private education institutions was determined for each country. Private schools are schools that are directly or indirectly managed by a non-government organisation, such as a church, trade union, business, or other private institution (see OECD, Citation2012, p. 74). The measurement refers to the situation in 2009.
In , the country-specific scores for the educational characteristics under investigation are presented. For means of interpretation, all country-specific characteristics were standardised as z scores.
Table 1. Overview of country-specific characteristics for each country (N = 31).
Control variables
At the individual level, gender, age, ethnicity, and the possibility that a student repeated a year were controlled for. Gender was measured as 0 “male” and 1 “female”. Although 15-year-old students took the PISA 2015, their age differed in terms of months. The measurement of ethnicity involved the country of origin of the mother, father, and child. In cases where at least one of these people was born in a country other than the one in which the PISA test was taken, the student was classified as a “migrant”. Repeating a year was divided into students who repeated a year (1) and students who did not (0).
The variables of private school, school size, availability of school materials, and school location were statistically controlled for at the school level. Private school refers to the distinction between schools that are private and public (reference category). School size was measured as the total number of students enrolled at the school. Availability of school materials was determined by the question that explored the capacity of the school to provide instructions, and to what extent this was hindered by a lack of, or inadequacy in, (a) teaching staff, (b) assisting staff, (c) educational materials, and (d) physical infrastructure. The average of the values scored on these questions was taken for each school. School location was categorised as village (reference category), small town, town, city, and large city.
At the country level, gross domestic product (GDP) per capita was included as a covariate (The World Bank, Citation2017). For ease of interpretation, GDP per capita was transformed into z scores.
Descriptive statistics of all dependent and independent variables used in the empirical analysis are presented in .
Table 2. Descriptive statistics of all variables analysed.
Analysis
In order to estimate the likelihood of a student being a top performer and to statistically test the formulated hypotheses, multilevel logistic regression models were estimated using PQL in R. In these models, three different levels were distinguished, since students (Level 1) were nested within schools (Level 2), and schools were located in countries (Level 3). Although we did not formulate specific hypotheses at the school level, the data structure demands that student nesting in schools and countries is controlled for (Snijders & Bosker, Citation2012). As was discussed above, the models were estimated for every plausible value separately. To take into account the within and between variance of the plausible values, the average estimates, standard errors, and significance levels were determined in accordance with the proposed formulas of Rubin (Citation1987).
In Model 1, the effect of low parental SES is estimated, statistically controlling for the distinguished background variables measured at the individual, school, and country level. Model 2 includes the main effects of early tracking, educational standardisation, and the proportion of private schools. In Model 3, the effect of low parental SES was allowed to vary between countries (i.e., the slope of this parameter was set at random). In the following three models (Models 4 to 6), statistical interaction terms between low parental SES and the characteristics of the educational system were added one by one. In the final model (Model 7), all these cross-level interactions were estimated simultaneously.
Results
Descriptive results
presents the percentage of top-performing students for reading across different levels of parental SES.Footnote2 The proportion of top-performing students in reading differs greatly between countries. Korea had the highest proportion of top-performing students, while in Turkey the lowest proportion was observed. The cross-country variation in top performance largely reflects country differences in average performance (not shown). At the country level, the correlation between the average performance of students and the proportion of top-performing students is 0.85.
Figure 1. The percentage of top-performing students in reading within each category of parental SES (N = 31).
Source: PISA 2015.
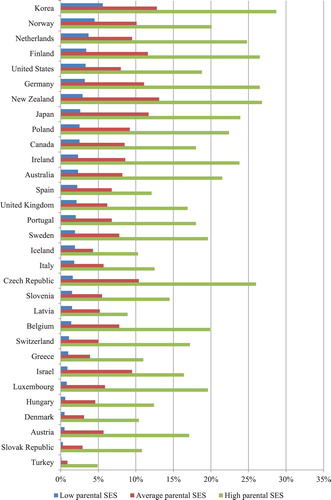
To a large extent, this association was also found when looking at cross-national variation in the percentage of top-performing students with low parental SES. Once again, Korea had the highest percentage of top performers within the students with low parental SES, while Turkey had the lowest percentage of top performers within this group of students. In the latter country, less than 1% of students with low parental SES are top performers. These results indicate that countries only have a high percentage of top performers (within each parental SES category) when the national average is high.
In addition, the percentage of high performers within the group of students with low parental SES within a country depends on the association between parental SES and top performance in that county. This association clearly differed between countries; for instance, the United States and Germany had almost the same relatively high percentage of top-performing students from low-SES backgrounds, whereas in the latter country the corresponding percentage of top performers within the group of students with high parental SES was much higher than in the former one. Another example is the comparison between Latvia and Belgium, which both had a rather small percentage of top performers within the low-SES category, whereas the percentage of top performers within the high-SES category is much higher in Belgium than in Latvia.
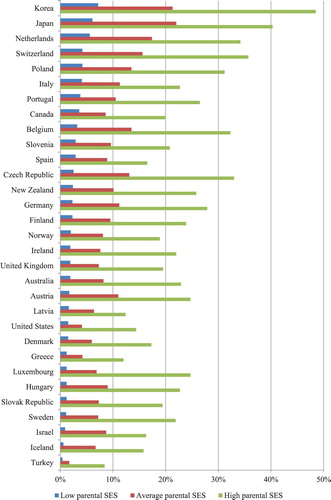
For mathematics, we found quite similar results, as can be seen from .
Figure 2. The percentage of top-performing students in mathematics within each category of parental SES (N = 31).
Source: PISA 2015.
Multilevel models
The results of the multilevel logistic regression models for reading and mathematics are presented in and , respectively. Since the findings did not substantially differ between the two domains, we discuss their results in combination following the order of the formulated hypotheses, highlighting any substantial differences in the parameter estimates between reading and mathematics in the text.
Table 3. Logistic multilevel regression analysis of the probability to be a top-performing student in reading.
Table 4. Logistic multilevel regression analysis of the probability to be a top-performing student in mathematics.
Model 1 demonstrates that low parental SES has a negative effect on the probability of a child being a top-performing student (for reading: B = −0.632; for mathematics: B = −0.622). This result is in line with Hypothesis 1. In addition, various control variables affect the probability of being a top-performing student. Girls were more likely to be top performers in reading, while boys had a higher probability of being a top performer in mathematics. Furthermore, younger students, students with a migrant background, and students who repeated a year had a lower probability of being a top-performing student. Regarding school characteristics, attending a private school, school size, and the availability of school materials positively related to the likelihood of top performance. The probability of being a top-performing student is higher for those attending a school in a (large) city than a school in a village. Finally, the higher the GDP in a country, the higher the probability that a child in this country is a top-performing student.
Model 2 includes the main effects for early tracking, educational standardisation, and the proportion of private schools. The results reveal that early tracking (only for reading) is negatively associated with the probability of being a top-performing student.
In Model 3, the effect of low parental SES was allowed to vary between countries. The variation in the slopes of low parental SES indicates that there is country-specific variation in the effect of parental SES. This finding supports Hypothesis 2, which states that the negative effect of low parental SES on the probability of being a top-performing student varies across countries.
The next three models (Models 4 to 6) investigate the effect of the educational system characteristics on the relationship between parental SES and top performance. Only one (marginally) significant interaction term was found; in Model 4, it could be observed that students with low parental SES have a lower probability of being a top-performing student in mathematics (B = −0.660), and that this negative effect is weaker in countries where tracking occurs earlier in the educational career (B = 0.086).
The moderating effect of an early tracking system on the negative relationship between low parental SES and the probability to be a top-performing student in mathematics remained significant (B = 0.087) when all interaction terms were estimated simultaneously in the final model. Since the effect of the interaction term between early tracking and low parental SES was in the opposite direction than expected, Hypothesis 3 should be rejected. Hypotheses 4 and 5 should also be rejected, given the absence of significant cross-level interactions between educational standardisation and the proportion of private schools, on the one hand, and low parental SES, on the other hand.
Conclusion and discussion
This article focused on cross-country variation in excellence gaps in reading and mathematics in secondary education. Research into top performance is considered important, as high-ability workers can come up with creative ideas and technologies, which ultimately stimulate economic growth (Gelade, Citation2008; Olszewski-Kubilius & Clarenbach, Citation2012). The existence of excellence gaps can lead to inequalities in the future because student abilities are not fully developed. Taking into account the relevance of decreasing excellence gaps, this article investigated the association between parental SES and top performance across the OECD countries.
Previous research revealed that disadvantaged students are underrepresented in the top-performing students (Burroughs & Plucker, Citation2014). In line with this finding, our empirical analysis demonstrated that students with low parental SES are less frequently top performers, suggesting that an unequal distribution of parental resources contributes to unequal chances regarding excellence. Moreover, descriptive outcomes indicated that the proportion of top-performing students coming from (dis)advantaged backgrounds differs between countries. Although prior research (OECD, Citation2009a) demonstrated that differences exist between countries regarding the socioeconomic backgrounds of top-performing students, the cross-national variation in the distribution of the socioeconomic backgrounds of top-performing students does not exactly correspond with the findings in this article. However, one should keep in mind that earlier results were based on data from 2006, whereas we used data from almost 10 years later.
Next, we empirically tested whether the negative effect of parental SES on the likelihood of being a top-performing student is related to the specific educational system characteristics that vary between countries. First of all, we predicted that if students are divided into separate (ability-based) tracks early in their educational career, (high-ability) children from low socioeconomic backgrounds are less likely to be top performers than similar children in a context where early tracking does not occur; however, no empirical evidence was found for this hypothesis. In fact, early tracking appears to benefit low-SES top-performing students in mathematics. These findings may indicate that the lack of parental resources does not necessarily lead to lower educational levels. While parental promotion of reading is proved to be an effective strategy for higher reading skills later on in life (Kraaykamp, Citation2003), parental involvement (i.e., helping with homework) in mathematics does not impact student achievement (Pezdek, Berry, & Renno, Citation2002). In addition, disadvantaged, lower educated parents could have difficulties helping their child because of the increased complexity of the mathematics curriculum across the school years (Sheldon & Epstein, Citation2005). The competencies of high-ability children might quickly exceed their parents’ understanding.
Educational standardisation did not affect the impact of parental SES on top performance. Van de Werfhorst and Mijs (Citation2010) differentiated between multiple forms of standardisation. In addition to central examinations investigated in the present empirical analysis, standardisation can refer to the standardisation of the educational curriculum and the central organisation of the distribution of text books and other school supplies. Since we were not able to make a distinction between these different aspects of standardisation in the present study, it is possible that educational standardisation may affect the relationship between parental SES and top performance; however, elucidating this hypothesis would require a more complete measure of educational standardisation.
A large number of studies have been conducted on the differences in student performance between public and private schools (e.g., Dronkers & Avram, Citation2010). The findings of these studies often demonstrate that students from private schools perform better than students from public schools (Fuchs & Woessmann, Citation2007). In this article, we showed that, in contrast to our hypothesis, the negative relationship between low parental SES and the probability of a child being a top-performing student was not affected by the proportion of private schools in a country. Dronkers and Avram (Citation2010) distinguished between private-dependent and private-independent schools. The school funding controversies in many (predominately Catholic) European countries at the end of the 19th century resulted in high proportions of denominational private institutions in these countries today. Although these schools are characterised as private, their funding often depends on the government. One explanation for the absence of a stronger effect of low parental SES on top performance in countries with a high proportion of private schools, such as Belgium and Ireland, could be that no differentiation was made between private-dependent and private-independent schools. In addition, Woessmann (Citation2016) argues that private schools might increase the competitiveness of public schools, which could improve education across the whole system and lift the educational achievement of all groups of students. Accordingly, high-ability students from disadvantaged backgrounds would not be more deprived in countries with a high proportion of private schools.
All in all, the findings of this article imply that an ascribed characteristic, parental SES, is once again confirmed as being influential as a socioeconomic marker of inequality of opportunity in education. Malleable educational system characteristics such as differentiation or educational tracking, educational standardisation, and the proportion of private schools could not affect the strength of the relationship between parental SES and student excellence in reading and mathematics. This clearly demonstrates the constraints of educational reform in reducing inequality in educational opportunity, despite the high societal expectations and numerous educational policies that have been implemented to achieve this in many, if not all, OECD countries over the past few decades.
At least four recommendations for future research into top performance should be considered. First, the educational system characteristics examined in this article were only available for the more developed countries (i.e., the OECD countries), meaning that less affluent countries were not acknowledged. Although this limitation exists for understandable reasons, future researchers should attempt to investigate a broader range of countries.
Second, in PISA 2015, information was collected on the availability and use of ICT. The lack of digital tools at home could lead to inequality between students from more and less disadvantaged backgrounds, as is hypothesised by Hardesty et al. (Citation2014). To empirically test whether the digital turn affects the achievement gap, the analysis of ICT availability and usage is necessary.
Third, we only examined excellence gaps across different levels of parental SES; however, a focus on gender and ethnic differences in top performance would also be very interesting. Future research should examine these dimensions of social inequality as well.
Fourth, and finally, international measurements of educational achievement are repeated on a regular basis. PISA, for instance, is repeated every 3 years. It would therefore be interesting to expand the current analysis by looking at trends in excellence gaps over time.
Disclosure statement
No potential conflict of interest was reported by the author(s).
Notes on contributors
Babs Jacobs was a research master’s student in social and cultural science at Radboud University, Nijmegen, The Netherlands. This paper is based on her master’s thesis, which focuses on excellence and excellence gaps from an international perspective. She is currently employed as a researcher at the Research Centre for Education and the Labour Market (ROA), Maastricht University, The Netherlands.
Maarten H. J. Wolbers is a professor in educational research in the Department of Sociology, Radboud University, Nijmegen, The Netherlands. His research interests include the sociology of education, work and labour markets.
Notes
1 In addition, models were also estimated in which parental SES was dichotomised as “low” and “high”. Students who originally scored below the OECD average (0) were categorised as students with low parental SES, while students who scored at least average were classified as students with high parental SES. Using these models (available on request), similar results to the ones presented in this article were obtained.
2 In contrast to the multivariate analysis, parental SES is categorised here as “low”, “average”, and “high”. This enables a better insight into the distribution of top performers across the different parental SES levels. The categories were based on the ESCS index. High parental SES represents students who originally scored more than one standard deviation (+1) above zero. Students with average parental SES scored between −1 and 1 on the index, while the category of low parental SES includes all scores below −1.
References
- Bishop, J. H. (1997). The effect of national standards and curriculum-based exams on achievement. The American Economic Review, 87(2), 260–264. Retrieved from http://www.jstor.org/stable/2950928
- Bol, T., & Van de Werfhorst, H. G. (2013). Educational systems and the trade-off between labor market allocation and equality of educational opportunity. Comparative Education Review, 57(2), 285–308. doi: 10.1086/669122
- Bol, T., Witschge, J., Van de Werfhorst, H. G., & Dronkers, J. (2014). Curricular tracking and central examinations: Counterbalancing the impact of social background on student achievement in 36 countries. Social Forces, 92(4), 1545–1572. doi: 10.1093/sf/sou003
- Brunello, G., & Checchi, D. (2007). Does school tracking affect equality of opportunity? New international evidence. Economic Policy, 22(52), 781–861. Retrieved from http://www.jstor.org/stable/4502215
- Burroughs, N. A., & Plucker, J. A. (2014). Excellence gaps. In J. A. Plucker & C. M. Callahan (Eds.), Critical issues and practices in gifted education: What the research says (2nd ed., pp. 255–265). Waco, TX: Prufrock Press.
- Domina, T. (2005). Leveling the home advantage: Assessing the effectiveness of parental involvement in elementary school. Sociology of Education, 78(3), 233–249.
- Dronkers, J., & Avram, S. (2010). A cross-national analysis of the relations of school choice and effectiveness differences between private-dependent and public schools. Educational Research and Evaluation, 16(2), 151–175. doi: 10.1080/13803611.2010.484977
- Dronkers, J., & Robert, P. (2008). Differences in scholastic achievement of public, private government-dependent, and private independent schools: A cross-national analysis. Educational Policy, 22(4), 541–577. doi: 10.1177/0895904807307065
- Fuchs, T., & Woessmann, L. (2007). What accounts for international differences in student performance? A re-examination using PISA data. Empirical Economics, 32(2–3), 433–464. doi: 10.1007/s00181-006-0087-0
- Gelade, G. A. (2008). IQ, cultural values, and the technological achievement of nations. Intelligence, 36(6), 711–718. doi: 10.1016/j.intell.2008.04.003
- Hanushek, E. A., & Woessmann, L. (2011). The economics of international differences in educational achievement. In E. A. Hanushek, S. Machin, & L. Woessmann (Eds.), Handbook of the economics of education (Vol. 3, pp. 89–200). Amsterdam: North Holland.
- Hardesty, J., McWilliams, J., & Plucker, J. A. (2014). Excellence gaps: What they are, why they are bad, and how smart contexts can address them … or make them worse. High Ability Studies, 25(1), 71–80. doi: 10.1080/13598139.2014.907646
- Horn, D. (2009). Age of selection counts: A cross-country analysis of educational institutions. Educational Research and Evaluation, 15(4), 343–366. doi: 10.1080/13803610903087011
- Kerckhoff, A. C. (2001). Education and social stratification processes in comparative perspective. Sociology of Education, 74, 3–18. doi: 10.2307/2673250
- Kraaykamp, G. (2003). Literary socialization and reading preferences. Effects of parents, the library, and the school. Poetics, 31(3–4), 235–257. doi: 10.1016/S0304-422X(03)00033-0
- Livingstone, S., & Helsper, E. (2007). Gradations in digital inclusion: Children, young people and the digital divide. New Media & Society, 9(4), 671–696. doi: 10.1177/1461444807080335
- Marks, G. N. (2005). Cross-national differences and accounting for social class inequalities in education. International Sociology, 20(4), 483–505. doi: 10.1177/0268580905058328
- Mislevy, R. J., & Sheehan, K. M. (1987). Marginal estimation procedures. In A. E. Beaton, Implementing the new design: The NAEP 1983–84 technical report (pp. 293–360). Princeton, NJ: National Assessment of Educational Progress, Educational Testing Service.
- Montt, G. (2011). Cross-national differences in educational achievement inequality. Sociology of Education, 84(1), 49–68. doi: 10.1177/0038040710392717
- Olszewski-Kubilius, P., & Clarenbach, J. (2012). Unlocking emergent talent: Supporting high achievement of low-income, high-ability students. Washington, DC: National Association for Gifted Children.
- Organisation for Economic Co-operation and Development. (2006). Education at a glance 2006. Paris: Author.
- Organisation for Economic Co-operation and Development. (2009a). Education at a glance 2009. Paris: Author.
- Organisation for Economic Co-operation and Development. (2009b). PISA data analysis manual, SPSS (2nd ed.). Paris: Author.
- Organisation for Economic Co-operation and Development. (2012). Public and private schools: How management and funding relate to their socio-economic profile. Paris: Author.
- Organisation for Economic Co-operation and Development. (2017a). PISA 2015 assessment and analytical framework: Science, reading, mathematic, financial literacy and collaborative problem solving. Paris: Author.
- Organisation for Economic Co-operation and Development. (2017b). PISA 2015 technical report. Paris: Author.
- Pezdek, K., Berry, T., & Renno, P. A. (2002). Children’s mathematics achievement: The role of parents’ perceptions and their involvement in homework. Journal of Educational Psychology, 94(4), 771–777. doi: 10.1037/0022-0663.94.4.771
- Pfeffer, F. T. (2008). Persistent inequality in educational attainment and its institutional context. European Sociological Review, 24(5), 543–565. doi: 10.1093/esr/jcn026
- Plucker, J. A., Hardesty, J., & Burroughs, N. (2013). Talent on the sidelines: Excellence gaps and America’s persistent talent underclass. Storrs, CT: Center for Education Policy Analysis, Neag School of Education, University of Connecticut.
- Roscigno, V. J., & Ainsworth-Darnell, J. W. (1999). Race, cultural capital, and educational resources: Persistent inequalities and achievement returns. Sociology of Education, 72(3), 158–178. doi: 10.2307/2673227
- Rubin, D. B. (1987). Multiple imputation for nonresponse in surveys. New York, NY: Wiley.
- Rutkowski, D., Rutkowski, L., & Plucker, J. A. (2012). Trends in education excellence gaps: A 12-year international perspective via the multilevel model for change. High Ability Studies, 23(2), 143–166. doi: 10.1080/13598139.2012.735414
- Sheldon, S. B., & Epstein, J. L. (2005). Involvement counts: Family and community partnerships and mathematics achievement. The Journal of Educational Research, 98(4), 196–207. doi: 10.3200/JOER.98.4.196-207
- Sirin, S. R. (2005). Socioeconomic status and academic achievement: A meta-analytic review of research. Review of Educational Research, 75(3), 417–453. doi: 10.3102/00346543075003417
- Snijders, T. A. B., & Bosker, R. J. (2012). Multilevel analysis: An introduction to basic and advanced multilevel modeling (2nd ed.). London: SAGE.
- Subotnik, R. F., Olszewski-Kubilius, P., & Worrell, F. C. (2011). Rethinking giftedness and gifted education: A proposed direction forward based on psychological science. Psychological Science in the Public Interest, 12(1), 3–54. doi: 10.1177/1529100611418056
- Tam, V. C., & Chan, R. M. (2009). Parental involvement in primary children’s homework in Hong Kong. School Community Journal, 19(2), 81–100.
- The World Bank. (2017). GDP per capita (current US$) [Data file]. Retrieved from http://databank.worldbank.org/data/reports.aspx?source=2&series=NY.GDP.PCAP.KD&country=#
- Tomlinson, C. A., & Jarvis, J. M. (2014). Case studies of success: Supporting academic success for students with high potential from ethnic minority and economically disadvantaged backgrounds. Journal for the Education of the Gifted, 37(3), 191–219. doi: 10.1177/0162353214540826
- Van Damme, J., & Bellens, K. (2017). Countries strive towards more quality and equity in education: Do they show success or failure? Evidence from TIMSS 2003 and 2011, for Grade 4. In M. Rosén, K. Yang Hansen, & U. Wolff (Eds.), Cognitive abilities and educational outcomes (pp. 127–148). Cham: Springer.
- Van de Werfhorst, H. G., & Mijs, J. J. B. (2010). Achievement inequality and the institutional structure of educational systems: A comparative perspective. Annual Review of Sociology, 36, 407–428. doi: 10.1146/annurev.soc.012809.102538
- Van Hek, M. (2016). Gender inequality in educational attainment and reading performance: A contextual approach (Unpublished doctoral dissertation). Radboud University, Nijmegen.
- Wai, J., & Worrell, F. C. (2016). Helping disadvantaged and spatially talented students fulfill their potential: Related and neglected national resources. Policy Insights from the Behavioral and Brain Sciences, 3(1), 122–128. doi: 10.1177/2372732215621310
- Woessmann, L. (2016). The importance of school systems: Evidence from international differences in student achievement. Journal of Economic Perspectives, 30(3), 3–32. doi: 10.1257/jep.30.3.3