
Abstract
Objective
Examination of gender and diversity issues within clinical neuropsychology, using data from the 2020 professional practice and “salary survey.”
Methods
Clinical neuropsychologists in the U.S. and Canada were invited to participate in an online survey. The final sample consisted of 1677 doctoral-level practitioners.
Results
Approximately, 60% of responding neuropsychologists are women and 53.8% of those women identify as early career psychologists (ECPs). Conversely, a majority of men in the sample are advanced career psychologists (ACPs). Both genders work predominantly in institutions, but more men than women work in private practice. ACP men produce a greater number of peer-reviewed publications and conference presentations. Across all work settings, women earn significantly less than men, and are less satisfied with their incomes. Establishing and maintaining family life is the biggest obstacle to attaining greater income and job satisfaction for both genders. Ethnic/racial minority status was identified in 12.9% of respondents, with 59.2% being ECPs. Job satisfaction and hostility in the workplace vary across ethnic/racial minority groups. Hispanic/Latino(a) and White neuropsychologists report higher incomes, but there were no statistically significant differences between any of the groups.
Conclusions
Income and select practice differences persist between female and male neuropsychologists. There is a slow rate of increased ethnic/racial diversity over time, which is much more apparent among early career practitioners. Trajectories and demographics suggest that the gender income gap is unlikely to be improved by the next survey iteration in 2025, whereas it is very likely that ethnic/racial diversity will continue to increase gradually.
Introduction
As the specialty of clinical neuropsychology has continued to grow in number of professionals engaged in active practice, there has been increasing interest in self-examination regarding practitioner characteristics, activities, beliefs, and incomes. This increased interest has been evident in frequent surveying of practitioners, to the extent that Marcopulos et al. (Citation2020) provided a systematic review of surveys pertaining to clinical neuropsychology, and Guterbock and Marcopulos (Citation2020) have provided a critique of relevant surveys, as well as guidance regarding best practices of surveying our specialty. Simultaneously, recent societal events, such as harsh pandemic-related job disruption, disproportionate job loss for women, violence directed against persons of color, and related social justice issues, have heightened the need to study characteristics and attainments of members within various professions. Within the specialty of clinical neuropsychology, such self-study includes a desire to understand the current status and trajectories associated with important sociodemographic variables, such as gender and ethnic/racial diversity.
This investigation explores data generated by the most recent large-scale professional practice survey in clinical neuropsychology, specifically as they relate to gender and ethnic/racial diversity. Of these two topics, gender has received the greater amount of attention from research investigators, primarily as gender relates to income disparities (Sweet et al., Citation2018) and leadership roles (Sachs et al., Citation2018; Rohling et al., Citation2022).
Readers should note that common parlance referring to the “gender pay gap” is synonymous with “gender wage gap.” Both are commonly used to refer to comparisons of remuneration between women and men for work-related activities. Considering that the terms “pay” and “wage” sometimes refer to work positions with assigned hourly or annual payment for services, broader and more inclusive conceptual terminology from a financial perspective would be “gender earnings gap” or “gender income gap,” terms that acknowledge real world work scenarios in which monetary differences can extend beyond assigned hourly and annual remuneration for work-related activities (e.g. the possibility that hours worked beyond minimum expectations can allow greater proportional hourly or bonus earnings). For this reason, we have chosen to use “gender income gap” when referring to differences in remuneration between women and men for work-related activities.
By comparison to the topic of gender, research related to ethnic/racial diversity in clinical neuropsychology has received less attention. Historically, the reason appears to reflect the relative lack of ethnic/racial diversity that has existed among clinical neuropsychology practitioners in the United States, though there is encouraging evidence that diversity trends are slowly increasing across time (Sweet et al., Citation2021b). In general, when subsets of survey respondents are under-represented, detailed analyses may be limited or even precluded. For this reason, important questions related to ethnicity and race have in the past been statistically difficult to address, a scenario that is only relatively better in the 2020 survey dataset. Notwithstanding continued limitations imposed by under-represented samples, the present investigation is intended to more thoroughly investigate ethnic/racial diversity, primarily using the latest 2020 professional practice survey data.
We acknowledge that gender and ethnic/racial identification are complex and multifaceted topics. Both have received increased attention in the last few years. As one of the primary goals of this article was to make comparisons across time, we elected to keep terminology synonymous with legacy terminology from prior iterations of the practice and “salary survey” when there was less emphasis placed on distinguishing between biological sex and gender, and different terminology was used for ethnic/racial groupings. Looking ahead to the next version of this survey, it will be imperative to include categories for gender diverse/gender non-conforming neuropsychologists, as well as to offer more specific categories for ethnicity/race that are consistent with government agencies and researchers in 2025.
Method
Original survey data in the present article were collected as part of a larger professional practice survey project. Preparation for the overall survey project began in 2018, with the development of the final survey instrument completed in the fall of 2019 (see also Sweet et al., Citation2021a, Citation2021b for a summary of the current survey methods). The Institutional Review Board (IRB) of NorthShore University HealthSystem approved the study in July 2019. The survey instrument was sent via electronic means (e.g. professional listserv announcements and e-mail blasts) to clinical neuropsychologists and postdoctoral trainees who practiced within the United States and Canada. Whereas previous articles summarize results of the overall survey findings among clinical neuropsychologists who practice in the U.S. (Sweet et al., Citation2021b) and Canada (Nelson et al., Citation2021), as well as postdoctoral residents (Sweet et al., Citation2021a), this study provides a more elaborate focus on gender and ethnic/racial diversity factors, using only the largest dataset of U.S. practitioners. New items addressing gender and diversity issues in greater detail were added in this iteration of the practice survey, including items related to aspects of career satisfaction, various career obstacles, and reasons for changing jobs, such as perceived unfairness/mistreatment. The full survey is available as an online supplement at The Clinical Neuropsychologist website (https://www.tandfonline.com/doi/suppl/10.1080/13854046.2020.1849803).
As was the case with the professional practice and income surveys conducted in 2005, 2010, and 2015, the current survey was administered through PsychData (https://www.psychdata.com/default.asp), an online platform developed by psychologists for internet-based research in the social sciences. The anonymous survey was opened online on 17 January 2020, at 9:00 a.m. Central Time, which corresponded with the sending of electronic invitations through professional listserv announcements and email blasts (see Acknowledgements for specifics), as well as mailing of postcards to neuropsychologists in the United States (see Sweet et al., Citation2021b for a detailed description of how mailing addresses were attained). A second wave of postcards was mailed in March 2020. The survey portal closed on 2 April 2020, at 10:00 a.m. Central Time, and all data were examined for usability (see Sweet et al., Citation2021b for a detailed description of the number of times the survey was accessed, data cleaning procedures, and computation of the usable final sample of 1677 U.S. practitioners).
Sample sizes vary across tables and sometimes within tables, as respondents used discretion as to the survey items they wanted to complete and those they elected to skip. Statistical analyses have been carried out within most tables, in an attempt to identify statistically significant differences between genders and between various ethnic/racial groups. The statistical analyses used to compare means and frequencies among the various groups include: a) chi-square analyses when examining differences between two categorical variables; b) independent samples t-tests to examine differences in means between women and men; c) one-way analysis of variance to determine whether there are statistically significant differences between the means of three or more independent groups (e.g. when comparing the means of the three career stages and when comparing the means of the different ethnic/racial groups); and d) two-way analysis of variance to test the effect of two independent variables on a dependent variable (e.g. when comparing the combined effects of gender and career stage on a dependent variable). Readers should note that in some tables, means will not evenly divide the reported minimum–maximum values, and at times there are large discrepancies between means and medians. Generally, in these instances of non-normal distributions, medians will provide more useful information. Non-normal distributions can also indicate the presence of outliers, which may disproportionately influence central tendency indicators.
Before analyses were completed, we identified and corrected for different types of extreme data points. Obvious data entry errors (e.g. annual full-time income of 0.00) were removed (n = 40). When numerical entries were required, but non-numerical words were entered, these responses were removed (n = 70). Numerical entries of extremely discrepant values on a statistical basis, which in most instances also appeared grossly unreasonable relative to available and historic survey data (e.g. a forensic hourly fee of $20,000), were removed first, and then the tails of the distribution were trimmed at the 5th and 95th percentiles. Statistical trimming of the tails occurred for the variables of annual income, clinical hourly fees, forensic hourly fees, and weekly forensic work hours.
In keeping with our previous work (cf., Sweet et al., Citation2006, Citation2011, Citation2015), and the 2020 parent survey database and publication from which the current results were derived (cf., Sweet et al., Citation2021b), we adopted a criterion of .01 for statistical significance as a strategy of guarding against false discovery (type I error). We also present effect size comparisons to assess the relative meaningfulness of demonstrated statistical test findings.
Related to the two topics of interest in this article, respondents were asked to select their “sex” from the following three answer choices: 1) female, 2) male, and 3) I prefer not to answer. They were also asked, “What is your ethnic/racial heritage” and selected from seven answer choices: 1) African American/Black, 2) American Indian or Alaskan Native, 3) Asian or Pacific Islander, 4) Biracial/Multiethnic/Multiracial, 5) White, 6) Hispanic/Latino(a), and 7) I choose not to disclose this information. Importantly, regarding gender, a majority of respondents identified as either female or male, and only 10 respondents selected “I prefer not to answer.” Given the small number in the latter group, only those who identified as female or male were included in the final analyses of this article. Similarly, with regard to self-assigned ethnic/racial identity, only two individuals identified as “American Indian or Alaskan Native.” Given such a small number, these individuals were only included in select analyses related to ethnic/racial differences between subgroups of respondents. Readers should be aware that whether related to being under-represented in the survey sample, under-represented in the larger population base, or due to small sample size data in the larger population base, when data are limited to being provided by very few individuals, some variables of interest may be unreliable.
In an attempt to more thoroughly explore gender and ethnic/racial differences relative to our previous work, a career stage variable (e.g. early career, middle career, and advanced career) was created to facilitate examination of possible age and experience cohort effects. According to the American Board of Professional Psychology, an Early Career Psychologist (ECP) is a licensed, doctoral-level clinician who earned her/his doctoral degree no more than ten years ago (see: https://www.abpp.org/Applicant-Information/5-Types-of-applications/Early-Career-Psychologist.aspx). For present purposes, clinicians who reported earning their doctoral degrees between 2009 and 2019 were considered ECPs. Psychologists who earned their doctoral degrees between 2000 and 2008 were considered “middle career psychologists” (MCPs), and those who earned their doctoral degrees during or before 1999 were considered “advanced career psychologists” (ACPs).
Results
Given the numerous statistical analyses conducted in this article, not all findings will be discussed in this section and will instead be listed under the appropriate table notes below. To aid reader navigation of the numerous detailed findings reported below, the following sequence of topics is presented under major headings:
Response rate
Part 1: Gender results
general characteristics in 2020;
sample characteristics across time;
academic rank and position titles in institutions;
board certification;
scholarly activities;
income;
hourly fees;
forensic activities;
number of positions and perceived unfairness/mistreatment;
career satisfaction; and
personal/family and work environment obstacles by work setting and by professional identity to career satisfaction.
Part 2: Ethnic/racial diversity results
general characteristics in 2020;
scholarly activities;
income;
perceived unfairness/mistreatment;
career satisfaction; and
personal/family and work environment obstacles to career satisfaction.
Response rate
Every attempt was made to reach all U.S. doctoral-level neuropsychologists of the sponsoring organizations, as well as all doctoral-level practitioners within the broader U.S. community of neuropsychologists who may not belong to one of these organizations through electronic communication, including professional listserv announcements and e-mail blasts, and by U.S. mail. Assuming that the 5359 unique names and mailing addresses that were identified in 2020 are representative of all neuropsychologists, the final sample of 1677 respondents yields a response rate of 31.3%, which is a 6.2% increase compared to the 2015 survey, and is the largest sample surveyed within the specialty of clinical neuropsychology to date (see Sweet et al., Citation2021b for additional details related to the response rate).
Because the onset of the COVID-19 pandemic occurred during the survey data collection process, the possibility of effects on survey results can be raised. When examining potential differences between pre-pandemic and pandemic-era respondents, we found no significant findings. Of those who opted to disclose their gender, 82.6% of both women and men, as well as 90% of those in the chose not to disclose gender group, completed the survey prior to the official start of the pandemic. Seventy-six percent of African Americans/Blacks, 50% (i.e. one participant) of American Indians or Alaskan Natives, 84.8% of Asians or Pacific Islanders, 88.6% of Biracial/Multiethnic/Multiracial individuals, 84% of Hispanics/Latino(a)s, 82.4% of Whites, and 88.4% of those in the Chose not to disclose ethnicity/race completed the survey prior to the pandemic. Related to practice, there were no significant differences between the number of women and men who performed telehealth services prior to the start of the pandemic and those who provided such services after the start of the pandemic. Income values were not affected, as responses reflected 2019 attainments.
Part 1: gender results
General characteristics of 2020 survey respondents with regard to gender
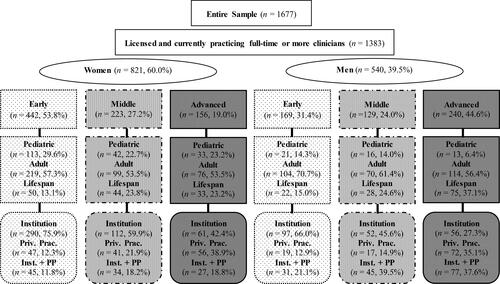
shows a breakdown of respondents by gender, career stage, professional identity, and work setting. Of the 1677 respondents who completed the survey, 1383 of those respondents indicated active professional licensure and current practice of full-time or more (e.g. full-time plus part-time positions). Sixty percent of the licensed and currently practicing clinicians in the sample are women and 39.5% are men. The remaining 0.5% was assigned to a group labeled Chose not to disclose gender.
Figure 1. Breakdown of survey participants by gender, career stage, professional identity, and work setting. Priv. Prac. = private practice; Inst. + PP = institution plus private practice. Some percentages do not total 100% due to rounding.
General characteristics of 2020 survey respondents with regard to gender and career stage
When examining women’s career stages, shows that the overwhelming majority are ECPs (53.8%), followed by MCPs and ACPs, at 27.2 and 19%, respectively. In contrast, men are more likely to be advanced in their careers (44.6%), with only 31.4% identified as ECPs and 24% identified as MCPs. Directly compared to men within each career stage, women constitute 72.3% of ECPs, 63.4% of MCPs, and 39.4% of ACPs. In the Chose not to disclose gender group, there were two ECPs, four MCPs, and four ACPs.
General characteristics of 2020 survey respondents with regard to gender, career stage, professional identity, and work setting
Regardless of career stage, as shown in , both women and men are more likely to identify as adult neuropsychologists, and most work in institutions exclusively, though advanced career men do so less frequently. Across all three career stages, many more women than men identify as pediatric neuropsychologists (percentages for women range from 22.7 to 29.6%; percentages for men range from 6.4 to 14.3%). Regarding work setting, ECPs work primarily in institutions. As one advances across the three career stages, a larger portion of time is spent working in private practice, and less time is spent working in institutions. In the work setting category of institution plus private practice, MCPs and ACPs spend approximately equal time (women: 18.2 and 18.8%, respectively; men: 39.5 and 37.6%, respectively).
Sample characteristics across time by gender
shows a comparison of the overall sample characteristics from 2005 to 2020. The presence of women in the field has steadily grown over the last 15 years, whereas the presence of men has steadily declined from 2010 to 2020. Regardless of gender, most respondents work full-time. Compared to women, men are more likely to hold both a full-time and a part-time job, and from 2005 to 2015, were less likely to be employed on a part-time basis. Women and men are most often employed in institutions, rather than private practice. shows professional identity by gender across time, with men increasingly identifying as adult neuropsychologists from 2005 to 2015, and stable identifications as adult providers in 2020. Women, by comparison, increasingly identify as pediatric neuropsychologists. The percentage of lifespan neuropsychologists, for both genders, is decreasing across time as younger neuropsychologists identify with either adult or pediatric practice.
Figure 2. Professional identity across time by gender.
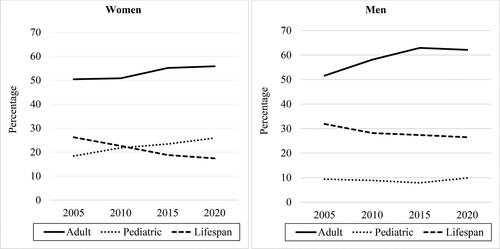
Table 1. Comparison of overall sample characteristics from 2005 through 2020.
Academic rank and position titles in institutions by gender
shows gender comparisons in academic rank and position titles within institutional settings in 2015 and 2020. At both time points, women have been more likely than men to be assistant professors, whereas men have been more likely to hold the academic rank of professor compared to women. No matter the gender, a majority of respondents hold the clinical position title of staff neuropsychologist/psychologist. From 2015 to 2020, clinical position titles have remained largely consistent for both women and men.
Table 2. Gender comparisons in academic rank and position titles within institutional settings from 2015 through 2020.
Board certification by gender
shows the differences between women and men in each of the three career stages with regard to ABCN board certification, as well as interest in becoming board certified. There were no significant differences between women and men regarding career stage. Interestingly, the earlier women are in their careers, the more likely they are to be board certified, whereas the opposite is true for men (i.e. ACP men are more likely to be board certified than those in their early and middle careers). Among individuals who are not board certified, interest in ABCN board certification is significantly greater for women than men, χ2[1]=46.1, p<.001; there are no significant differences between the genders when examining career stage. Interest in board certification is the highest for ECP women and ECP men and steadily declines over time.
Table 3. Obstacles to pursuing American Board of Clinical Neuropsychology (ABCN) board certification.
Obstacles to pursuing ABCN board certification by gender
Also included in are potential obstacles that respondents may face when pursuing board certification. Significantly more women than men indicated that prohibitive time commitment and prohibitive cost are barriers to pursuing ABCN board certification, χ2[1]=11.9, p=.001; χ2[1]=9.1, p=.003, respectively. Significantly more men than women indicated that the obstacles that compose the “other” group create barriers to pursuing ABCN board certification, χ2[1]=7.4, p=.007. There were no significant differences between women and men when examining obstacles present at various career stages.
Scholarly activities by gender
reflects the number of peer-reviewed publications and conference presentations by gender and career stage. In the overall sample and within the advanced career stage, men authored or co-authored significantly more publications and conference presentations than women.
Table 4. Scholarly activities: Peer-reviewed publications and conference presentations by gender and career stage.
Scholarly activities by gender: funded research
Funded research activity deserves separate consideration. When examining rates of funded research among neuropsychologists, which included 187 women and 144 men, both groups spend approximately 11 hours per week in this role. However, funded male researchers produced significantly more publications (M=56.7, SD=60) and conference presentations (M=78, SD=71.2) than their female counterparts (M=24.8, SD=30.2; M=39.2, SD=44.2), t=5.8, p<.001, d=0.7; t=5.7, p<.001, d=0.7, respectively. There was a significant gender by career stage interaction for number of funded research publications, F (2, 318)=6.9, p=.001, and conference presentations, F (2, 313)=8.8, p<.001. ACP men produce significantly more funded publications (M=87.9, SD=63.7) and conference presentations (M=112.6, SD=74) than ACP women (M=46.3, SD=45.3; M=51.7, SD=57.8), t=3.9, p<.001, d=0.9; t=4.7, p<.001, d=0.8, respectively. All three subgroups spend similar amounts of time conducting funded research each week.
Income
Income: the gender gap across time
As depicted in and , over the last 15 years, male neuropsychologists have reported larger salaries than female neuropsychologists. In 2005, men made an average of $34,000 more than women. The gender income gap increased in 2010 to approximately $48,000, and it remained at approximately $48,000 in 2015. The gender income gap increased again from 2015 to 2020, such that the difference became statistically significant for the first time, with male neuropsychologists (M=212.4, SD=145.6) reporting higher incomes than their female counterparts (M=139.5, SD=91) by almost $73,000, t=9.0, p<.001, d=0.6.
Figure 3. Gender differences in neuropsychologist income across time.
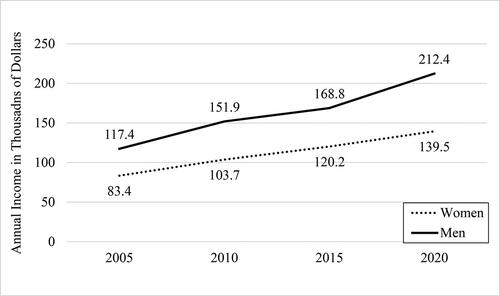
Table 5. Income: Gender differences from 2005 to 2020.
Income: the gender gap by professional identity
depicts differences in salaries across gender regarding professional identity. Across all three professional identities, men report higher incomes than women, though this difference is only statistically significant for adult (M=196.7, SD=128.3 vs. M=135.8, SD=99.5) and lifespan (M=260.4, SD=176.4 vs. M=154.5, SD=78.6) neuropsychologists.
Table 6. Income: professional identity.
Income: the gender gap by professional identity and career stage
Additional comparisons between women and men regarding professional identity and the three career stages can be seen in . With the exception of early career pediatric neuropsychologists, men earn more than women in all other groups and across all professional identities. Among pediatric neuropsychologists, there was a significant main effect for career stage; ACPs (M = 202.4, SD = 149.5) and MCPs (M = 166.0, SD = 93.2) earn significantly more than ECPs (M = 115.5, SD = 24.3). For the adult neuropsychologist group, a two-way ANOVA revealed a significant interaction effect; ACP men (M = 261.3, SD = 165.9) earn significantly more than ACP women (M = 175.9, SD = 116), and ECP men (M = 134.1, SD = 53.4) earn significantly more than ECP women (M = 114.3, SD = 18.9). Among lifespan neuropsychologists, there was a significant main effect for gender; men (M = 260.4, SD = 176.4) earn significantly more than women (M = 154.5, SD = 78.6). There was also a significant main effect for career stage, with advanced career lifespan neuropsychologists (M = 276.3, SD = 183.4) earning significantly more than middle career lifespan neuropsychologists (M = 179.3, SD = 82.4) and early career lifespan neuropsychologists (M = 142.3, SD = 88.2).
Table 7. Income: professional identity by career stage.
Income: the gender gap by work setting
shows salaries by gender with regard to work setting. Private practitioners earn more than individuals working solely in institutions and those who work in institutions plus private practice settings. Across all three work settings, men report significantly higher incomes than women.
Table 8. Income: general work setting.
Income: the gender gap by work setting and career stage
Regarding work setting and the three career stages, gender comparisons can be seen in . Across all career stages and general work settings, men report higher incomes. There was a significant main effect for career stage in each group. Among those who work in institutions, ACPs (M = 158.6, SD = 57.8) earn significantly more than MCPs (M = 138.6, SD = 33.2) and ECPs (M = 113.3, SD = 21.5), and MCPs earn significantly more than ECPs. Among those who work in private practice, ACPs (M = 289.9, SD = 201.5) earn significantly more than MCPs (M = 196.9, SD = 118.3) and ECPs (M = 149.6, SD = 85.9). In the institution plus private practice setting, ACPs (M = 262.8, SD = 157.7) earn significantly more than ECPs (M = 145.5, SD = 61.1).
Table 9. Income: general work setting by career stage.
Income: the gender gap by private practice
As can be seen in , men earn more than women in every role of private practice. Specifically, men (M = 323.1, SD = 207.3) who are sole proprietors earn significantly more than women sole proprietors (M = 189.5, SD = 131.9). Following up on the possibility that these gender-based differences might be accounted for by other variables, female sole proprietors were significantly younger than male sole proprietors (M = 50.3, SD = 10.5 vs. M = 59.6, SD = 10.2) and had been practicing fewer years (M = 18.4, SD = 10.7 vs. M = 27.1, SD = 10.7), t = 5.6, p<.001, d = 0.9; t = 5.1, p<.001, d = 0.8, respectively. Forensic hours per week were significantly different between women and men sole proprietors (women: M = 10.3, SD = 13.6 vs. men: M = 17.6, SD = 14.5), t = 3.2, p=.002, d = 0.5, as were the overall number of work hours per week (women: M = 36.3, SD = 9.3 vs. men: M = 41.4, SD = 9.4), t = 3.2, p=.002, d = 0.5.
Table 10. Income: private practice roles.
Income: the gender gap by private practice and career stage
When examining differences in private practice incomes across the three career stages, ACP men (M = 339.7, SD = 223.6) earn significantly more than ACP women (M = 211.9, SD = 157.2).
Hourly fees: clinical and forensic by gender
examines gender with regard to clinical and forensic hourly fees across general work settings. Men (M = 357.9, SD = 92) charge a significantly higher hourly fee than women (M = 334.2, SD = 84.4) for forensic work. Although the numbers reported by men across work settings appear higher per hour for clinical and forensic work, the differences are not statistically significant.
Table 11. Fees: gender comparisons of clinical and forensic hourly fees.
Forensic activities by gender
Regarding the number of hours women and men spend performing forensic activities each week, shows that men (M = 11.5, SD = 11.4), on average, spend approximately two more hours in forensic practice each week than women (M = 9.7, SD = 10.8), which is not statistically significant. There was a significant main effect for career stage; ACPs (M = 13.9, SD = 13.5) spend significantly more time in forensic practice activities than MCPs (M = 8.8, SD = 8.5) and ECPs (M = 7.2, SD = 7.3).
Table 12. Forensic: gender and forensic activity hours per week.
Number of positions held as a neuropsychologist and perceived unfairness/mistreatment by gender
As can be seen in , a majority of women (89.3%) and men (78.6%) have held one to three positions as a neuropsychologist. Fewer than one in five of the respondents reported experiencing perceived unfair treatment in the workplace, with women reporting slightly higher rates. Among individuals reporting mistreatment, men reported a much higher rate of general problems with administration or an employer. Women were much more likely to report having experienced abusive employers or colleagues, with sexism being the most common problem and much more frequently experienced by women. Problems related to unethical/exploitative practice environments and pay scale/salary were experienced relatively equally by approximately one in six to seven women and men. Among all respondents, reports of racism and cultural discrimination were infrequent. There were no significant gender differences in perceived unfairness or mistreatment associated with career stage.
Table 13. Career satisfaction: number of positions as a neuropsychologist and perceived unfairness or mistreatment.
Career satisfaction
examines career satisfaction relative to general work settings and professional identities.
Table 14. Career satisfaction: general work setting and professional identity.
Career satisfaction by gender
When examining the entire sample, women reported significantly lower income satisfaction, which is not surprising considering their incomes are significantly lower than men’s incomes. This was particularly relevant for ACP women who reported significantly lower income satisfaction than ACP men.
Career satisfaction by gender and career stage (not presented in tables)
There were no statistically significant main effects for gender. However, there were significant main effects for career stage for both income satisfaction and job satisfaction, F (2, 1134)=33.0, p<.001; F (2, 1135)=21.1, p=<.001, respectively, which revealed that ACPs (income: M = 82.2, SD = 18.9; job: M = 85.9, SD = 16.5) are significantly more satisfied than MCPs (income: M = 73.9, SD = 23.2; job: M = 78.4, SD = 19.6) and ECPs (income: M = 71.9, SD = 23.6; job: M = 78, SD = 19.1). The overall interaction between gender and career stage regarding work-life balance satisfaction was not significant, and there were no significant main effects.
Career satisfaction by gender, career stage, and work setting (not presented in tables)
Regarding career satisfaction ratings across work settings, there were no statistically significant interactions between gender and career stage for any of the three satisfactions, and there were also no statistically significant main effects for gender.
Career satisfaction by gender, career stage, and work setting: institution (not presented in tables)
There was no significant main effect for career stage.
Career satisfaction by gender, career stage, and work setting: private practice (not presented in tables)
With regard to private practice and income satisfaction, there was a significant main effect for career stage, F (2, 238)=9.9, p<.001, which revealed that ACPs (M = 84.9, SD = 18) are significantly more satisfied than MCPs (M = 69.4, SD = 30).
Career satisfaction by gender, career stage, and work setting: institution plus private practice (not presented in tables)
Regarding institution plus private practice settings and income satisfaction, there was a significant main effect for career stage, F (2, 247)=9.5, p<.001, which revealed that ACPs (M = 84.1, SD = 17.2) are significantly more satisfied than MCPs (M = 72.6, SD = 24.6) and ECPs (M = 71.2, SD = 24); the same significant results were found when examining institution plus private practice settings and job satisfaction.
Career satisfaction by gender, career stage, and professional identity
With regard to career satisfaction across professional identity, there were no statistically significant interactions between gender and career stage for any of the three satisfactions.
Career satisfaction by gender, career stage, and professional identity: adult neuropsychologists (not presented in tables)
Regarding income satisfaction and job satisfaction among adult neuropsychologists, there were significant main effects for career stage, F (2, 660)=8.6, p<.001; F (2, 663)=5.7, p=.004, respectively, which revealed that ACPs (income: M = 80.4, SD = 20.4; job: M = 83.1, SD = 18.9) are significantly more satisfied than ECPs (income: M = 71.9, SD = 23.6; job: M = 77.2, SD = 19.3). There was also a significant gender difference when examining income satisfaction among adult neuropsychologists, which revealed that women (M = 72.7, SD = 23.9) have significantly lower income satisfaction than men (M = 78.2, SD = 20.8), t = 3.1, p=.002, d = 0.2. There was a significant main effect for career stage and work-life balance satisfaction, F (2, 650)=6.0, p=.003, which revealed that ECPs (M = 75.3, SD = 22.7) are significantly more satisfied than ACPs (M = 67.8, SD = 26.1).
Career satisfaction by gender, career stage, and professional identity: pediatric neuropsychologists (not presented in tables)
Related to the identify of pediatric neuropsychologist, there was a significant main effect for career stage and job satisfaction, F (2, 226)=9.0, p<.001, which revealed that ACPs (M = 88.6, SD = 11.7) are significantly more satisfied than MCPs (M = 73.9, SD = 21.6).
Career satisfaction by gender, career stage, and professional identity: lifespan neuropsychologists (not presented in tables)
Finally, regarding income satisfaction and job satisfaction among lifespan neuropsychologists, there were significant main effects for career stage, F (2, 241)=15.1, p<.001; F (2, 240)=10.8, p<.001, respectively, which revealed that ACPs (income: M= 84.8, SD=16.2; job: M=90.1, SD=12.3) are significantly more satisfied than MCPs (income: M=69.1, SD=26.4; job: M=80, SD=20), and ECPs (income: M=69.5, SD=24.2; job: M=79, SD=21.3).
Career satisfaction by gender: personal/family and work environment obstacles by work setting
shows that across all three work settings, the greatest specific personal/family obstacle to attaining greater income satisfaction and job satisfaction is establishing and maintaining family life. Although consistently numerically higher for women in each instance, the differences are not statistically significant.
Table 15. Career satisfaction: personal/family and work environment obstacles within the last five years by general work setting.
Career satisfaction by gender: personal/family and work environment obstacles in institutions
Regarding income satisfaction in an institutional work setting, there were no statistically significant gender differences. Regarding job satisfaction in institutions, having a dual career family was identified by women as significantly more of an obstacle (69.8% vs. 41.3%; χ2[1] = 15.6, p=<.001), and more men than women identified “other” as being an obstacle (17.5% vs. 4.4%; χ2[1]=10.3, p=.004).
Career satisfaction by gender: personal/family and work environment obstacles in private practice
Within a private practice setting, with regard to attaining greater income satisfaction, significantly more women reported that there are aspects of personal or family life that create obstacles (30.7% vs. 15.4%; χ2[1] = 7.5, p=.006). There were no significant differences between women and men regarding obstacles related to job satisfaction.
Career satisfaction by gender: personal/family and work environment obstacles in institution plus private practice
For those who combine employment in an institution with private practice, significantly more women indicated that there are aspects of their work environment that create obstacles to attaining greater income satisfaction (68% vs. 47.4%; χ2[1]=10.4, p=.002). There were no statistically significant gender differences regarding obstacles related to job satisfaction.
Career satisfaction by gender: personal/family and work environment obstacles by work setting and career stage
Not shown in are data addressing the three career stages across general work settings.
Personal/family and work environment obstacles in institutions by career stage
Regarding employment in institutions, significantly more ECP women indicated that having a dual career family is an obstacle to attaining greater job satisfaction (70.3% vs. 39.4%; χ2[1]=10.2, p=.002). Significantly more ECP men than women identified “other” as being an obstacle to attaining greater job satisfaction (24.2% vs. 3%; χ2[1]=14.9, p=.001).
Personal/family and work environment obstacles in private practice by career stage
There were no significant differences between women and men in any of the three career stages who are employed in private practice settings.
Personal/family and work environment obstacles in institutions plus private practice by career stage
For respondents who combine employment in an institution with private practice, significantly more MCP women indicated that when they experience obstacles in their work environment that prevent greater job satisfaction, it is due to a hostile work environment (42.3% vs. 9.4%; χ2[1]=8.5, p=.005).
Career satisfaction: personal/family and work environment obstacles by professional identity
shows that within the last 5 years, across all three professional identities, the greatest specific personal/family obstacle to attaining greater income and job satisfaction is establishing and maintaining family life.
Table 16. Career satisfaction: personal/family and work environment obstacles within the last five years by professional identity.
Career satisfaction: personal/family and work environment obstacles of pediatric neuropsychologists
Regarding both types of satisfaction, significantly more male pediatric neuropsychologists indicated that major psychosocial stressors contribute to decreased satisfaction (income satisfaction: 37.5% vs. 3.6%; χ2[1]=14.5, p=.001; job satisfaction: 42.9% vs. 15.8%; χ2[1]=7.1, p=.008). Significantly more female pediatric neuropsychologists indicated that establishing and maintaining family life is an obstacle to attaining greater job satisfaction (86.8% vs. 61.9%; χ2[1]=6.8, p=.009). Female pediatric neuropsychologists also differed significantly from men with regard to frequency of reporting that a dual career family creates an obstacle to attaining greater job satisfaction (72.4% vs. 28.6%; χ2[1]=13.5, p=<.001).
Career satisfaction: personal/family and work environment obstacles of adult neuropsychologists
Among adult neuropsychologists, significantly more women indicated that there are obstacles present within their work environments that prevent them from attaining greater income satisfaction (61.7% vs. 48.2%; χ2[1]=13.5, p=.001). There were no statistically significant gender differences regarding job satisfaction.
Career satisfaction: personal/family and work environment obstacles of lifespan neuropsychologists
Among lifespan neuropsychologists, significantly more women indicated that aspects of their personal or family life create obstacles to attaining greater job satisfaction (33.9% vs. 18%; χ2[1]=10.8, p=.005). There were no statistically significant gender differences regarding income satisfaction.
Career satisfaction: personal/family and work environment obstacles by professional identity and career stage
Not shown in are data related to career stage across professional identities.
Personal/family and work environment obstacles of pediatric neuropsychologists by career stage
For pediatric neuropsychologists, regarding attaining greater job satisfaction, significantly more ECP women indicated that establishing and maintaining family life (94.1% vs. 57.1%; χ2[1]=9.1, p=.003), as well as having a dual career family (76.5% vs. 14.3%; χ2[1]=11.1, p=.001) are obstacles to attaining greater job satisfaction, relative to ECP men. Significantly more ECP men identified “other” as being an obstacle for attaining greater job satisfaction (42.9% vs. 2%, χ2[1]=16.0, p<.001). With regard to attaining greater income and job satisfaction, significantly more ECP men indicated that personal health is an obstacle (income satisfaction: 66.7% vs. 2.7%; χ2[1]=20.6, p<.001; job satisfaction: 71.4% vs. 17.6%; χ2[1]=9.7, p=.002).
Personal/family and work environment obstacles of adult neuropsychologists by career stage
Among adult neuropsychologists, significantly more ACP women reported that aspects of their personal or family life create obstacles to attaining greater income satisfaction (64% vs. 37.5%; χ2[1]=12.6, p<.001). Regarding job satisfaction, significantly more ECP men identified “other” as being an obstacle to attaining greater job satisfaction (20.6% vs. 1.6%; χ2[1]=10.2, p=.001). Significantly more MCP women indicated that when they experience obstacles in their work environment, the effect on job satisfaction is due to a hostile work environment (28.8% vs. 8%; χ2[1]=7.9, p=.005).
Personal/family and work environment obstacles of lifespan neuropsychologists by career stage
Related to lifespan practitioners and career stage, there were no significant gender differences across career stages regarding either satisfaction.
Part 2: Ethnic/racial diversity results
Characteristics of the 2020 sample by ethnic/racial diversity: age and years in practice
shows age and years in practice of the different ethnic/racial groups. Men (M=51.5, SD=12.6) are significantly older than women (M=43.2, SD=10) across all ethnic/racial groups. Individuals who Chose not to disclose ethnicity/race (M=53.2, SD=11.3) are significantly older than African American/Black (M=41.5, SD=8.8), Asian or Pacific Islander (M=40.7, SD=7.1), Hispanic/Latino(a) (M=43.3, SD =11.5), and Biracial/Multiethnic/Multiracial (M=41.9, SD=10.2) individuals; Whites (M=47.2, SD=12) are significantly older than the Asian or Pacific Islander group, F (6, 1646)=8.8, p<.001. Regarding years in practice, men (M=19.1, SD=12.7) have been in practice significantly longer than women (M=10.9, SD=9.2) across all ethnic/racial groups. Individuals who Chose not to disclose ethnicity/race (M=19.6, SD=13.1) have been in practice significantly longer than Asian or Pacific Islander (M=7.7, SD=6.2), Hispanic/Latino(a) (M=10.3, SD=10.3), and Biracial/Multiethnic/Multiracial (M=9.7, SD=10.1) individuals; Whites (M=14.9, SD=11.6) have been in practice significantly longer than the Asian or Pacific Islander group, F (6, 1552)=9.3, p<.001.
Table 17. Age and years in practice by ethnicity/race.
Characteristics of the 2020 sample by ethnic/racial diversity: highest degree, work environment, and work status
examines the highest degree, work environment, and work status of the various ethnic/racial groups. Across all groups, an overwhelmingly large percentage of individuals have attained a Ph.D. (percentages across groups range from 68 to 81%), rather than a Psy.D. (percentages range from 14 to 32%). Similarly, an overwhelming majority of respondents practice in urban settings (percentages range from 80 to 91.7%), followed by individuals who practice in both urban and rural settings (percentages range from 6.5 to 20%), and those who practice solely in rural settings (percentages range from zero to 7.7%). Across all ethnic/racial groups, most individuals work full-time (percentages range from 75 to 87.8%), followed by full-time plus part-time (percentages range from 6.8 to 15%), and those who hold only part-time jobs (percentages range from zero to 10%).
Table 18. Degree, work environment, and work status by ethnicity/race.
Characteristics of the 2020 sample by ethnic/racial diversity: career stage, professional identity, and practice environment
examines the career stage, professional identity, and practice environment of the various ethnic/racial groups, excluding the two individuals in the American Indian/Alaskan Native group. The majority of the members of the remaining four ethnic/racial minority groups depicted in the table have entered the field of neuropsychology relatively recently and are still in the “early” career phase (percentages range from 56 to 62.9%), a pattern not seen for White neuropsychologists (42.3%) and those who Chose not to disclose ethnicity/race (19.5%). White neuropsychologists and those who Chose not to disclose ethnicity/race are more likely to be in the middle or end phases of their careers. Regarding professional identity, adult practitioners predominate, especially within the African American/Black (70%) and Asian or Pacific Islander (62.1%) groups. The Hispanic/Latino(a) group has a much higher percentage of pediatric practitioners (34.5%) compared to the other five groups (percentages range from 14.8 to 22.6%). The Chose not to disclose ethnicity/race group (35.5%) is more heavily represented by lifespan neuropsychologists than the other ethnic/racial groups (percentages range from 14.5 to 29.6%). Apart from those in the Chose not to disclose ethnicity/race group (29%), most individuals in the remaining five groups, including African American/Black, Asian or Pacific Islander, Hispanic/Latino(a), Biracial/Multiethnic/Multiracial, and White, practice primarily in institutions (percentages range from 54.5 to 75%). Again, with the exception of those in the Chose not to disclose ethnicity/race group, those in the remaining five ethnic/racial groups depicted split their time approximately evenly between private practice and institution plus private practice settings.
Table 19. Career stage, professional identity, and practice environment by ethnicity/race.
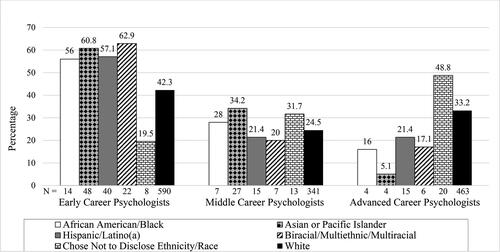
shows career stage by ethnicity/race, excluding the two individuals in the American Indian/Alaskan Native group. In the other four ethnic/racial minority groups, including African American/Black, Asian or Pacific Islander, Hispanic/Latino(a), and Biracial/Multiethnic/Multiracial, the vast majority of members are early in their careers, followed by MCPs and ACPs, respectively. The reverse is true for those in the Chose not to disclose ethnicity/race group who are primarily ACPs, followed by MCPs and ECPs, respectively. Finally, although the highest percentage of the White group is in the ECP stage, compared to the ethnic/racial minority groups, a much larger percentage of the White group is in the ACP stage.
Figure 4. Career stage by ethnicity/race. Note. Analyses do not include the two individuals who identified as American Indian/Alaskan Native; excludes those who indicated they are not neuropsychologists. Some percentages do not total 100% due to rounding.
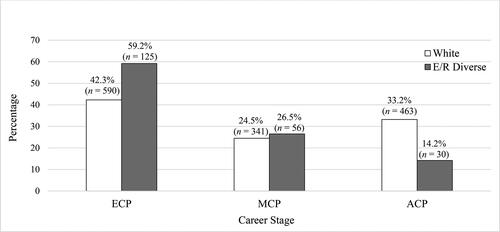
Characteristics of the 2020 sample by ethnic/racial diversity: percentage comparisons of White and ethnic/racial minority groups across career stage
shows percentages of respondents who are either White or in one of the five ethnic/racial minority groups across the three career stages. Individuals who identify as being ethnic/racial minority members are primarily ECPs, followed by MCPs and ACPs, respectively. Though many Whites are also early in their careers, the percentage is much smaller compared to the ethnic/racial minority groups. Within the White group, ACPs are the second-largest career stage group, followed by MCPs.
Figure 5. Percentage comparisons of White and ethnic/racial minority groups across career stage. Note. Those in the Chose not to disclose ethnicity/race group were not included in these analyses. Analyses include individuals from all five ethnic/racial minority groups; excludes those who indicated they are not neuropsychologists. ECP = Early Career Psychologist; MCP = Middle Career Psychologist; ACP = Advanced Career Psychologist; E/R diverse = Ethnically/Racially Diverse. Some percentages do not total 100% due to rounding.
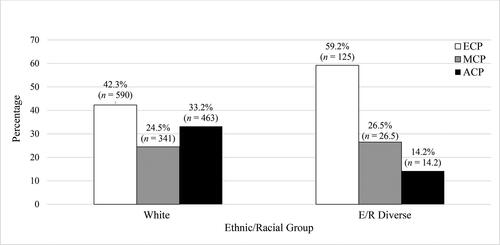
Characteristics of the 2020 sample by ethnic/racial diversity: percentage comparisons of ethnic/racial groups within each career stage
shows an alternative way of viewing the information presented in by examining the percentage of respondents who are either White or in one of the five ethnic/racial minority groups within each career stage. Similar to , a majority of ethnic/racial minority individuals are ECPs, followed by MCPs and ACPs, respectively. Within the White group, ECPs dominate, followed by ACPs and MCPs, respectively.
Figure 6. Percentage comparisons of White and ethnic/racial minority groups within each career stage. Note. Those in the Chose not to disclose ethnicity/race group were not included in these analyses. Analyses include individuals from all five ethnic/racial minority groups; excludes those who indicated they are not neuropsychologists. ECP = Early Career Psychologist; MCP = Middle Career Psychologist; ACP = Advanced Career Psychologist; E/R diverse = Ethnically/Racially Diverse. Some percentages do not total 100% due to rounding.
Scholarly activities by ethnicity and race
Scholarly activities by ethnicity/race are reported in . Overall, the publication counts range from 5.9 (Biracial/Multiethnic/Multiracial group) to 18.3 (White group). All groups appear to be producing high numbers of conference presentations, ranging from 16.2 (Biracial/Multiethnic/Multiracial) to 27.2 (White).
Table 20. Scholarly activities: peer-reviewed publications and conference presentations by ethnicity/race.
Income by ethnicity and race
shows salaries by ethnic/racial group. Although the range of reported values appears substantial, there were no statistically significant group differences.
Table 21. Salary by ethnicity/race.
Perceived unfairness/mistreatment by ethnicity/race and gender
examines unfairness/mistreatment by ethnicity/race and gender. Although not statistically significant, a higher number of minority women than minority men have changed jobs related to perceived unfairness or some type of mistreatment. The two primary reasons that women and men have left jobs involve unethical/exploitative practice environments and problems with administration/employer.
Table 22. Career satisfaction: perceived unfairness or mistreatment by ethnicity/race.
Career satisfaction by ethnicity and race
examines income, job, and work-life balance satisfaction ratings among the various ethnic/racial groups, excluding the two individuals who identify as American Indian/Alaskan Native. Although none of the career satisfaction ratings are significantly different between the groups, individuals who identify as African American/Black (M=85.8, SD=11.9) reported an appreciably higher income satisfaction compared to the other groups (i.e. mid-80s vs. mid-70s). Those in the Chose not to disclose ethnicity/race group and African Americans/Blacks reported low job satisfaction (M=72.9, SD=24.7; M=73.1, SD=29.1, respectively) compared to the other groups (percentages range from 78.8 to 81.6%). Work-life balance satisfaction ratings are consistently lower than income and job satisfaction ratings for all groups but are particularly low for those in the Chose not to disclose ethnicity/race group (M=57.3, SD=29.6) and the Biracial/Multiethnic/Multiracial group (M=61.4, SD=29), and are highest for those who identify as Asian or Pacific Islander (M=74.3, SD=23.2).
Table 23. Career satisfaction by ethnicity/race.
Obstacles to career satisfaction by ethnicity and race
Responses pertaining to personal/family and work environment obstacles within the last 5 years by ethnicity/race are presented in .
Table 24. Career satisfaction: personal/family and work environment obstacles within the last five years by ethnicity/race.
Obstacles to career satisfaction by ethnicity and race: income satisfaction
Regarding income satisfaction and personal/family obstacles, establishing and maintaining family life is the number one obstacle endorsed by every group (percentages range from 55.6 to 80%), with the exception of individuals in the Hispanic/Latino(a) group who rated this obstacle as being equally as challenging as having a dual career family (both 55.6%). Maintaining a dual-career family is rated as the second-largest obstacle to attaining income satisfaction for those who identify as White (52.6%), Asian or Pacific Islander (53.3%), Biracial/Multiethnic/Multiracial (57.1%), and African American/Black (60%). Those in the Chose not to disclose ethnicity/race group reported personal health and family members’ health (both 44.4%) as being tied for the second most problematic obstacle for attaining greater income satisfaction. All groups have a near majority or greater number of members who reported experiencing obstacles in their work life that create lower-income satisfaction (percentages range from 47.4 to 65.2%). However, only those in the African American/Black group reported a substantially higher level of hostility within their workplace (44.4%); the percentages for the other five groups ranged from zero to 12%.
Obstacles to career satisfaction by ethnicity and race: job satisfaction
Regarding job satisfaction, with the exception of those in the Chose not to disclose ethnicity/race group who reported that establishing and maintaining family life and personal health are equally difficult (both 71.4%), every group indicated that establishing and maintaining family life is the number one obstacle (percentages range from 71.4 to 100%), followed by having a dual career family for White (59.5%), Asian or Pacific Islander (62.5%), Hispanic/Latino(a) (64.3%), and Biracial/Multiethnic/Multiracial (71.4%). African Americans/Blacks ranked personal health and family members’ health as being tied for the second most challenging obstacle (both 66.7%) to attaining greater job satisfaction. It appears that for all groups, work environment obstacles are more problematic with regard to job satisfaction than income satisfaction (percentages range from 67.7 to 76.9%). As was the case with income satisfaction obstacles, individuals in the African American/Black group reported high levels of hostility within the workplace (57.1%), compared to the other five groups (percentages range from 5.3 to 25.6%).
Discussion
Large-scale survey data can be used to provide summaries and insights into two of the timeliest topics related to careers in clinical neuropsychology. The status of women practitioners has received increasing attention, which is understandable and appropriate given that, at present, approximately 60% of all respondents are women, and 53.8% of these women are early career entrants. This current over-representation of women, which is increasing across time, has numerous implications. Our second focus pertaining to survey data addresses a topic that can be viewed as nearly the opposite in terms of sheer numbers of under-representation in the form of ethnic/racial diversity, a topic of equal or greater interest that is heightened by recent US events pertaining to racism and social justice. When subsets of survey respondents in the various ethnic/racial minority groups were under-represented (e.g. a response rate less than 10%), detailed analyses may have been limited or even precluded. For this reason, some important questions related to differences among the various ethnic/racial groups were difficult to address (e.g. board certification by ethnicity/race, academic rank and position titles in institutions by ethnicity/race, hourly fees by ethnicity/race, forensic activities by ethnicity/race). We will discuss the findings related to gender and ethnic/racial diversity separately.
Gender
Gender: overall sample characteristics
Based on survey data collected in 2010 (Sweet et al., Citation2011), women neuropsychologists were noted to have become the majority. The size of that majority is increasing over time, which is consistent with national trends in education. According to the National Center for Education Statistics, the majority of bachelors, masters, and doctoral-level degrees conferred by postsecondary institutions are awarded to women, regardless of the field of study. When examining the discipline of psychology as a whole, approximately 78.9% of bachelor’s degrees, 80.2% of master’s degrees, and 73.7% of doctoral degrees are awarded to women (U.S. Department of Education et al., Citation2019).
Within the field of neuropsychology, the prototypical neuropsychologist tends to be a White, middle-aged woman who is employed full-time, providing services to adults in an institution. Importantly, there is a significant difference in age and years in practice between female and male neuropsychologists – women are approximately six and a half years younger, and they have also been in practice approximately six and a half fewer years than men. A majority of women and men in the overall sample identify as adult practitioners, 55.8% and 62.1%, respectively, and are working full-time or more. Interestingly, 80% of pediatric neuropsychologists are women, which mirrors a decades-long over-representation of female psychologists in U.S. primary education systems (American Psychological Association [APA], Committee on Women in Psychology, Citation2017). According to the Bureau of Labor Statistics, in 2019, the second most common position held by a woman was as a teacher in an elementary or middle school setting (Bureau of Labor Statistics, Citation2020a); these trends also appear in educational systems across the world (Drudy, Citation2008). Future surveys of pediatric neuropsychologists may find relevant questions pertaining to career choice to be informative. At some point, if trends continue, male pediatric neuropsychologists may become a rarity.
The percentage of individuals who identify as adult neuropsychologists has remained relatively stable across time, whereas the percentage of individuals who identify as pediatric neuropsychologists has increased, and the percentage of individuals who identify as lifespan neuropsychologists has decreased. Given these trends, it appears that some lifespan neuropsychologists may have transitioned to pediatric neuropsychology. It also appears that as younger professionals are entering the field, they opt to specialize in either adult or pediatric neuropsychology. Finally, as lifespan neuropsychologists are primarily older men, it is very likely that as these professionals retire, the number of lifespan neuropsychologists will continue to decrease over time.
Both women and men tend to work in institutions on a full-time basis. While some women work in private practice (either solely in private practice or in an institution plus private practice setting), a much larger percentage of men can be found performing private practice work. It is unclear why more men gravitate toward private practice than women, especially in their early and middle careers, but perhaps job security, with known benefits, is more important for women during child-raising years. ACP women outnumber ACP men in exclusively private practice settings.
Gender: academic rank and position titles
Gender differences can also be seen when examining academic rank and position titles within institutional settings. Although similar percentages of women and men hold academic titles (approximately 63% of those working in institutional settings), women hold the title of assistant professor and “other” more often than men, whereas men hold the title of professor more often than women. Interestingly, in 2015, men held the title of associate professor more often than women, which is a title held almost equally by women and men as of 2020. One might envision that in the 2025 version of the salary survey, approximately equal percentages of women and men will hold the title of professor. Women are more likely to hold institution position titles of staff neuropsychologist/psychologist, as well as clinical training director, and they are less likely to hold administrative titles of Division Head and some form of Chair (e.g. assistant, associate, vice, department).
Sachs et al. (Citation2018) examined historical perspectives, present trends, and future directions of women’s leadership in neuropsychology. In this study, there were relatively equal numbers of women and men who were members of the Society for Clinical Neuropsychology, Division 40 of the APA and the National Academy of Neuropsychology. The number of women who were board certified by ABPP/ABCN, and those who served as directors of internship and postdoctoral training programs were similar to the relative proportion of women in neuropsychology. Increasing numbers of women were identified as serving on the board of directors for the American Academy of Clinical Neuropsychology and the International Neuropsychology Society. Gender disparities were found regarding the proportion of women who had been elected and appointed to upper-level leadership positions in neuropsychological organizations and on editorial boards.
Gender: scholarly productivity
Scholarly activities vary by gender, with men producing a greater number of conference presentations and peer-reviewed publications during their careers. As represented by current ACPs, by the end of one’s career, men have been significantly more productive in these scholarly activities than women. Although female and male funded researchers reported engaging in approximately the same number of funded research hours per week, men were again more productive. These findings mirror those of other academic career settings (e.g. academic medicine: Raj et al., Citation2016; academic surgery: Mueller et al., Citation2017). However, in this study, because current ECPs and MCPs do not differ in scholarly productivity, perhaps by 2025, the interim effect of cohort retirement may result in more similar ACP scholarly productivity.
Recent relevant publications offer a compatible viewpoint of change across time. For example, within psychology, a gender publication’s gap persists in most subfields, although reducing over time (Odic & Wojcik, Citation2020). Specifically, within neuropsychology, Matchanova et al. (Citation2020) examined gender disparities in authorship trends from 1985 to 2019 across six widely read journals in clinical neuropsychology. Despite women being under-represented as authors across the six neuropsychology journals, the rate at which they published articles across time increased, and their articles were cited as frequently as men’s. In a study conducted by Rohling et al. (Citation2022), examining gender trends over five decades, in the 40 years prior to 2008, women attained less research productivity than men. The opposite was true for the youngest cohort, which slightly favored women, suggesting there may be a trend within neuropsychology toward gender equality regarding research productivity.
McCutcheon and Morrison (Citation2016) examined potential barriers to research productivity reported by women faculty, finding that regardless of parental status, women had significantly lower research output than men. One possibility is that men choose specialties that have greater rates of research output. Also, parental status may not be significant because these authors did not investigate the age of children, with young children being more burdensome of time. Notably, mothers spent significantly more time on childcare, and reported significantly more work-family conflict than men. The McCutcheon study found no significant differences between women and men regarding number of hours spent on housework and workplace tasks. While this study did not examine specific obstacles preventing women and men from producing higher rates of scholarly work, it seems intuitive that establishing and maintaining family life not only has a negative impact on attaining greater income and job satisfaction, but also likely carries over to other areas of one’s professional life (e.g. having adequate time to conduct research and publish findings).
Gender: board certification
Based on 2020 survey data, ECP and MCP women have attained ABCN board certification at higher rates than their male counterparts, and ECP and MCP women who have not yet attained ABCN board certification appear to have a higher interest in completing the process than men. Despite having a higher interest, and within a broad context of high support for and pursuit of board certification, women reported more obstacles to attaining board certification, which include prohibitive time commitment and cost. This is especially true of women who are early in their careers. ACP men have attained a higher rate of board certification than early and mid-career men, as well as women in any of the three career stages. This undoubtedly reflects the fact that in 2005 and earlier, there were more men in the field of neuropsychology than women.
Gender: the income gap
Excluding part-time workers, the gender income gap was significant in general, as well as when broken down by identity or work setting in the direction of women earning less money. Among the many mean and median income listings, whether statistically significant or not, the dollar values are nearly all lower for women.
The phenomenon of women earning less than men is not unique to the field of neuropsychology. The gender income gap is pervasive, and it is found in almost all professions. According to the Bureau of Labor Statistics, in 2019, women who were full-time wage and salary workers had median usual weekly earnings that were 82 percent of the earnings of male full-time wage and salary workers. The gender income gap can also be found in all states of the United States (Bureau of Labor Statistics, Citation2020a), and internationally. According to the Organization for Economic Co-operation and Development (OECD), as of 2019, women in all 37 countries that compose the OECD earned less than their male counterparts (the income gap ranged from 4.86% (Denmark) to 32.5% (Korea) (Szmigiera, Citation2021).
There has been great interest and research investment regarding understanding the gender income gap. Converging lines of evidence indicate that one of the primary factors is establishing and maintaining family life. According to the Bureau of Labor Statistics, in 2017, married women with a spouse present and married women with a spouse present with children under 18 earned 78.5% and 79.2% of men’s median income, respectively. Women who were single (e.g. never married, divorced, separated, or widowed) with no children under 18 made 94.2% of men’s median income. Women ages 16-24 and women who were single and never married earned 91.2% and 91.3% of men’s median weekly income, respectively (Bureau of Labor Statistics, Citation2018). Multiple international studies have supported the hypothesis that the burden of establishing and maintaining family life is disproportionally placed on women and has a significant negative effect on income (e.g. Kleven et al., Citation2019).
Specific to neuropsychology, many more women are employed in an institution, at all stages of their careers, rather than in private practice or in an institution plus private practice setting, where the potential to earn a higher salary has consistently been found to be greater. When examining the annual mean salary of sole proprietors of a private practice, there are approximately equal numbers of women and men in this role. Of those who devote at least 80% of their time to performing clinical and forensic evaluations, women earn significantly less annually than men by almost $134,000. An almost identical pattern is found for those who identify as partners in a private practice. However, women are less likely to be partners and more likely to be employees in a private practice, earning much less than sole proprietors or partners. Moreover, collapsing across all work settings, male neuropsychologists are more likely to hold full-time employment plus a part-time position, thus likely earning a larger mean annual salary than women who do not augment full-time employment. This finding is consistent with that of Harvard economist Claudia Goldin (Citation2014) who believes that a portion of the gender income gap stems from men investing a greater number of additional work hours beyond those defined as full-time.
Finally, what explains the fact that female neuropsychology private practice owners earn less money? In our sample, there is not a statistically significant difference in the number of work hours between male and female sole proprietors. Researchers who study venture capital funding have found that there is a gender income gap among entrepreneurs regarding the salaries women and men choose to pay themselves, with women paying themselves 77% relative to male counterparts (Gonzalez, Citation2018). Possibly related, in a series of experiments, Exley and Kessler (Citation2019) found that women subjectively describe their abilities and performances to potential employers less favorably than their similarly achieving male counterparts. In other words, women may perceive that they are worth less than their male counterparts, which, in the instance of neuropsychologists, can be reflected in their billing schedules (e.g. female neuropsychologists charge significantly less per forensic work hour). As noted previously with regard to the entire survey sample, given that sole proprietors determine their own income through billable activities and control of expenses, there may also be a gender-based differential of additional work hours among solo private practitioners.
Gender: career satisfaction
Women have lower income satisfaction than men, which is not surprising considering they are earning significantly less than men. Income satisfaction is lowest for women with the identity of adult practitioner relative to pediatric and lifespan practitioners. Related to income satisfaction and job satisfaction, overall ratings of personal/family obstacles are generally comparable for women and men, with the number one obstacle being establishing and maintaining family life, followed by being part of a dual career household, regardless of work setting or professional identity. Generally speaking, although a relatively large percentage of individuals report obstacles in their work environments that are preventing them from attaining greater income and job satisfaction, with the exception of women who work in an institution plus private practice setting, few women and men are reporting that this is due to a hostile work environment. Not surprisingly, those who are experiencing hostile work environments are experiencing greater job dissatisfaction than income dissatisfaction.
Diversity
Diversity: overall sample characteristics, career satisfaction, and perceived unfairness/mistreatment
Of all respondents who answered the question regarding ethnicity/race, 12.9% of the sample was comprised individuals from one of the five ethnic/racial minority groups, including African American/Black, American Indian/Alaskan Native, Asian or Pacific Islander, Hispanic/Latino(a), or Biracial/Multiethnic/Multiracial. Looking specifically at the percentage of ethnic/racial minorities within the three career stages over time, one of the most exciting findings we see is that within the last 15 years, the influx of ethnic/racial minority individuals into the field has substantially increased. Of all respondents, approximately 59% of ethnic/racial minorities are in the early career stage. As more individuals from ethnic/racial minority groups have entered the field of clinical neuropsychology, the ratio of White practitioners and White postdoctoral residents to practitioners and postdoctoral residents in ethnic/racial minority groups has changed, causing the percentage of White individuals to decrease (Sweet et al., Citation2021a, Citation2021b). In particular, individuals who identify as either Asian or Pacific Islander or Hispanic/Latino(a) are entering the field of clinical neuropsychology at increasing numbers, compared to African Americans/Blacks, American Indians/Alaskan Natives, and Biracial/Multiethnic/Multiracial individuals. Overall, given the steady influx of ethnic/racial minorities into the field in the last 15 years, this pattern is promising and is very likely to continue over time.
When examining career satisfaction, those who identify as African American/Black report the lowest job satisfaction of any of the ethnic/racial minority groups, which may, in part, be related to the high rates of hostility they report within their workplace. Specifically, the rate at which African Americans/Blacks report dissatisfaction within their workplace, which they attribute to a hostile work environment, is more than double that of the next highest ethnic/racial minority group. Conversely, African Americans/Blacks report the highest income satisfaction of any of the ethnic/racial minority groups. Similar to the entire 2020 sample, the number one obstacle to attaining greater income and job satisfaction is almost always establishing and maintaining family life for all ethnic/racial minority groups.
With regard to discrimination in the workplace, approximately one in five individuals have left a job because of perceived unfairness or some type of mistreatment. Very few women and no men reported leaving a position because they experienced discrimination. Most individuals left because of problems with their administration/employer or because they perceived working in an unethical/exploitative practice environment.
Diversity: income
Although the annual mean salary was not significantly different between any of the ethnic/racial groups, Hispanic/Latino(a) and White neuropsychologists reported earning approximately $32,000–$43,000 and $25,000–$36,000 more than those who identify as African American/Black, Asian or Pacific Islander, and Biracial/Multiethnic/Multiracial. This is not unlike the discipline of medicine in which there are substantial differences in incomes between women and men, and also substantial differences in incomes between White physicians and ethnic/racial minority physicians. In 2018, the difference in salaries between White and African American U.S. physicians was approximately $50,000, favoring White physicians (Larkin, Citation2018). According to the Bureau of Labor Statistics, national data on all individuals who identified as Hispanic or Black earned considerably less than Asians and Whites. Asian men earned the highest median weekly salary, followed by White, Hispanic, and Black men (78%, 58%, and 56%, respectively, of the earnings of Asian men). A similar pattern was found for women – White, Black, and Hispanic women earned 82%, 69%, and 63%, respectively, of the earnings of Asian women. This may be due, in part, to Asian and White individuals attaining higher levels of education. Among individuals 25 years and older, Asians were the most likely of the groups to hold a bachelor’s degree or higher (65%), followed by 41% of Whites, 32% of Blacks, and 22% of Hispanics (Bureau of Labor Statistics, Citation2020b).
Final comments
Regarding gender, the topic that has predominated in this article, there is little more to say than that there are obvious implications for women who strive to balance time- and energy-consuming professional career challenges with establishing and maintaining family life, the latter of which, according to experts from various disciplines, continues to fall disproportionately to women. Readers are referred to the excellent review and recommendations specifically pertaining to attaining work-life balance as a clinical neuropsychologist (Feigon et al., Citation2018). Also, the history of seminal events related to women’s legal rights in the U.S. and the “herstory” of women in psychology is an informative treatise from the APA, Committee on Women in Psychology (Citation2017).
Regarding ethnicity/race, building upon prior works within neuropsychology to promote accurate multicultural assessment (e.g. Byrd et al., Citation2008; Romero et al., Citation2009; Byrd et al., Citation2010; Rivera Mindt et al., Citation2010; Aghvinian et al., Citation2021; Franzen et al., Citation2021), since 2015, AACN’s Relevance 2050 initiative has promoted the critical importance of keeping pace with the changing diversity of the U.S. population. Diversity issues have amplified considerably and have sharpened in focus for the specialty of clinical neuropsychology in the last two years, almost entirely because of widely publicized events within the U.S that have underscored social injustice, racism, and violence toward citizens who are black, indigenous, and people of color (BIPOC). There are two very different neuropsychological practice perspectives related to diversity: (1) factors related to patient care (normative data, brain-behavior relationships, and assessment strategies), and (2) ethnicity/race of practitioners. Both are critically important to the future of the specialty.
With regard to the perspective of patient care, the factors worthy of consideration are numerous and multifaceted. The availability and application of appropriate normative data appear to be the most salient factor, and as such, has been receiving the bulk of attention in published literature. In fact, prior survey data indicated that approximately two-thirds of U.S. and Canadian practicing neuropsychologists perceived their greatest challenge in assessing ethnic/racial minority patients to be lack of appropriate normative data (Elbulok-Charcape et al., Citation2014). In their roles as co-editors of TCN’s Department of Culture and Gender in Neuropsychology, Hilsabeck and Rivera Mindt (Citation2021) inventoried the recent contents of TCN, reporting that in 2020, of ten relevant articles, 60% addressed normative testing values related to cultural and linguistic diversity. These published contents in 2020 resembled the TCN contents of 2019, when 55% of diversity articles reported normative data. The issue of having appropriate normative data available to neuropsychology practitioners might be understated if only referred to as broadly relevant to patients who are BIPOC. More explicitly, the selection of appropriate normative data requires much greater attention to language(s) and language competence, education and its comparability to the requirements (most often U.S.-based education) of an individual test, cultural/multicultural background broadly and specifically regarding an understanding and comfort level with formal evaluation processes, and ethnicity/race (see Fujii, Citation2018 for review and recommendations). Readers are also referred to the comprehensive textbook edited by Irani (Citation2022), for detailed review of these and other relevant topics from multiple international practice perspectives, as well as examples of applications using very specific international normative data.
Beyond the increasing attention and professional energy invested in producing and applying normative data that match up to the diversity of patients, there is also increasing attention being given to diversity-related underlying health and brain conditions, such as differential predictors of Alzheimer’s disease and cognitive decline (Johnson et al., Citation2022), incidental brain MRI findings in the Hispanic/Latino(a) population (Ivanovic et al., Citation2021), and prevalence of depression due to cerebrovascular disease (Bogoian & Dotson, Citation2022). And, more broadly, long-held traditional assessment strategies are being reconsidered to reflect that (1) test instruments may contain insensitive stimuli or questions (e.g. Salo et al., Citation2022), (2) prior experience with racism may affect symptom reporting (e.g. Hill-Jarrett & Jones, Citation2022), and (3) prior negative examination experience or lack of formal examination experience among BIPOC patients may produce “stereotype threat” that negatively impacts test results (see VanLandingham et al., Citation2022 for review and recommended strategies).
Regarding the second perspective related to ethnic/racial diversity of practitioners themselves, neuropsychologists find themselves considering that we may or may not reflect the increasingly diverse ethnic/racial mix of our patients. Questions regarding the status and trajectory of neuropsychology’s ethnic/racial identity require more than comparisons within our specialty across time, which we have now updated. Overall, the percentage of White respondents has declined from 92.9% in 2005 to 84.5% in 2020 (Sweet et al., Citation2021b).
Comparisons to the broader discipline of psychology and to U.S. citizenry may also be instructive. In the latest available data that include diversity information (APA, Committee on Women in Psychology, Citation2017), of 79,000 APA members, approximately 65% were women and approximately 15% belonged to ethnic/racial minority groups. By comparison to the overall 2020 neuropsychology survey data, 60% of respondents are women and 12.9% are members of ethnic/racial minority groups. Readers will note that the numbers provided by APA are not that discrepant from our specialty data. However, the most appropriate comparisons would be specifically to individuals soon to enter the specialty from postdoctoral training programs and early career practitioners, as the composition of these cohorts provides an up-to-date view of neuropsychology’s current ethnic/racial diversity. The APA’s Committee on Women in Psychology (Citation2017) estimated that there are approximately 3000 psychology doctorates awarded each year to individuals who provide some form of health service. Approximately 74% of these new doctoral-level psychology practitioners are women and approximately 22% belong to ethnic/racial minority groups. Among clinical neuropsychology postdoctoral trainees, in 2020, approximately 23% belonged to ethnic/racial minority groups (Sweet et al., Citation2021a). Additionally, suggesting an accumulation of change, in 2020, among ECP respondents, 72.3% are women, and of all ethnic/racial minority survey respondents, approximately 59% are ECPs.
Although neuropsychology specialty data and broader discipline data from APA are relatively comparable, both are distinctly different from U.S. census data. A comparison between U.S. census data and neuropsychology specialty data indicates that White neuropsychologists are over-represented (61.6% vs. 84.5%, respectively), whereas individuals in all ethnic/racial groups are under-represented (e.g. the Black or African American U.S. population is 12.4% (vs. 1.5%), the American Indian/Alaskan Native U.S. population is 1.1% (vs. 0.1%), the Asian U.S. population is 6% (vs. 4.7%), the Hispanic or Latino U.S. population is 18.7% (vs. 4.5%), and the Multiracial U.S. population is 10.2% (vs. 2.1%) (Jones et al., Citation2021). It is important to note that a comparison between neuropsychology specialty data and U.S. census data proves difficult due to the small sample sizes of the ethnic/racial minority groups in the present sample. In addition, U.S. census relabeling of categories and U.S. census-taker changes in self-identification preferences also make comparisons across ethnic/racial minority groups in the present sample and those in the U.S. census challenging. However, despite these caveats, for the moment, and likely for foreseeable years to come, clinical neuropsychologists as a group do not appear to resemble their U.S. patient base.
Impact of the COVID-19 pandemic on women and ethnic/racial minority individuals
While the negative effects of the pandemic have been widespread, they have been more prevalent for women and ethnic/racial minorities. According to the U.S. Labor of Bureau Statistics, the COVID-19 recession has been more challenging for women than men. One reason women have experienced greater hardship is that they are more likely to work in industries that have been affected most by the pandemic (e.g. restaurants and other retail establishments, hospitality, and health care). Second, compared to men, when schools and daycares around the country closed, women acquired childcare responsibilities at disproportionate rates. Third, fewer women than men have jobs that allow them to telecommute, 22% and 28%, respectively. Finally, in situations where both spouses are employed full-time, mothers provide approximately 60% of the childcare (Karageorge, Citation2020).
Certain ethnic/racial minority members have also experienced greater hardship during the pandemic, compared to their White counterparts. The disproportionate effects may relate to the long-standing inequalities in education, employment, housing, and health care that the global pandemic has exacerbated. The Center on Budget and Policy Priorities continually tracks the effects the global pandemic has had on individuals’ abilities to attain food, housing, and employment. Updated data as of 10 September 2021 (see https://www.cbpp.org/research/poverty-and-inequality/tracking-the-covid-19-economys-effects-on-food-housing-and), suggest that Black and Latino adults were more than twice as likely as White adults to report that their household sometimes or often did not have enough food to eat in the last seven days, and taken together, adults who identify as American Indian, Alaskan Native, Native Hawaiian, Pacific Islander, or multiracial were twice as likely as White adults to report their household did not have enough to eat. Compared to 10% of Whites, 22% of Blacks, 19% of Asians, 18% of Latinos, and 18% of the combined group comprised of American Indian, Alaskan Native, Native Hawaiian, Pacific Islander, or multiracial individuals, were behind paying their rent. When examining the difficulty adults have covering their expenses, compared to 22% of Whites and Asian adults, the rates were higher for Black (41%), Latino (37%), and adults who identify as American Indian, Alaskan Native, Native Hawaiian, Pacific Islander, or multiracial, taken together (34%). The data on unemployment also show disproportionate rates between ethnic/racial minority individuals and Whites. Specifically, 8.8% of Black and 6.4% of Latino workers are unemployed, compared to 4.5% of Whites, and workers who were born outside of the U.S., including individuals who are now U.S. citizens, have experienced larger job losses than U.S.-born workers (Center on Budget and Policy Priorities, Citation2021).
In this study, 82.6% of respondents completed the survey prior to the official declaration in the U.S. of the COVID-19 pandemic. The annual psychology incomes reported in 2020 were unaffected by the pandemic, as they reflected income from 2019 (Sweet et al., Citation2021b). The 2025 neuropsychology professional practice and “salary survey” will have the opportunity to capture the unique effects the pandemic has had on all individuals, including women and ethnic/racial minority groups, with the expectation that some of the national trends reported above may be mirrored in the answers provided by respondents or, by then, hopefully resolved.
Limitations and future directions
We acknowledge that this study has some limitations. First, there are inherent limitations of conducting survey research that relies on self-report. These include respondents having difficulty assessing themselves accurately, resulting in biased responding; interpreting questions in an idiosyncratic manner; providing socially acceptable answers, rather than being fully forthcoming; encountering survey fatigue; not fully reading questions before responding; and leaving questions unanswered. Second, those who opt to complete surveys may have different qualities and characteristics than those who elect not to complete surveys. Third, those who identify as ethnic/racial minority neuropsychologists represented a much smaller number of individuals than those who identify as White, limiting the number of comparisons that could be made between groups (e.g. some analyses that examined differences between women and men could not be conducted with the various ethnic/racial groups because the group sizes were too small).
Finally, although we have tried to be as inclusive as possible in this survey, we fully recognize that some of our labels and terminology will require modification in future surveys, including providing additional options for colleagues who do not identify as either female or male and refining the labels we have used for the various ethnic/racial groups. In future survey work, our goal will include consideration of qualitative studies on gender identity and ethnicity/race, in an attempt to answer some important questions, such as unique challenges faced by individuals who do not identify as either female or male. In addition, we hope to rely on the resources provided by various neuropsychology groups, such as the Hispanic Neuropsychological Society (https://hnps.org), the Asian Neuropsychological Society (https://the-ana.org), the Society for Black Neuropsychology (https://soblackneuro.org), and the Queer Neuropsychological Society (https://www.queerneuro.org), to ensure that we can consider and appreciate the full range of diversity issues and that all of our colleagues have the opportunity to provide valuable insight into the ever-growing field of clinical neuropsychology.
The current article has only begun to examine diversity factors within the field of clinical neuropsychology. Importantly, the field has taken major strides in recognizing the value of advocating for racial justice and ethnic/racial and cultural diversity, as evidenced by all four major neuropsychological organizations publishing statements to the effect. It is our hope that in the coming years, the number of individuals who enter the field as ethnic/racial minorities will continue to increase, allowing more sophisticated examination of these topics, including the intersection of ethnicity/race and gender (e.g. Hill-Jarrett & Jones, Citation2022). In conclusion, we hope readers are left with two important messages. First, despite some of the differences between genders and ethnic/racial minority groups noted above, there are benefits to pursuing a career in clinical neuropsychology, including having the opportunity to engage in research and clinical work in tandem; conducting both clinical and forensic evaluations in which the referral questions can be multifaceted and intellectually stimulating; having the opportunity to work in different settings across one’s career, all with relatively high income; and working in a profession in which income and job satisfactions are relatively high, and mistreatment is perceived to be relatively low. Second, the trends we have seen over the last 15 years support the notion that the field of neuropsychology is gradually becoming more diversified. While this may not be occurring at the same rate as the general population, even slow change is encouraging.
Acknowledgments
The authors thank the American Academy of Clinical Neuropsychology, the National Academy of Neuropsychology, and the Society for Clinical Neuropsychology (Division 40 of the APA), for their financial support and assistance in recruiting survey participants. We also extend our gratitude to the numerous additional regional, state, and local neuropsychology organizations which assisted in recruiting participants, particularly the International Neuropsychological Society, the Association of Postdoctoral Programs in Clinical Neuropsychology, and the NPSYCH listserv. Finally, we offer a special thank you to all of the respondents who allocated time to participate.
Disclosure statement
The authors report no potential conflict of interest.
Additional information
Funding
References
- Aghvinian, M., Santoro, A. F., Gouse, H., Joska, J. A., Linda, T., Thomas, K. G., & Robbins, R. N. (2021). Taking the test: A qualitative analysis of cultural and contextual factors impacting neuropsychological assessment of Xhosa-Speaking South Africans. Archives of Clinical Neuropsychology: The Official Journal of the National Academy of Neuropsychologists, 36(6), 976–980. https://doi.org/10.1093/arclin/acaa115
- American Psychological Association, Committee on Women in Psychology. (2017). Changing gender composition of psychology: Update and expansion of the 1995 task force report. Retrieved August 13, 2021, from http://www.apa.org/women/programs/gender-composition/index.aspx
- Bogoian, H. R., & Dotson, V. M. (2022). Vascular depression in Black Americans: A systematic review of the construct and its cognitive, functional, and psychosocial correlates. The Clinical Neuropsychologist, 36(2), 431–461. https://doi.org/10.1080/13854046.2021.1933188
- Bureau of Labor Statistics. (2018). US department of labor higher median earnings than men in relatively few occupations in 2018 the economics daily, women had. Retrieved August 13, 2021, from https://www.bls.gov/opub/ted/2019/women-had-higher-median-earnings-than-men-in-relatively-few-occupations-in-2018.htm
- Bureau of Labor Statistics. (2020a, December). US department of labor highlights of women’s earnings in 2019. Retrieved August 13, 2021, from https://www.bls.gov/opub/reports/womens-earnings/2019/home.htm
- Bureau of Labor Statistics. (2020b). US department of labor December labor force characteristics by race and ethnicity, 2019. Retrieved September 21, 2021, from https://www.bls.gov/opub/reports/race-and-ethnicity/2019/home.htm
- Byrd, D., Arentoft, A., Scheiner, D., Westerveld, M., & Baron, I. S. (2008). State of multicultural neuropsychological assessment in children: Current research issues. Neuropsychology Review, 18(3), 214–222. https://doi.org/10.1007/s11065-008-9065-y
- Byrd, D., Razani, J., Suarez, P., Lafosse, J. M., Manly, J., & Attix, D. (2010). Diversity Summit 2008: Challenges in the recruitment and retention of ethnic minorities in neuropsychology. The Clinical Neuropsychologist, 24(8), 1279–1291. https://doi.org/10.1080/13854046.2010.521769
- Center on Budget and Policy Priorities. (2021, September). Special series COVID hardship watch tracking the COVID-19 economy’s effects on food, housing, and employment hardships. Retrieved September 22, 2021, from https://www.cbpp.org/research/poverty-and-inequality/tracking-the-covid-19-economys-effects-on-food-housing-and
- Drudy, S. (2008). Gender balance/gender bias: The teaching profession and the impact of feminisation. Gender and Education, 20(4), 309–323. / https://doi.org/10.1080/09540250802190156
- Elbulok-Charcape, M. M., Rabin, L. A., Spadaccini, A. T., & Barr, W. B. (2014). Trends in the neuropsychological assessment of ethnic/racial minorities: A survey of clinical neuropsychologists in the United States and Canada. Cultural Diversity & Ethnic Minority Psychology, 20(3), 353–361. https://doi.org/10.1037/a0035023
- Exley, C., & Kessler, J. B. (2019). The gender gap in self-promotion (No. w26345). National Bureau of Economic Research.
- Feigon, M., Block, C., Guidotti Breting, L., Boxley, L., Dawson, E., & Cobia, D. (2018). Work-life integration in neuropsychology: A review of the existing literature and preliminary recommendations. The Clinical Neuropsychologist, 32(2), 300–317. https://doi.org/10.1080/13854046.2017.1411977
- Franzen, S., Watermeyer, T. J., Pomati, S., Papma, J. M., Nielsen, T. R., Narme, P., Mukadam, N., Lozano-Ruiz, Á., Ibanez-Casas, I., Goudsmit, M., Fasfous, A., Daugherty, J. C., Canevelli, M., Calia, C., van den Berg, E., & Bekkhus-Wetterberg, P, European Consortium on Cross-Cultural Neuropsychology (ECCroN). (2021). Cross-cultural neuropsychological assessment in Europe: Position statement of the European Consortium on Cross-Cultural Neuropsychology (ECCroN). The Clinical Neuropsychologist, 1–12. https://doi.org/10.1080/13854046.2021.1981456
- Fujii, D. E. M. (2018). Developing a cultural context for conducting a neuropsychological evaluation with a culturally diverse client: The ECLECTIC framework. The Clinical Neuropsychologist, 32(8), 1356–1392. https://doi.org/10.1080/13854046.2018.1435826
- Goldin, C. (2014). A grand gender convergence: Its last chapter. American Economic Review, 104(4), 1091–1119. https://doi.org/10.1257/aer.104.4.1091
- Gonzalez, G. (2018, October 22). Why female founders pay themselves less than male entrepreneurs. Retrieved September 21, 2021, from https://www.inc.com/guadalupe-gonzalez/gender-pay-gap-female-founders-women-entrepreneurs.html
- Guterbock, T. M., & Marcopulos, B. A. (2020). [Formula: See text]Survey methods for neuropsychologists: A review of typical methodological pitfalls and suggested solutions. The Clinical Neuropsychologist, 34(1), 13–31. https://doi.org/10.1080/13854046.2019.1590642
- Hill-Jarrett, T. G., & Jones, M. K. (2022). Gendered racism and subjective cognitive complaints among older black women: The role of depression and coping. The Clinical Neuropsychologist, 36(2), 479–502. https://doi.org/10.1080/13854046.2021.1923804
- Hilsabeck, R. C., & Rivera Mindt, M. (2021). A year of turmoil and change: Editorial from the TCN Department of Culture and Gender in Neuropsychology. The Clinical Neuropsychologist, 35(3), 481–489. https://doi.org/10.1080/13854046.2020.1772886
- Irani, F. (Ed.). (2022). Cultural diversity in neuropsychological assessment: Developing understanding through global case studies. Routledge.
- Ivanovic, V., Seiler, S., Tarraf, W., Crivello, E., Martinez, O., Lipton, R., Isasi, C., Copello, T. G., Talavera, G., Gallo, L., Lamar, M., Testai, F., Schneiderman, N., Gellman, M., Daviglus, M., Gonzalez, H., DeCarli, C., & Lipton, M. (2021). Prevalence of incidental brain MRI findings of clinical relevance in a diverse Hispanic/Latino population. Journal of Neuroimaging, 31(6), 1166–1175. https://doi.org/10.1111/jon.12910
- Johnson, E. E. H., Alexander, C., Lee, G. J., Angers, K., Ndiaye, D., & Suhr, J. (2022). Examination of race and gender differences in predictors of neuropsychological decline and development of Alzheimer’s disease. The Clinical Neuropsychologist, 36(2), 327–352. https://doi.org/10.1080/13854046.2021.1940299
- Jones, N., Marks, R., Ramirez, R., & Ríos-Vargas, M. (2021, August). 2020 Census illuminates racial and ethnic composition of the country. Census.gov: US Census. Retrieved March 1, 2022, from https://www.census.gov/library/stories/2021/08/improved-race-ethnicity-measures-reveal-united-states-population-much-more-multiracial.html
- Karageorge, E. (2020, September). COVID-19 recession is tougher on women. US Bureau of Labor Statistics Monthly Labor Review. Retrieved September 22, 2021, from https://www.bls.gov/opub/mlr/2020/beyond-bls/covid-19-recession-is-tougher-on-women.htm
- Kleven, H., Landais, C., & Søgaard, J. E. (2019). Children and gender inequality: Evidence from Denmark. American Economic Journal: Applied Economics, 11(4), 181–209. https://doi.org/10.1257/app.20180010
- Larkin, M. (2018, April). Pay gaps persist for female and African American physicians in US. Retrieved September 21, 2021, from https://www.reuters.com/article/us-health-physicians-pay-gaps/pay-gaps-persist-for-female-and-african-american-physicians-in-us-idUSKBN1HI1E0
- Marcopulos, B. A., Guterbock, T. M., & Matusz, E. F. (2020). Survey research in neuropsychology: A systematic review. The Clinical Neuropsychologist, 34(1), 32–55. https://doi.org/10.1080/13854046.2019.1590643
- Matchanova, A., Avci, G., Babicz, M. A., Thompson, J. L., Johnson, B., Ke, I. J., Rahman, S., Sullivan, K. L., Sheppard, D. P., Morales, Y., Tierney, S. M., Kordovski, V. M., Beltran-Najera, I., Ulrich, N., Pilloff, S., Yeates, K. O., & Woods, S. P. (2020). Gender disparities in the author bylines of articles published in clinical neuropsychology journals from 1985 to 2019. The Clinical Neuropsychologist, 1–18. https://doi.org/10.1080/13854046.2020.1843713
- McCutcheon, J. M., & Morrison, M. A. (2016). Eight days a week”: A national snapshot of academic mothers’ realities in Canadian psychology departments. Canadian Psychology/Psychologie Canadienne, 57(2), 92–100. https://doi.org/10.1037/cap0000049
- Mueller, C., Wright, R., & Girod, S. (2017). The publication gender gap in US academic surgery. BMC Surgery, 17(1), 1–4. https://doi.org/10.1186/s12893-017-0211-4
- Nelson, N. W., Sweet, J. J., Klipfel, K. M., & Moberg, P. J. (2021). Clinical neuropsychology in Canada: Results from the 2020 AACN, NAN, SCN professional practice and “salary survey. The Clinical Neuropsychologist, 35(7), 1205–1231. https://doi.org/10.1080/13854046.2021.1926543
- Odic, D., & Wojcik, E. H. (2020). The publication gender gap in psychology. The American Psychologist, 75(1), 92–103. https://doi.org/10.1037/amp0000480
- Raj, A., Carr, P. L., Kaplan, S. E., Terrin, N., Breeze, J. L., & Freund, K. M. (2016). Longitudinal analysis of gender differences in academic productivity among medical faculty across 24 medical schools in the United States. Academic Medicine: Journal of the Association of American Medical Colleges, 91(8), 1074–1079. https://doi.org/10.1097/ACM.0000000000001251
- Rivera Mindt, M., Byrd, D., Saez, P., & Manly, J. (2010). Increasing culturally competent neuropsychological services for ethnic minority populations: A call to action. The Clinical Neuropsychologist, 24(3), 429–453. https://doi.org/10.1080/13854040903058960
- Rohling, M. L., Ready, R. E., Dhanani, L. Y., & Suhr, J. A. (2022). Shift happens: The gender composition in clinical neuropsychology over five decades. The Clinical Neuropsychologist, 36(1), 1–23. https://doi.org/10.1080/13854046.2020.1778791
- Romero, H., Lageman, S., Kamath, V., Irani, F., Sim, A., Suarez, P., Manly, J. J., & Attix, D. K, the Summit Participants (2009). Challenges in the neuropsychological assessment of ethnic minorities: Summit proceedings. The Clinical Neuropsychologist, 23(5), 761–779. https://doi.org/10.1080/13854040902881958
- Sachs, B. C., Benitez, A., Buelow, M. T., Gooding, A., Schaefer, L. A., Sim, A. H., Tussey, C. M., & Shear, P. K. (2018). Women’s leadership in neuropsychology: Historical perspectives, present trends, and future directions. The Clinical Neuropsychologist, 32(2), 217–234. https://doi.org/10.1080/13854046.2017.1420234
- Salo, S. K., Marceaux, J. C., McCoy, K. J. M., & Hilsabeck, H. C. (2022). Removing the noose item from the Boston naming test: A step toward antiracist neuropsychological assessment. The Clinical Neuropsychologist, 36(2), 311–326. https://doi.org/10.1080/13854046.2021.1933187
- Sweet, J. J., Benson, L. M., Nelson, N. W., & Moberg, P. J. (2015). The American Academy of clinical neuropsychology, National academy of neuropsychology, and society for clinical neuropsychology (APA division 40) 2015 TCN professional practice and ‘salary survey’: Professional practices, beliefs, and incomes of US neuropsychologists. The Clinical Neuropsychologist, 29(8), 1069–1162. https://doi.org/10.1080/13854046.2016.1140228
- Sweet, J. J., Giuffre Meyer, D., Nelson, N. W., & Moberg, P. J. (2011). The TCN/AACN 2010 “salary survey”: Professional practices, beliefs, and incomes of U.S. neuropsychologists. The Clinical Neuropsychologist, 25(1), 12–61. https://doi.org/10.1080/13854046.2010.544165
- Sweet, J. J., Klipfel, K. M., Nelson, N. W., & Moberg, P. J. (2021a). Professional practices, beliefs, and incomes of postdoctoral trainees: The AACN, NAN, SCN 2020 practice and ‘Salary Survey’. Archives of Clinical Neuropsychology: The Official Journal of the National Academy of Neuropsychologists, 36(1), 1–16. https://doi.org/10.1093/arclin/acaa116
- Sweet, J. J., Klipfel, K. M., Nelson, N. W., & Moberg, P. J. (2021b). Professional practices, beliefs, and incomes of U.S. neuropsychologists: The AACN, NAN, SCN 2020 practice and “salary survey. The Clinical Neuropsychologist, 35(1), 7–80. https://doi.org/10.1080/13854046.2020.1849803
- Sweet, J. J., Lee, C., Guidotti Breting, L. M., & Benson, L. M. (2018). Gender in clinical neuropsychology: Practice survey trends and comparisons outside the specialty. The Clinical Neuropsychologist, 32(2), 186–216. https://doi.org/10.1080/13854046.2017.1365932
- Sweet, J. J., Nelson, N. W., & Moberg, P. J. (2006). The TCN/AACN 2005 “salary survey”: Professional practices, beliefs, and incomes of US neuropsychologists. The Clinical Neuropsychologist, 20(3), 325–364. https://doi.org/10.1080/13854040600760488
- Szmigiera, M. (2021, March). Gender pay gap in OECD countries as of 2019. Statista. Retrieved August 13, 2021, from https://www.statista.com/statistics/934039/gender-pay-gap-select-countries/
- U.S. Department of Education, National Center for Education Statistics, Integrated Postsecondary Education Data System (IPEDS). (2019, September). Bachelor’s, master’s, and doctor’s degrees conferred by postsecondary institutions, by sex of student and discipline division: 2017–18. Retrieved August 13, 2021, from https://nces.ed.gov/programs/digest/d19/tables/dt19_318.30.asp
- VanLandingham, H., Ellison, R. L., Laique, A., Cladek, A., Khan, H., Gonzalez, C., & Dunn, M. R. (2022). A scoping review of stereotype threat for BIPOC: Cognitive effects and intervention strategies for the field of neuropsychology. The Clinical Neuropsychologist, 36(2), 503–522. https://doi.org/10.1080/13854046.2021.1947388