
 ?Mathematical formulae have been encoded as MathML and are displayed in this HTML version using MathJax in order to improve their display. Uncheck the box to turn MathJax off. This feature requires Javascript. Click on a formula to zoom.
ABSTRACT
The growth of cancer is still the focus of many research works in the scientific community. So far, various models have been introduced to analyse the behaviour of cancers, including the mathematical growth models such as Logistic, Gompertz and Bertalany. Despite the advances in the analysis of the cancer behaviour, the lack of definitive treatment of cancer disease indicates the need for new perspectives which are supported by more biological background. Recently, a model has been proposed, in which, the tumour growth is interpreted as the outcome of the competition of healthy and cancer cells over the available oxygen, nutrients and space. We have modified this model in order to provide the necessary preparations for wider use of the model in growth rate, growth curve and growth prediction of tumours. Meanwhile, the model is performed on some experimental data to show its capabilities.
1. Introduction
What we know as cancer is a group of 100 different diseases. The resemblance point of all these diseases is the excessive and unusual growth of the cells. This growth will cause the transformation of surrounding tissues, and in more severe conditions, during the metastasis phase, these cells will spread to other parts of the body and they will continue to grow in those areas as well. The cancer cells are some abnormal cells which reproduce quickly and they maintain their ability to copy and grow. The result of this growth, without control, will be the formation of tissue masses or tumours. Further information about cancer can be found in [Citation1,Citation2].
The scientific studies about this disease and its medical solutions indicate that the growth of cancers follows specific patterns. These patterns have attracted many scholars to undertake research in this field, because, understanding the cancer behaviour and its growth pattern can be helpful in predicting the tumour growth and finding the best medical treatment.
Many research works have been done to formulate these patterns by mathematical models, and so far, various models have been provided. Gompertz, exponential, logistic and von Bertalanffy models are some of the classic ones. Most of the mathematical models describe the tumour growth rate by the following equation:(1)
(1)
where is the tumour volume and the other parameters are constant.
The cancer cells will regularly divide in the early stages of the tumour growth; thus, the early stages of cancer growth can be explained by the exponential model which is obtained by substituting and
into equation 1 [Citation3]. This model is often used in the initial analysis of the tumour growth [Citation4–Citation6] and it seems to have a good performance in predicting the early stages of the growth. The constant
demonstrates the tumour growth rate in the exponential model, but in the body, the growth of the cancerous cells depends on the available oxygen, nutrition and space. However, it has been found that this model fails in the next growth stages, when the angiogenesis takes place and the cells face the nutrient deficiencies [Citation7,Citation8].
Considering and
, a special version of Equation 1 will be obtained which is known as the logistic equation:
(2)
(2)
Based on the logistic growth rule, the growth rate will decrease when the tumour size tends to its maximum size and it will eventually reach zero [Citation9].
Another equation which is used to describe the tumour growth is von Bertalanffy’s growth equation, in which the birth rate (cell) of the tumour will be proportional to its level, while the death rate (loss) is proportional to the tumour volume [Citation10]. This equation will be as follows by substituting and
, therefore
(3)
(3)
Benjamin Gompertz, a British self-educated mathematician, introduced the important growth equation of tumours [Citation11]. Based on the Gompertz model, the doubling time of tumour is not constant and the growth rate will decrease as the tumour volume increases, until it reaches the plateau phase. The tumour growth rate is like a sigmoid curve which includes three phases of initial exponential phase, linear phase and plateau phase. Like the above models, the Gompertz growth equation is a special version of equation 1 which is explained as follows:
(4)
(4)
The tumour growth curve estimation of the mentioned classical models has been shown in [Citation12]. The other classical tumour growth models can be found in [Citation3,Citation7].
Figure 1. Tumour growth curve estimation. A comparison of several growth curves in logarithmic scale. is the number of cancer cells at the time
and
is the maximum carrying capacity of tumour reached at the time
[Citation12].
![Figure 1. Tumour growth curve estimation. A comparison of several growth curves in logarithmic scale. N(t) is the number of cancer cells at the time t and Nmax is the maximum carrying capacity of tumour reached at the time tmax [Citation12].](/cms/asset/fc14e02c-1c84-4f6f-884d-59ea243ff4c1/nmcm_a_1738498_f0001_oc.jpg)
Unlike the classical models which use deterministic equations, there are other types of models that use random methods in order to simulate tumour growth. Monte Carlo simulation (modelling) is an example of the random methods. For modelling large systems with many coupled degrees of freedom, using the random methods such as Monte Carlo has some advantages over the analytical methods, because the results can be calculated over and over when effective parameters such as hypoxia change during the tumour growth period. Hypoxia is an imbalance between the oxygen supply and demand in the tumour and it is effectual in predicting the treatment outcomes. More information about the random methods can be found in [Citation13–Citation18].
Despite some advances in the analysis of cancer behaviour, the lack of definitive treatment of cancer disease [Citation19,Citation20] indicates the need for new perspectives which are supported by more biological background.
One of the recent models provided to interpret the cancer growth (with biological regard) is a model which explains the tumour growth based on the competition of cancer and healthy cells in obtaining oxygen, nutrition and proliferation.
In this model, to which we refer as the competitive model, a mathematical framework has been provided by the ‘evolutionary game theory’ to analyse and study the growth of cancer cells.
In the competitive model, presented by West et al. [Citation21], a prisoner’s dilemma game matrix is introduced to determine the utility of healthy and cancer cells in competition to obtain oxygen, nutrients and proliferation of their species. The prisoner’s dilemma is an example of game theory, in which two individuals might not cooperate, even if the cooperation is the best action for both of them. This model has the ability to calculate the instantaneous growth of cancer cells which has been used to analyse the behaviour of tumour under chemotherapy [Citation22–Citation24].
A recent paper [Citation25] has explicitly emphasized the importance of competitive view in treating cancer and described that the treatment has the goal not to directly target cells in the tumour, but instead to perturb the parameters of the game they are playing to allow evolution to steer the tumour towards a more desirable result.
In this paper, however, we will make some changes to increase the capability of the competitive model in order to analyse the tumour behaviour.
The first limitation of the competitive model is the use of cell division in tumour growth process, which requires too many computations. To fix this limitation, we turn the iteration basis into the unit of time (day, week, etc.), like the other classical models.
Another limitation is that the prisoner’s dilemma game matrix is the same for all tumours. In this paper, we consider the elements of the prisoner's dilemma game matrix as parametric and let their value be determined according to the observed behaviour of tumour at the clinical stages. To do this, we use the curve-fitting process.
2. Empowering the competitive model to determine the growth rate, growth curve and growth prediction of tumour
In this section, we modify the competitive model in order to understand the cancer behaviour in growth rate, growth curve and growth prediction of tumour.
The competitive model is a model in which the tumour growth rate will be determined by the competition of the healthy and cancer cells (in the acquisition of nutrients, oxygen and proliferation). West et al. [Citation26] explained this competition by the following game matrix:
(5)
(5)
Matrix is a game payoff matrix between two individuals such as
and
, in which:
gets payoff
against
;
gets payoff
against
;
gets payoff
against
;
gets payoff
against
. If
, then this game is called the prisoner’s dilemma game.
In order to produce the competition’s matrix, the following aspect should be considered: since the growth control tools are damaged in the cancer cells, the cancer cells have a growth advantage over the healthy cells (). The healthy cells work with each other, while the cancer cells defect the cooperation (
). Healthy cells are losers in the competition with cancer cells due to commitment to their surroundings (
). The inequalities
show that the structure of the competition matrix between the healthy and cancer cells is a type of prisoner’s dilemma game matrix.
Now consider a population with cells which consists of
cancer cells and
healthy cells. Thus, based on the given matrix
, the average payoff of each healthy and cancer cell will be obtained as follows, respectively:
(6)
(6)
(7)
(7)
The index emphasizes that the payoff of cancer and healthy cells is not constant and depends on the abundance of cancer and healthy cells. Applying the intensity of selection on the above formulas, the fitness of the healthy and cancer cells will be obtained as follows:
(8)
(8)
(9)
(9)
where is a real number in the interval
and it indicates the influence of competition on the species growth process. In the treatment process, the effect of drug dose can be displayed by the intensity of selection [Citation27,Citation28]. West et al. used the formulas (8) and (9) to calculate the instantaneous growth rate of tumour and applied them to analyse the behaviour of treated tumours (under chemotherapy) [Citation22,Citation23]. The cancer cell growth can be simulated by the competitive model, using the Moran birth-death process (in which the selection probability of each member for birth is proportional to its fitness, and the selection probability for death is independent of fitness).
In , the expected growth curve of the cancer cells is provided in a population with cells,
and the competition matrix
given in relation (5) (the thick blue curve). The mentioned plot illustrates the main feature of the prisoner’s dilemma game matrix: at the beginning of cancer cell growth process, the number of cancer cells is low; thus, cancer cells often compete with the healthy cells and grow rapidly due to the greater advantage. In the following stage, when the number of cancer cells increases, the cancer cells will not only compete with the healthy cells, but they will also compete with each other; therefore, the cancer cell growth rate will decrease. The result of this process is that the growth curve of the cancer cells is of sigmoid type.
Figure 2. Cancer cell growth pattern in a population with cells,
,
and competition matrices
and
.
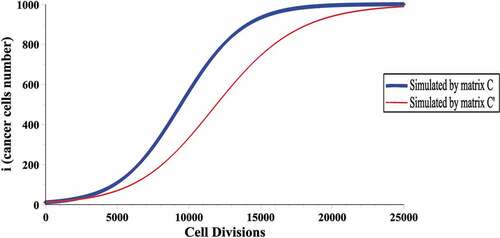
As it can be seen in , for the growth simulation of a tumour in a population with cells,
cell division is required. Considering
of the cells equal to
cells, the tumour growth simulation of size
to
needs
to
cell division, which requires lots of calculations. Also, the expected growth curve of cancer cells, in a population with
cells, the intensity of selection
and competition matrix
have been given in (the thin red curve), where
(10)
(10)
It can be clearly seen that changing the competition matrix elements will change the cancer cell growth rate, and therefore, the introduced matrix (presented in (5)) cannot be used for all tumours' growth simulation. Thus, in order to calculate the growth rate of each tumour, an appropriate competition matrix is required proportional to its behaviour.
In order to fix these limitations (a lot of calculations and constant entries in the competition matrix), we make some changes in the model. We use the cell mass competition matrix in time unit (day, week, etc.), instead of cell competition matrix in cell divisions. In addition, we consider the competition matrix elements as the parameters and let their values be obtained based on the clinical observations. To this end, consider a population of cells of volume
(tumour carrying capacity) and assume that
is the volume of a cell mass (for example
).
Let the following matrix be the competition matrix of healthy and cancer cell masses in time unit:
(11)
(11)
Assume that is the tumour volume at time
. Applying the main idea of the dynamic evolution in which the growth rate of each species is proportional to its fitness, the expected tumour volume at time
will be obtained from the following equation:
(12)
(12)
where
(13)
(13)
(14)
(14)
and
(15)
(15)
(16)
(16)
On the effect of parameter , note that the competition of healthy and cancer cells is formed by the competition matrix. The values of less than one for
reduce the competition impact on the fitness of healthy and cancer cells. Usually,
is considered small enough to hold the one-third law [Citation29]. Our computations show that the values of
up to
for
lead to better results.
Attention should be paid that will be obtained based on the parameters
and
. In order to determine the amount of these unknown variables, we use the behaviour of tumours based on clinical observations. If
are the clinical observations, where
is the observed volume of tumour in time
, then the values of
and
can be obtained by the curve-fitting process; consecutively, we start from
and obtain
according to formula (12)
and finally solve the following problem to obtain the best value of
and
(17)
(17)
The problem (17) is a non-linear programming problem which includes only 4 variables of and because of the low variables, it can be solved by standard mathematics software.
Note that the values of and
are obtained proportional to the intensity of selection
and thus there is no need to worry about the selected value for
, but the selected amount for tumour carrying capacity should be compatible with the observed data in clinical stage (tumour carrying capacity can be determined by medical estimation or through some techniques which have been proposed for this manner [Citation30]).
Since the (normalized) distance between the matrix elements plays an essential role in the prisoner’s dilemma game matrix, it is possible to fix the upper and lower elements to the constant values (for example, and
); therefore the curve-fitting problem is limited to only two variables. In all implementations, we applied only
.
In order to test this method, we use three real datasets extracted from resources [Citation31–Citation33]. These data are related to the mammary, AG104A and lung tumours. As a first step, the tumours' growth curve is obtained. Real data, the computed values for the elements of the prisoner’s dilemma game matrix, and the tumour growth curve have been illustrated in .
Figure 3. Examples of cancerous growth curve by the competitive model. Data, the obtained values for the competition matrix elements and the related growth curve of three tumours by the competitive model with . a) Mammary tumour, b) AG104A tumour, c) Lung tumour.
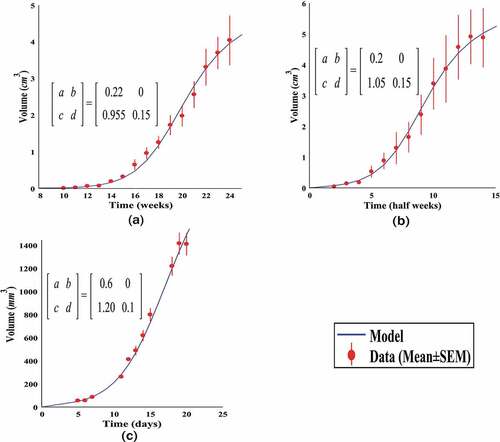
As it can be seen in , the competitive model has good flexibility, and it can provide an acceptable regression for different data.
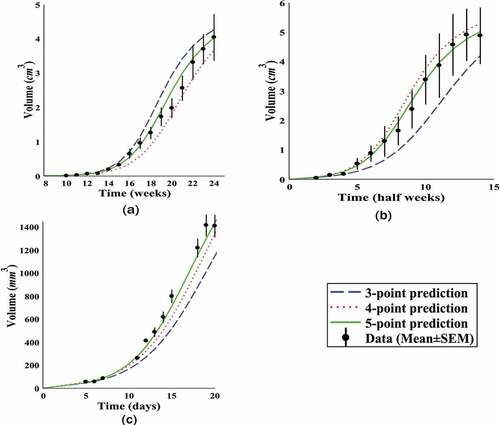
In the following, we have considered some primitive points of each tumour as the known data and obtained the growth curve with respect to these data to study the prediction power of the tumours behaviour. This process was conducted for each tumour with 3, 4 and 5 primitive points and the results have been presented in . indicates that for the given tumour data, the competitive model has the relative prediction capability of tumours behaviour in 5 to 8 future time units with 4 primitive points and more accuracy with 5 primitive points.
Figure 4. Predicting future growth. The performance of competitive model in growth prediction of given tumours in with .
-point prediction means the prediction of tumour growth using
primitive data as the known data.
Finally, the lung tumour data, given in [Citation33], are used in order to compare the competitive model with the other classical models on a larger scale. The performance of the classical models on the mentioned data has been examined in detail in [Citation7]. To compare the models, the coefficient of determination and
indices have been used to display the descriptive power and predictive power, respectively, and results have been presented in .
is the success score for prediction when using
primitive points and predicting the remaining points [Citation7]. As it can be seen in , the competitive and generalized logistic models have had the best performance in the descriptive power of the lung tumour data with respect to
and the competitive model has succeeded to predict 8 out of 20 cases with respect to
.
Table 1. Descriptive and predictive power of models for lung cancer data.
3. Discussion and conclusion
In analysing the cancer cell behaviour with the evolutionary view, the interaction and competition between the subclones are modelled based on the dynamic system approach and theory of evolutionary games. The advantage of this idea is that in addition to characterize the cancer growth pattern, it can be used in adaptive cancer treatment [Citation34], in which prescribing the therapeutic doses is conducted based on the current state of tumour growth and the evolutionary changes. Recently, several successes have been reported for the method of adaptive therapy in cancer inhibition [Citation21,Citation22,Citation24,Citation35,Citation36].
In the competitive model as an evolutionary game model, the tumour growth rate is interpreted based on the competition of healthy and cancer cells. Regarding the effective use of the competitive approach in the cancer treatment, we attempted in this paper to fix the limitations of the method in order to provide a wider use of the model. Further, the model overview has been described briefly and the tumour action mechanism has been demonstrated graphically by the modified model on the experimental data. The tumour growth behaviour and the prediction of tumour progression for broader data have been presented along with the results of the other models.
Finally, it is important to mention that in some cases it has been seen that the clinical observations are not consistent with the biological theories [Citation25,Citation37]. This can be attributed to the heterogeneity of survival and proliferation strategies, which indicates the need for further efforts to understand the competition and interaction among the healthy and cancer cells.
Disclosure statement
No potential conflict of interest was reported by the authors.
Additional information
Funding
References
- F. Bunz, Principle of Cancer Genetics, Springer, New York, NY, USA, 2008.
- L. Pecorino, Molecular Biology of Cancer: Mechanisms, Targets, and Therapeutics, Oxford university press, 2012.
- M. Marušić, Ž. Bajzer, J.P. Freyer, and S. Vuk-Pavlović, Analysis of growth of multicellular tumour spheroids by mathematical models, Cell Prolif. 27 (2) (1994), pp. 73–94. doi:10.1111/j.1365-2184.1994.tb01407.x.
- L.A. Dethlefsen, J.M.S. Prewitt, and M.L. Mendelsohn, Analysis of tumor growth curves, J. Natl. Cancer Inst. 40 (2) (1968), pp. 389–405. doi:10.1093/jnci/40.2.389.
- A.K. Laird, Dynamics of tumour growth, Br. J. Cancer 18 (3) (1964), pp. 490. doi:10.1038/bjc.1964.55.
- W.C. Summers, Dynamics of tumor growth: A mathematical model, Growth 30 (1966), pp. 333–338.
- S. Benzekry, C. Lamont, A. Beheshti, A. Tracz, J.M. Ebos, L. Hlatky, and P. Hahnfeldt, Classical mathematical models for description and prediction of experimental tumor growth, PLoS Comput. Biol. 10 (8) (2014), pp. e1003800. doi:10.1371/journal.pcbi.1003800.
- P. Gerlee, The model muddle: In search of tumor growth laws, Cancer Res. 73 (8) (2013), pp. 2407–2411. doi:10.1158/0008-5472.CAN-12-4355.
- P.F. Verhulst, Notice sur la loi que la population suit dans son accroissement, Corresp. Math. Phys. 10 (1838), pp. 113–126.
- V.G. Vaidya and F.J. Alexandro, Evaluation of some mathematical models for tumor growth, Int. J. Biomed. Comput. 13 (1) (1982), pp. 19–35. doi:10.1016/0020-7101(82)90048-4.
- B. Gompertz, XXIV. On the nature of the function expressive of the law of human mortality, and on a new mode of determining the value of life contingencies, In a letter to Francis Baily, Esq. FRS &c. Philos. Trans. R. Soc. London. 115 (1825), pp. 513–583.
- N. Henscheid, E. Clarkson, K.J. Myers, and H.H. Barrett, Physiological random processes in precision cancer therapy, PLoS ONE. 13 (6) (2018), pp. e0199823. 29. doi:10.1371/journal.pone.0199823.
- M. Antonopoulos, D. Dionysiou, G. Stamatakos, and N. Uzunoglu, Three-dimensional tumor growth in time-varying chemical fields: A modeling framework and theoretical study, BMC Bioinformatics 20 (1) (2019), pp. 442. doi:10.1186/s12859-019-2997-9.
- K. Borkenstein, S. Levegrün, and P. Peschke, Modeling and computer simulations of tumor growth and tumor response to radiotherapy, Radiat. Res. 162 (1) (2004), pp. 71–83. doi:10.1667/RR3193.
- A. Dau, I. Toma-Dau, and M. Karlsson, The effects of hypoxia on the theoretical modelling of tumour control probability, Acta Oncol. (Madr) 44 (6) (2005), pp. 563–571. doi:10.1080/02841860500244435.
- L.G. Marcu and D. Marcu, In silico modelling of a cancer stem cell-targeting agent and its effects on tumour control during radiotherapy, Sci. Rep. 30 (2016), pp. 3233.
- L.G. Marcu and W.M. Harriss-Phillips, In silico modelling of treatment-induced tumour cell kill: Developments and advances, Comput. Math. Methods Med. 2012 (2012), pp. 1–16. doi:10.1155/2012/960256.
- W. Tuckwell, E. Bezak, E. Yeoh, and L. Marcu, Efficient Monte Carlo modelling of individual tumour cell propagation for hypoxic head and neck cancer, Phys. Med. Biol. 53 (17) (2008), pp. 4489. doi:10.1088/0031-9155/53/17/002.
- H. Maeda and M. Khatami, Analyses of repeated failures in cancer therapy for solid tumors: Poor tumor-selective drug delivery, low therapeutic efficacy and unsustainable costs, Clin. Transl. Med. 7 (1) (2018), pp. 11. doi:10.1186/s40169-018-0185-6.
- K.D. Miller, R.L. Siegel, C.C. Lin, A.B. Mariotto, J.L. Kramer, J.H. Rowland, K.D. Stein, R. Alteri, and A. Jemal, Cancer treatment and survivorship statistics, CA Cancer J. Clin. 66 (4) (2016), pp. 271–289. doi:10.3322/caac.21349.
- J. West, Z. Hasnai, J. Mason, and P.K. Newton, The prisoner’s dilemma as a cancer model, Converg. Sci. Phys. Oncol. 2 (3) (2016), pp. 035002. doi:10.1088/2057-1739/2/3/035002.
- J. West and P.K. Newton, Chemotherapeutic dose scheduling based on tumor growth rates provides a case for low-dose metronomic high-entropy therapies, Cancer Res. 77 (23) (2017), pp. 6717–6728. doi:10.1158/0008-5472.CAN-17-1120.
- J. West and P.K. Newton, Optimizing chemo-scheduling based on tumor growth rates, bioRxiv (2018), pp. 263327.
- J. West, et al., Towards multi-drug adaptive therapy, bioRxiv (2018), pp. 476507.
- A. Kaznatcheev, J. Peacock, D. Basanta, A. Marusyk, and J.G. Scott, Fibroblasts and alectinib switch the evolutionary games played by non-small cell lung cancer, Nat. Ecol. Evol. 3 (3) (2019), pp. 450. doi:10.1038/s41559-018-0768-z.
- J. West, Z. Hasnain, P. Macklin, and P.K. Newton, An evolutionary model of tumor cell kinetics and the emergence of molecular heterogeneity driving gompertzian growth, SIAM Rev. 58 (4) (2016), pp. 716–736. doi:10.1137/15M1044825.
- Y. Ma and P.K. Newton, On the design of treatment schedules that avoid chemotherapeutic resistance, bioRxiv (2018), pp. 325381.
- Y. Ma and P.K. Newton, Nonlinear dynamics of chemotherapeutic resistance, bioRxiv (2018), pp. 300582.
- M.A. Nowak, Evolutionary Dynamics, Harvard University Press, 2006.
- S. Prokopiou, E.G. Moros, J. Poleszczuk, J. Caudell, J.F. Torres-Roca, K. Latifi, and H. Enderling, A proliferation saturation index to predict radiation response and personalize radiotherapy fractionation, Radiat. Oncol. 10 (1) (2015), pp. 159. doi:10.1186/s13014-015-0465-x.
- S.A. Davie, J.E. Maglione, C.K. Manner, D. Young, R.D. Cardiff, C.L. MacLeod, and L.G. Ellies, Effects of FVB/NJ and C57Bl/6J strain backgrounds on mammary tumor phenotype in inducible nitric oxide synthase deficient mice, Transgenic Res. 16 (2) (2007), pp. 193–201. doi:10.1007/s11248-006-9056-9.
- Y. Kawarada, R. Ganss, N. Garbi, T. Sacher, B. Arnold, and G.J. Hmmerling, NK-and CD8+ T cell-mediated eradication of established tumors by peritumoral injection of CpG-containing oligodeoxynucleotides, J. Immunol. 167 (9) (2001), pp. 5247–5253. doi:10.4049/jimmunol.167.9.5247.
- J.E. Talmadge, R.K. Singh, I.J. Fidler, and A. Raz, Murine models to evaluate novel and conventional therapeutic strategies for cancer, Am. J. Pathol. 170 (3) (2007), pp. 793–804. doi:10.2353/ajpath.2007.060929.
- R.A. Gatenby, A.S. Silva, R.J. Gillies, and B.R. Frieden, Adaptive therapy, Cancer Res. 69 (11) (2009), pp. 4894–4903. doi:10.1158/0008-5472.CAN-08-3658.
- M. Gluzman, J.G. Scott, and A. Vladimirsky, Optimizing adaptive cancer therapy: Dynamic programming and evolutionary game theory, arXiv Preprint arXiv:1812.01805 (2018).
- A. Kaznatcheev, R. Vander Velde, J.G. Scott, and D. Basanta, Cancer treatment scheduling and dynamic heterogeneity in social dilemmas of tumour acidity and vasculature, Br. J. Cancer 116 (6) (2017), pp. 785. doi:10.1038/bjc.2017.5.
- K. Leder, J. Foo, B. Skaggs, M. Gorre, C.L. Sawyers, and F. Michor, Fitness conferred by BCR-ABL kinase domain mutations determines the risk of pre-existing resistance in chronic myeloid leukemia, PLoS ONE. 6 (11) (2011), pp. e27682. 28. doi:10.1371/journal.pone.0027682.