
Abstract
Objectives
The diagnostic performance of fractional flow reserve with computed tomography (FFR-CT) is affected by the presence of calcified plaque. Subtraction can remove the influence of calcification in coronary computed tomography angiography (CCTA) to increase confidence in the diagnosis of coronary artery stenosis. Our purpose is to investigate the accuracy of post-subtraction FFR-CT in predicting early revascularization.
Design
Based on CCTA data of 237 vessels from 79 patients with coronary artery disease, subtraction CCTA images were obtained at a local post-processing workstation, and the conventional and post-subtraction FFR-CT measurements and the difference in proximal and distal FFR-CT values of the narrowest segment of the vessel (ΔFFR-CT) were analyzed for their accuracy in predicting early coronary artery hemodynamic reconstruction.
Results
With FFR-CT ≤ 0.8 as the criterion, the accuracy of conventional and post-subtraction FFR-CT measurements in predicting early revascularization was 73.4% and 77.2% at the patient level, and 64.6% and 72.2% at the vessel level, respectively. The specificity of post-subtraction FFR-CT measurements was significantly higher than that of conventional FFR-CT at both the patient and vessel levels (P of 0.013 and 0.015, respectively). At the vessel level, the area under the curve of receiver operating characteristic was 0.712 and 0.797 for conventional and post-subtraction ΔFFR-CT, respectively, showing a difference (P = 0.047), with optimal cutoff values of 0.07 and 0.11, respectively.
Conclusion
The post-subtraction FFR-CT measurements enhance the specificity in predicting early revascularization. The post-subtraction ΔFFR-CT value of the stenosis segment > 0.11 may be an important indicator for early revascularization.
Introduction
Flow reserve fraction (FFR) is a decisive parameter of coronary revascularization therapy and a reference standard for the degree of stenosis [Citation1]. Due to the invasive nature of invasive FFR and its high cost, it is not acceptable to most patients with coronary artery disease (CAD) [Citation2]. As a powerful non-invasive new technology, FFR derived from coronary computed tomography angiography (CCTA) has high diagnostic performance and effectively reduces unnecessary invasive coronary angiography (ICA) [Citation3]. In addition, FFR with computed tomography (FFR-CT) has a good correlation with invasive FFR [Citation4], and has great potential in guiding coronary revascularization and prognostic evaluation [Citation5–7]. FFR-CT enhances the value of CAD reporting and data systems (CAD-RADS) in guiding therapeutic decisions for CAD [Citation8].
However, due to the blooming artifacts effect of calcified plaque and beam hardening artifacts, which generally affect the accuracy of CCTA diagnosis [Citation9]. Calcified plaques may also affect FFR-CT calculations [Citation1,Citation10]. Studies suggest that calcified plaques may increase FFR-CT false positives [Citation11,Citation12]. Yuko O et al. found that among the false positive predictors of FFR-CT, the presence of calcified plaque was the only significant predictor. Regardless of the degree of calcification indicated by Agatston score, the presence of calcified plaque significantly affected the diagnostic performance of FFR-CT [Citation12].
With recent developments in subtraction CCTA, coronary artery calcification can be removed from images by subtracting non-contrast-enhanced CT image data from corresponding contrast-enhanced CT image data [Citation13]. In some previous studies, the adverse effects of calcification on lumen display were eliminated by using the calcification subtraction technique, which increased the reader’s diagnostic confidence in evaluating severely calcified segments and improved diagnostic performance [Citation14,Citation15].
To date, there has been limited understanding of whether calcification subtraction can improve the diagnostic performance of FFR-CT in predicting early revascularization in CAD post-subtraction FFR-CT in predicting early revascularization in CAD patients.
Methods
This study was carried out in accordance with the principles of the Helsinki Declaration, and was approved by the Ethics Committee of Tongji Medical College of Huazhong University of Science (No.2020-S336) and written informed consent was not required due to the retrospective design of the study.
Study population
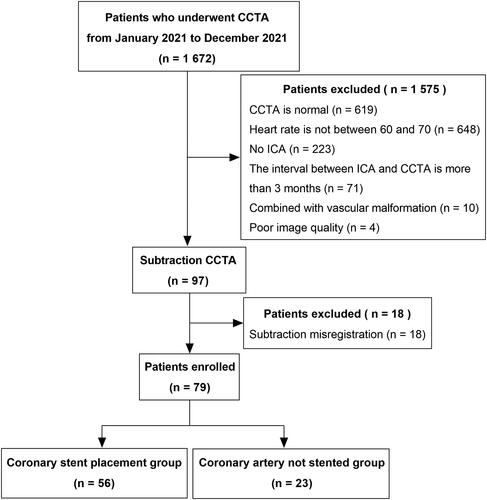
Patients with suspected CAD who underwent CCTA at our hospital from January 2021 to December 2021 were retrospectively included. All CCTA patients also underwent post-processing with subtraction technique and ICA within 3 months. The inclusion process is shown in . Inclusion criteria: (1) age ≥ 18 years; (2) no history of iodine contrast allergy; (3) no arrhythmia; (4) heart rate in the range of 60 to 70; (4) normal renal function (eGFR > 60 mL/min/1.73 m2); (5) CCTA and ICA were available, and the ICA inspection is within 3 months after the CCTA inspection examination; and (6) The image quality of CCTA and its subtraction processing is good and can be recognized and analyzed by FFR-CT system. Exclusion criteria: (1) the image has serious artifacts; (2) Subtraction CCTA mismatch; (3) The interval between CCTA and ICA exceeds 3 months; (4) percutaneous coronary intervention (PCI) or coronary artery bypass grafting (CABG) were performed before CCTA; (5) Vascular malformations.
Figure 1. Flow chart of patient inclusion.
CCTA examination
Scanner: Canon 320-row CT scanner (Aquilion Vision, Canon Medical Systems, Otawara, Japan). Pre-scan preparation: the patient was trained to holding to reduce respiratory artifacts.
Scanning protocol: Prospective electrocardio-gating technique method was adopted. After holding breath, non-enhanced and enhanced scanning were performed successively. The scanning range was from 1 cm below the tracheal bifurcation to the apex of the heart. The enhancement scan was triggered by artificial intelligence. The region of interest was selected at the aortic root of the patient to monitor the CT attenuation value, and the threshold was selected to be 100 Hounsfield units (HU). When the CT attenuation value of the region of interest reached the threshold, the scan was automatically triggered with a time of 5 s.
Scanning parameters: The tube current was modulated by intelligent mA, the tube voltage was 100 kV, the tube rotation time was 0.275 s, the collimate was 320 × 0.5 mm, the layer thickness was 0.5 mm, the layer spacing was 0.25 mm. The filter convolution(FC43)with the adaptive iterative dose reduction technology(AIDR 3D Enhance)was used to reconstruct for CCTA. Enhancement scan injection flow rate 4.0-5.0 mL/s (using double-barrel high-pressure syringe), non-ionic contrast agent: iodixanol (320 mg I/mL, GE). Injection dose: iodine contrast volume (ml) = patient weight (kg) × 0.7 (ml/kg), then 50 mL normal saline was injected at the same flow rate.
Subtraction CCTA images
Coronary artery subtraction was performed using the automatic registration subtraction software (Subtraction Coronary CT Angiography, Canon Medical Systems) that comes with the Canon 320-row CT scanner. Subtraction steps: 1. Select the well- matched non-contrast agent mask and the contrast enhanced phase and import them into the pre-enhanced and post-enhanced modules respectively; 2. Adjust the image position on the axial, coronal and sagittal planes to make the plaques on the blood vessels as accurate as possible; 3. The volume data of the enhanced scan will be subtracted from the no enhanced volume data to obtain the coronary subtraction CCTA image of calcified plaque removal; 4. The both local rigid registration and global deformable registration function of the software was used for adjustment the position of calcified plaques. The coronary subtraction software would strictly match the two sets of images to eliminate blooming artifacts from the calcified lesion; 5. Transfer all pre-subtraction and post-subtraction images to post-processing workstation.
Image analysis
Conventional CCTA and subtraction CCTA images were independently evaluated by two radiologists (with 8 and 15 years of experience diagnostic in diagnosing CCTA, respectively) without knowledge of the patient’s ICA results. If the conclusions are inconsistent, the evaluation is reviewed by a third radiologist with 20 years of experience in diagnosing CCTA. The Coronary arteries were divided into 18 segments according to the Society of Cardiovascular Computed Tomography classification [Citation16]. The image quality and mismatch of segments in subtraction CCTA images were observed and evaluated. Observation segments included proximal, medial, and distal segments of the Right Coronary Artery (RCA) and the Left Anterior Descending (LAD), proximal and distal segments of the left circumflex artery (LCX), and the left trunk. Mismatch refers to the fact that calcification or stent of plain scan and enhanced image have slightly displacement, but the lesion still can be observed and evaluated in subtracted CCTA through the registration during subtraction [Citation14].
Coronary artery Calcium Score (CACS)
CACS was measured using Canon workstation software (Vitrea 6.7.2, Canon Medical Systems, Japan) according to the method of Calcium Score (Agatston) [Citation17]. Calcification was defined as a CT peak density ≥ 130 HU and a range of ≥ 3 neighbouring pixels. CACS < 400 and ≥ 400 were defined as mild-moderate and severe calcification, respectively [Citation18].
FFR-CT analysis
The FFR-CT of conventional CCTA and subtraction CCTA was automatically analyzed and calculated using the coronary artery artificial intelligence assisted diagnosis system (Numarkun Clinical Decision Support Platform V1.0, Beijing Numarkun Science and Technology Co., Ltd.) The core part of the software is the FFR-CT calculation module based on deep learning neural network, which fully considers the local and global relations, and can accurately and quickly predict the FFR-CT value of each point on the whole blood vessel path and the whole blood vessel.
FFR-CT measurements, FFR-CT values at the beginning and end points of the narrowest segments before and after subtraction were recorded, and the difference in FFR-CT values proximal and distal to the narrowest point of the vessel (ΔFFR-CT) was calculated. The length of each vessel, the location of the FFR-CT measurements, and the distance from the beginning and end of the narrowest segment to the coronary artery opening before and after subtraction were also recorded. The method of measuring FFR-CT values post-subtraction was the same as pre-subtraction. The FFR-CT measurement is the FFR-CT value 2 cm distal to the last stenosis on the vessel. If the vessel diameter is less than 2.0 mm at 2 cm from the last stenosis, the FFR-CT measurement was shifted proximal to the lumen diameter of 2.0 mm. FFR-CT values at the beginning and end of the narrowest segment were recorded by observers. The FFR-CT values of all vessels were assessed and calculated independently by two observers, and again separately after 1 month to assess intraobserver and interobserver consistency.
ICA assessment and patient treatment management strategies
Standardized ICA data, including left main, RCA, LAD and LCX main branch stenosis and revascularization, were collected within 3 months after CCTA. The degree of stenosis was divided into 5 grades: slight, mild, moderate, severe, and occlusive, and then divided into groups according to different levels: severe (≥ 70% stenosis or occlusive) and mild-moderate (stenosis less than 70%), and moderate-severe (≥ 50% stenosis or occlusive) and mild (stenosis less than 50%).
A panel of three experienced interventional cardiologists reached a consensus on the need for PCI or CABG based on the patient’s symptoms and examination findings [Citation19]. They decided whether the patients needed PCI or CABG, and included patients who underwent PCI or CABG within three months of ICA as revascularization and those who did not otherwise as non-revascularization.
Statistical analysis
All analyses were performed using SPSS (version 26.0, IBM Corporation, Armonk, NY, USA) and Medcalc software (version 20.0, Ostend, Belgium). Measurement data were expressed as mean ± standard deviation or median (interquartile range) and inter-group comparisons were made using the independent sample T test, ANOVA, or Kruskal-Wallis test, depending on whether the distribution was normal after the Shapiro-Wilk test. Count data were expressed as n (%), and comparisons between groups were made using Chi-square tests or Fisher exact tests. The conventional and post-subtraction FFR-CT measurements and ΔFFR-CT values of the narrowest segments were calculated. The sensitivity, specificity, negative predictive value, positive predictive value, and accuracy of coronary artery revascularization (PCI or CABG) were compared, and chi-square test was used to detect differences between groups. Delong test was used to compare the area under the curve (AUC) of receiver operating characteristi (ROC) between conventional and post-subtraction FFR-CT measurements. The variables with statistically different AUCs were further compared for diagnostic efficacy in the mild-moderate calcified and severe calcified lesions, respectively. Cohen’s kappa was used to analyze the consistency between the two evaluators in the four-point image quality score and the calculation of FFR measurements (> 0.80 was considered good agreement). P < 0.05 was considered statistically significant.
Results
Basic patient characteristics
A total of 237 vessels were included in 79 patients, who were divided into two groups according to whether revascularization was performed within 3 months after CCTA: the group with revascularization (56 patients) and the group without revascularization (23 patients). 81 vessels underwent revascularization and the other 156 vessels were not revascularized. The clinical baseline data are shown in .
Table 1. Clinical baseline data of patients.
Vessel stenosis characteristics
The degree and extent of luminal stenosis could be clearly demonstrated by subtracting the CCTA images of calcified plaques, as shown in . As shown in , of the 79 patients, 61 (77.22%) had conventional FFR-CT measurement values ≤ 0.8, and 56 (70.88%) had post-subtraction FFR-CT measurement values ≤ 0.8. Among 237 vessels, 121 cases (51.05%) had conventional FFR-CT value ≤ 0.8, and 91 cases (38.40%) had post-subtraction FFR-CT value ≤ 0.8. A total of 81 vessels underwent revascularization within 3 months after CCTA examination.
Figure 2. The patient, male, 71 years old, was admitted to the hospital with ‘increased blood pressure for more than 20 days’. Figure A, conventional CCTA; Figure B, conventional FFR-CT; Figure C, ICA; Figure D subtraction CCTA; Figure E, post-subtraction FFR-CT; Figure F, PCI. CCTA showed severe segmental calcified plaque in the proximal segment of the LAD, with severe luminal stenosis (Figure A, white arrows), and the FFR-CT measurement value was 0.84 (Figure B), and ICA was performed to show severe stenosis of the LAD proximally (Figure C, white arrows). The lumen of the LAD was clearly shown post-subtraction, with severe proximal stenosis (Figure D, white arrows), and FFR-CT measurement value was 0.74 (Figure E). PCI was given after evaluation by interventional cardiovascular specialists, and after the procedure the proximal segment of the LAD was well filled and the lumen did not show any stenosis (Figure F, red arrow).
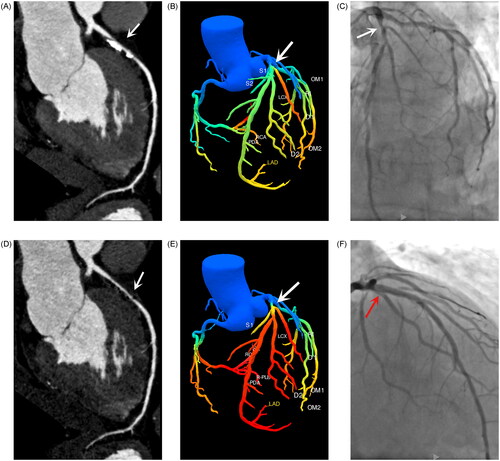
Table 2. Characteristics of coronary artery stenosis.
Distance of FFR-CT measurement position from coronary artery opening
For FFR-CT measurements, there was no significant difference in coronary artery opening distance between conventional and subtracted measurement sites (both P > 0.05). After subtraction, the length of the narrowest segment reduced significantly compared with that shown by conventional CCTA, and the starting point of the narrowest segment moved backward from the coronary artery opening compared with conventional CCTA (P = 0.007), while the end point moved forward (both P < 0.05) ().
Table 3. Distance of each FFR-CT measurement position from the coronary artery opening for conventional and post-subtraction imaging.
Diagnostic accuracy and efficacy analysis of FFR-CT in predicting early revascularization
respectively show the diagnostic accuracy of the various FFR-CT measurements at patient and vessel level in predicting early hemodynamic changes with ≤ 0.8 as the standard.
Table 4. Accuracy and efficacy analysis of FFR-CT in predicting early revascularization at patient and vascular level.
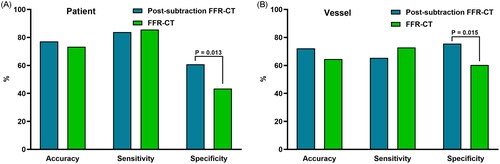
At the patient level, the AUC measured by post-subtraction FFR-CT was higher (0.724), and the diagnostic accuracy was 77.2%. The AUC of conventional FFR-CT measurement was 0.646, the diagnostic accuracy was 73.4%, the sensitivity of conventional FFR-CT measurement was 85.7%, and the post-subtraction FFR-CT measurement was 83.9%, while the specificity of conventional FFR-CT measurement was low (43.5%).
At the vessel level, the AUC value of post-subtraction FFR-CT was higher (0.705), and the diagnostic accuracy was 72.20%. The AUC of conventional FFR-CT was 0.665, and the diagnostic accuracy was 64.60%. Their sensitivity was 65.40% and 72.80%, and their specificity was 75.60% and 60.30%, respectively.
At the patient and vessel levels, conventional and post-subtraction FFR-CT measurements ≤0.8 showed no significant differences in the accuracy and sensitivity of predicting early coronary revascularization, while the specificity after subtraction was significantly higher than that of conventional FFR-CT measurements (P 0.013 and 0.015, respectively), as shown in .
Figure 3. Comparison of accuracy, sensitivity, and specificity of conventional and post-subtraction FFR-CT measurements ≤ 0.8 for predicting early coronary revascularization, a is patient level, B is vessel level. FFR-CT: fractional flow reserve with computed tomography; P: P value.
shows the diagnostic efficacy of ΔFFR-CT, in which vessel level post-subtraction ΔFFR-CT has the best diagnostic efficacy (AUC: 0.79, sensitivity: 65.43%, specificity: 82.05%, optimal cut-off value for predicting early revascularization: 0.11).
Table 5. Diagnostic efficiency of post-subtraction ΔFFR-CT in predicting early revascularization in the narrowest region.
Comparison of diagnostic efficacy of FFR-CT values between conventional and post-subtraction at patient and vessel levels
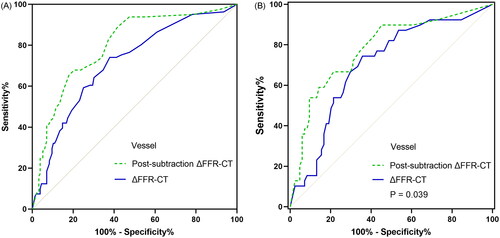
As shown in , a total of 4 groups of ROC curves were compared. Conventional and post-subtraction FFR-CT measurements and ΔFFR-CT values were compared at patient level and vessel level, respectively. At the vessel level, post-subtraction ΔFFR-CT value AUC was significantly better than conventional value (P = 0.047). In patients with mild-to-moderate calcification (CACS < 400), the AUC of post-subtraction at the vessel level did not differ significantly from conventional (AUC: 0.857 vs. 0.813, P = 0.165) (). In contrast, in patients with severe calcification (CACS ≥ 400), the AUC of post-subtraction at the vessel level was significantly better than conventional (AUC: 0.780 vs. 0.703, P = 0.039) ().
Figure 4. ROC Curve comparison between conventional and post-subtraction FFR-CT. A and B are patient level FFR-CT measurements and ΔFFR-CT values, respectively, and C and D are vessel level FFR-CT measurements and ΔFFR-CT values, respectively. ΔFFR-CT: difference in FFR-CT values proximal and distal to the narrowest point of the vessel; FFR-CT: fractional flow reserve with computed tomography; P: P value.
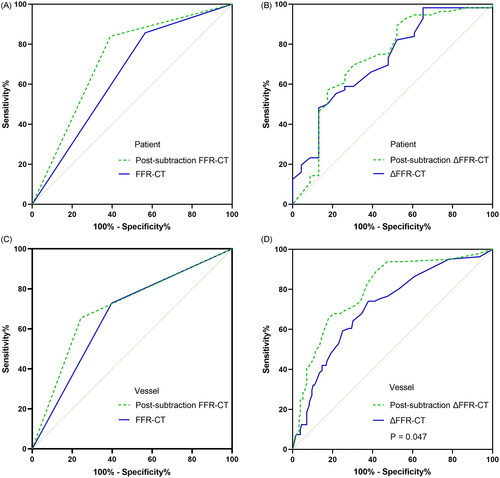
Figure 5. Comparison of ROC curves between conventional and post-subtraction ΔFFR-CT after further stratification by CACS; a and B are comparisons of AUC at the vessel level with CACS < 400 and ≥ 400, respectively. ΔFFR-CT: difference in FFR-CT values proximal and distal to the narrowest point of the vessel; AUC: area under the curve; CACS: coronary artery calcium score; FFR-CT: fractional flow reserve with computed tomography; P: P values.
Consistency test analysis results
Both observers had good reproducibility in patient and vessel level image ratings (0.815–0.885) and FFR-CT value measurements (0.841–0.871).
Discussion
This study analyzed the effect of post-subtraction and conventional FFR-CT measurements and ΔFFR-CT in the narrowest segment on predicting early coronary revascularization. Our findings were: 1) The diagnostic specificity of post-subtraction FFR-CT was better than that of conventional FFR-CT, regardless of patient or vessel level; 2) There was no significant difference between conventional and post-subtraction ΔFFR-CT in predicting the diagnostic performance of early revascularization, whereas the diagnostic performance of post-subtraction ΔFFR-CT was significantly better than conventional ΔFFR-CT at the vessel level.
FFR-CT is a non-invasive combined anatomical and physiologic assessment tool that provides a discriminatory approach for patients to choose between medication and invasive treatment in the clinic. In our study, the diagnostic accuracy of post-subtraction FFR-CT measurements and the AUC of the ROC curves were greater for both patients and vessels than those of FFR-CT, although their differences did not reach statistical significance. Their specificity was significantly higher than FFR-CT, and the increased diagnostic specificity of post-subtraction FFR-CT may be related to the absence of calcified plaque interference after subtraction. Extensive calcification of the coronary arteries may affect FFR-CT calculations and lead to underestimation of FFR-CT measurements [Citation2,Citation10]. For patients with severe calcification, post-subtraction FFR-CT had higher PPV and specificity than FFR-CT, while maintaining the same high sensitivity and NPV [Citation20]. Our post-subtraction FFR-CT diagnostic performance is slightly lower, compared to the above findings [Citation20]. The possible reason is due to the difference in the subjects of the two studies. Kamo et al.'s study [Citation20] population included only patients with severe calcification, whereas ours included all patients with mixed plaques. There are relatively few blooming artifacts effects and beam hardening artifacts caused by more severe calcified plaques in mixed plaques, and the degree of lumen stenosis caused by them shows little difference in the images before and after subtraction. Therefore, these patients may reduce the effect of subtraction in CCTA and affect the role of FFR-CT in predicting early revascularization. The increased specificity of post-subtraction FFR-CT compared to conventional FFR also reflects its advantage in reducing unnecessary ICA or reperfusion recommendations, which may further reduce costs. Compared with conventional invasive treatment, the cost of the treatment strategy using FFR-CT was reduced by 32%. There was no significant difference in the cost of FFR-CT treatment strategy when compared with conventional non-invasive treatment algorithm [Citation21].
Our study further explored the role of post-subtraction and conventional ΔFFR-CT in the identification of early revascularization, and the results showed that ΔFFR-CT had high diagnostic efficacy at both the vessel and patient levels (AUC = 0.797 and 0.733, respectively). And when the ΔFFR-CT was > 0.11 and > 0.18, the sensitivity (65.43% and 57.14%%, respectively) and specificity (65.43% and 82.81%, respectively) for predicting early revascularization were higher, and the diagnostic efficacy of post-subtraction ΔFFR-CT was significantly better than that of conventional ΔFFR-CT (P = 0.047). Moreover, after stratification by CACS, the diagnostic efficacy of post-subtraction ΔFFR-CT at the vessel level was still significantly better than that of conventional ΔFFR-CT in severely calcified lesions. There is little literature on the role of ΔFFR-CT in predicting early revascularization. A multicenter study affirms the role of ΔFFR-CT combined with other factors (risk factors + stenosis type and location + CAD-RADS + FFR-CT) in identifying early revascularation, showing that when ΔFFR-CT is added to models of risk factors, stenosis type, location, CAD-RADS, and FFR-CT, the diagnostic efficiency of early revascularization was significantly higher than that of the original model (AUC: 0.87 vs 0.85, P < 0.001). For patients with FFR-CT measurements ≤ 0.8 and CAD-RADS ≥ 3, when the indicator is ΔFFR-CT > 0.13, ICA examinations may be reduced by 32.2%, and increased the proportion of revascularization in ICA (from 65.2% to 73.1%) [Citation19]. Compared to their study, this study identified the ability of ΔFFR-CT to predict early revascularization as an independent factor, and for the first time, we used post-subtraction to measure the ΔFFR-CT in order to reduce the influence of calcified plaque on FFR. The advantages of post-subtraction FFR-CT are obvious, especially in patients with severe calcification (CACS ≥ 400). On the one hand, the FFR-CT value of a point in the lesion is affected by its upstream vascular flow and coronary atherosclerosis, and even in the absence of obstruction, the FFR-CT value is reduced by the presence of coronary plaque [Citation22]. In contrast, ΔFFR-CT circumvents the influence of upstream vascular flow and coronary atherosclerosis, and more accurately reflects the physiological severity of the narrow area. On the other hand, FFR is mainly determined by the combined factors of ‘friction coefficient’ and ‘separation system’ (including vascular lumen shape and narrow geometry) [Citation23]. By subtracting, calcified plaques and their artifacts can be removed [Citation24], thereby reducing the influence of ‘narrow geometry’ on FFR measurement and better reflecting the physiological severity of the narrow segment.
In addition, severe calcified plaques prompt observers to overestimate the degree of anatomical coronary stenosis and the length of involvement [Citation25], making it impossible for even experienced observers to accurately determine the start and end point of the diseased segment. In our study, the degree of luminal stenosis and the length of involved vessels became clearly discernible in calcified segments after subtraction, reducing the overestimation of luminal stenosis and truly reflecting the length of involved vessels. The length of vessels involved in the narrowest segment after subtraction was significantly reduced than that of the involved vessels on conventional CCTA, and the starting point of the narrowest segment was relatively backward, and the end point was relatively forward. To a large extent, the problem of inaccurate FFR-CT values caused by inaccurate location of measuring points due to severe calcification in conventional CCTA images is avoided.
Limitations: 1. This is a single-center study with a small number of cases, and a large number of multi-center cases are still needed for further confirmation; 2. In some patients, the subtraction effect is still poor despite multiple alignments, which affects the observation and wastes the time of the staff; 3. There is a lack of invasive FFR as a reference, but FFR-CT has a good consistency with invasive FFR, and its value in the diagnosis of coronary ischemia and guiding decision-making for revascularization, has been recognized by the American College of Cardiology and the National Institute of Cardiology/American Society of Cardiology and the American Academy of Pediatrics. The value of FFR-CT has been recognized and recommended by the American College of Cardiology/American Heart Association Joint Committee [Citation26]. 4. Clinical indicators such as patients’ symptoms and risk factors were not included in this study for further further comprehensive analysis to predict early revascularization.
Conclusions
In conclusion, post-subtraction FFR-CT has better diagnostic specificity than conventional FFR-CT in distinguishing early revascularization. Post-subtraction ΔFFR-CT may provide a new method for clinical judgment of revascularization. When the post-subtraction ΔFFR-CT of stenosis segment is > 0.11, the possibility of early revascularization should be evaluated clinically.
Disclosure statement
No potential conflict of interest was reported by the author(s).
Additional information
Funding
References
- Coenen A, Lubbers MM, Kurata A, et al. Fractional flow reserve computed from noninvasive CT angiography data: diagnostic performance of an on-site clinician-operated computational fluid dynamics algorithm. Radiology. 2015;274(3):674–683. doi:10.1148/radiol.14140992.
- Tavoosi A, Kadoya Y, Chong AY, et al. Utility of FFRCT in Patients with Chest Pain. Curr Atheroscler Rep. 2023;25(8):427–434. doi:10.1007/s11883-023-01117-y.
- Rudzinski PN, Kruk M, Debski M, et al. Can the application of fractional flow reserve computed tomography in high-risk patients with chronic coronary syndrome obviate downstream diagnostic invasive coronary procedures? J Thorac Imaging. 2023;38(5):W77–W78. doi:10.1097/RTI.0000000000000727.
- Koo B-K, Erglis A, Doh J-H, et al. Diagnosis of ischemia-causing coronary stenoses by noninvasive fractional flow reserve computed from coronary computed tomographic angiograms. Results from the prospective multicenter DISCOVER-FLOW (Diagnosis of Ischemia-Causing Stenoses Obtained Via Noninvasive Fractional Flow Reserve) study. J Am Coll Cardiol. 2011;58(19):1989–1997. doi:10.1016/j.jacc.2011.06.066.
- Tang CX, Liu CY, Lu MJ, et al. CT FFR for ischemia-specific CAD with a new computational fluid dynamics algorithm: a chinese multicenter study. JACC Cardiovascular Imaging. 2020;13(4):980–990. doi:10.1016/j.jcmg.2019.06.018.
- Douglas PS, De Bruyne B, Pontone G, et al. 1-year outcomes of FFRCT-guided care in patients with suspected coronary disease: the PLATFORM study. J Am Coll Cardiol. 2016;68(5):435–445. doi:10.1016/j.jacc.2016.05.057.
- Nørgaard BL, Hjort J, Gaur S, et al. Clinical use of coronary CTA-derived FFR for decision-making in stable CAD. JACC Cardiovasc Imaging. 2017;10(5):541–550. doi:10.1016/j.jcmg.2015.11.025.
- Tang CX, Qiao HY, Zhang XL, et al. Functional CAD-RADS using FFRCT on therapeutic management and prognosis in patients with coronary artery disease. Eur Radiol. 2022;32(8):5210–5221. doi:10.1007/s00330-022-08618-5.
- Vavere AL, Arbab-Zadeh A, Rochitte CE, et al. Coronary artery stenoses: accuracy of 64-detector row CT angiography in segments with mild, moderate, or severe calcification–a subanalysis of the CORE-64 trial. Radiology. 2011;261(1):100–108. doi:10.1148/radiol.11110537.
- Mickley H, Veien KT, Gerke O, et al. Diagnostic and clinical value of FFR(CT) in stable chest pain patients with extensive coronary calcification: the FACC study. JACC Cardiovasc Imaging. 2022;15(6):1046–1058. doi:10.1016/j.jcmg.2021.12.010.
- Fujimoto S, Kawasaki T, Kumamaru KK, et al. Diagnostic performance of on-site computed CT-fractional flow reserve based on fluid structure interactions: comparison with invasive fractional flow reserve and instantaneous wave-free ratio. Eur Heart J Cardiovasc Imaging. 2019;20(3):343–352. doi:10.1093/ehjci/jey104.
- Kawaguchi YO, Fujimoto S, Kumamaru KK, et al. The predictive factors affecting false positive in on-site operated CT-fractional flow reserve based on fluid and structural interaction. Int J Cardiol Heart Vasc. 2019;23:100372. doi:10.1016/j.ijcha.2019.100372.
- Yoshioka K, Tanaka R, Muranaka K. Subtraction coronary CT angiography for calcified lesions. Cardiol Clin. 2012;30(1):93–102. doi:10.1016/j.ccl.2011.10.004.
- Fuchs A, Kühl JT, Chen MY, et al. Subtraction CT angiography improves evaluation of significant coronary artery disease in patients with severe calcifications or stents-the C-Sub 320 multicenter trial. Eur Radiol. 2018;28(10):4077–4085. doi:10.1007/s00330-018-5418-y.
- Yamaguchi T, Ichikawa K, Takahashi D, et al. A New Contrast Enhancement Protocol for Subtraction Coronary Computed Tomography Requiring a Short Breath-Holding Time. Acad Radiol. 2017;24(1):38–44. doi:10.1016/j.acra.2016.08.025.
- Leipsic J, Abbara S, Achenbach S, et al. SCCT guidelines for the interpretation and reporting of coronary CT angiography: a report of the Society of Cardiovascular Computed Tomography Guidelines Committee. J Cardiovasc Comput Tomogr. 2014;8(5):342–358. doi:10.1016/j.jcct.2014.07.003.
- Agatston AS, Janowitz WR, Hildner FJ, et al. Quantification of coronary artery calcium using ultrafast computed tomography. J Am Coll Cardiol. 1990;15(4):827–832. doi:10.1016/0735-1097(90)90282-t.
- Qiao J, Li S, Yang H, et al. Subtraction improves the accuracy of coronary ct angiography in patients with severe calcifications in identifying moderate and severe stenosis: a multicenter study. Acad Radiol. 2023;30(12):2801–2810. doi:10.1016/j.acra.2022.11.033.
- Takagi H, Leipsic JA, McNamara N, et al. Trans-lesional fractional flow reserve gradient as derived from coronary CT improves patient management: ADVANCE registry. J Cardiovasc Comput Tomogr. 2022;16(1):19–26. doi:10.1016/j.jcct.2021.08.003.
- Kamo Y, Fujimoto S, Nozaki YO, et al. Incremental diagnostic value of CT fractional flow reserve using subtraction method in patients with severe calcification: A pilot study. J Clin Med. 2021;10(19):4398. doi:10.3390/jcm10194398.
- Hlatky MA, De Bruyne B, Pontone G, et al. Quality-of-life and economic outcomes of assessing fractional flow reserve with computed tomography angiography: PLATFORM. J Am Coll Cardiol. 2015;66(21):2315–2323. doi:10.1016/j.jacc.2015.09.051.
- Doris MK, Otaki Y, Arnson Y, et al. Non-invasive fractional flow reserve in vessels without severe obstructive stenosis is associated with coronary plaque burden. J Cardiovasc Comput Tomogr. 2018;12(5):379–384. doi:10.1016/j.jcct.2018.05.003.
- Ilic I, Timcic S, Odanovic N, et al. Serial stenosis assessment-can we rely on invasive coronary physiology. Front Cardiovasc Med. 2023;10:1172906. doi:10.3389/fcvm.2023.1172906.
- Fuchs A, Kühl JT, Chen MY, et al. Feasibility of coronary calcium and stent image subtraction using 320-detector row CT angiography. J Cardiovasc Comput Tomogr. 2015;9(5):393–398. doi:10.1016/j.jcct.2015.03.016.
- Kwan AC, Gransar H, Tzolos E, et al. The accuracy of coronary CT angiography in patients with coronary calcium score above 1000 Agatston Units: comparison with quantitative coronary angiography. J Cardiovasc Comput Tomogr. 2021;15(5):412–418. doi:10.1016/j.jcct.2021.03.007.
- Gulati M, Levy PD, Mukherjee D, et al. 2021 AHA/ACC/ASE/CHEST/SAEM/SCCT/SCMR guideline for the evaluation and diagnosis of chest pain: A report of the american college of cardiology/american heart association joint committee on clinical practice guidelines. J Am Coll Cardiol. 2021;78(22):e187–e285. doi:10.1016/j.jacc.2021.07.053.