
Abstract
Objective: The software application FOX (‘Fitting to Outcome eXpert’) is an intelligent agent to assist in the programing of cochlear implant (CI) processors. The current version utilizes a mixture of deterministic and probabilistic logic which is able to improve over time through a learning effect. This study aimed at assessing whether this learning capacity yields measurable improvements in speech understanding.
Methods: A retrospective study was performed on 25 consecutive CI recipients with a median CI use experience of 10 years who came for their annual CI follow-up fitting session. All subjects were assessed by means of speech audiometry with open set monosyllables at 40, 55, 70, and 85 dB SPL in quiet with their home MAP. Other psychoacoustic tests were executed depending on the audiologist's clinical judgment. The home MAP and the corresponding test results were entered into FOX. If FOX suggested to make MAP changes, they were implemented and another speech audiometry was performed with the new MAP.
Results: FOX suggested MAP changes in 21 subjects (84%). The within-subject comparison showed a significant median improvement of 10, 3, 1, and 7% at 40, 55, 70, and 85 dB SPL, respectively. All but two subjects showed an instantaneous improvement in their mean speech audiometric score.
Discussion: Persons with long-term CI use, who received a FOX-assisted CI fitting at least 6 months ago, display improved speech understanding after MAP modifications, as recommended by the current version of FOX. This can be explained only by intrinsic improvements in FOX's algorithms, as they have resulted from learning. This learning is an inherent feature of artificial intelligence and it may yield measurable benefit in speech understanding even in long-term CI recipients.
Introduction
Cochlear implant (CI) sound processors have many adjustable parameters (T-level, C-level, Gain, Loudness Growth, T-SPL, C-SPL, Dynamic Range, Sensitivity, etc.) which result in millions of possibilities to customize the speech processor. Such a set of parameters is commonly referred to as the patient's MAP. Fine-tuning of these parameters, commonly called CI-fitting, is important for the auditory performance of the individual CI recipient. The MAP and test outcomes are patient-specific, even within a relatively homogenous group of CI recipients. Huge variation has been described between the optimal MAPs of different CI recipients and predictive models, and identified influence factors account for only a portion of this variation (CitationBlamey et al., 1996, Citation2013; CitationRoditi et al., 2009). Furthermore, a recent global inventory has shown that CI fitting is often based on user comfort rather than hard outcome measures (CitationVaerenberg et al., 2014b). Indeed, measurable targets are often defined only for pure tone audiometry in many CI centers, while auditory performance consists of much more than just sound detection. Therefore, it comes as no surprise that there is no standardized approach to fit a CI sound processor. There exists a large variability between different CI centers on many aspects of the fitting strategy in both start-up procedures and annual follow-up. Hence, many audiologists have developed their own heuristics over the years based on personal experience (CitationVaerenberg et al., 2014b). Furthermore, CI manufacturers provide only basic guidelines on how to fit their CIs. The last few years, CI fitting based on objective measures, such as evoked compound action potentials or stapedial reflex thresholds, has received a lot of attention in an attempt to correlate these thresholds with processor parameters (CitationBrown et al., 2000). However, to date results are mixed as correlation coefficients are often rather modest and not always a reliable indicator of psychophysical results (CitationBriaire et al., 2016; CitationJi et al., 2014). In contrast to these common practices, we have developed an outcome-driven and computer-assisted approach, where CI fitting is driven by measurable outcomes and targets based on psychoacoustic tests (CitationVaerenberg et al., 2014a). Artificial Intelligence (AI) was introduced to cope with the complexity of the CI processor behavior and to assure more systematic and standardized methods of CI fitting. The corresponding software application was called FOX (Fitting to Outcomes eXpert) (CitationGovaerts et al., 2010).
The first generation of FOX (hereafter referred to as FOX1G) was developed to adjust processor parameters in a systematic way by means of a set of deterministic rules that were used to analyze and optimize the patient's MAP settings. The working principle of this first generation of FOX has been discussed in a previous paper (CitationGovaerts et al., 2010). In brief, FOX1G received patients' psychoacoustic outcomes (see further) together with the corresponding MAP settings. For each of the outcome measures, targets were defined for the auditory performance of the patient. If a test target was not reached, then the MAP settings and performance were considered to be below optimum and FOX would recommend MAP changes to bring the results closer to target. Clinical studies have shown that FOX was successful in systematically improving the results of the psychoacoustic test outcomes (audiometric thresholds, A§E phoneme discrimination, A§E loudness scaling, speech audiogram), especially in the first few months after switch on (CitationVaerenberg et al., 2011, Citation2014a). A prospective multicenter randomized controlled trial showed that the speech audiometric results 6 months after switch-on with a target-driven, FOX-assisted approach was equivalent to or better than a conventional manual approach (CitationBattmer et al., 2015). Even in long-term and well-fitted subjects, FOX has improved the measurable outcomes in seven out of 10 cases (CitationBuechner et al., 2014).
In the meantime, FOX2G (second generation) was developed to also introduce probabilistic logic (CitationBermejo et al., 2013; CitationBermejo, 2015; CitationVaerenberg, 2014). In brief, after having analyzed the current MAP and the test results obtained with this MAP, FOX2G generates millions of new MAPs by permutating the values of all MAP parameters which are accessible in the proprietary fitting software CustomSound (Cochlear Ltd, Sydney, Australia) and Soundwave (Advanced Bionics, Valencia, CA, USA). For the Cochlear Nucleus device, this is T-level, C-level, Gain, T-SPL, C-SPL, Loudness Growth, Pulsewidth, and the inactivation of electrodes. For the AB device, this is T-level, M-level, Gain, Dynamic Range, Sensitivity, Pulsewidth, and the inactivation of electrodes. Bayesian networks and influence diagrams (CitationRussell and Norvig, 2003a) predict the new outcomes for each new MAP in a probabilistic manner. A utility function (CitationRussell and Norvig, 2003b) then maps the predicted outcome onto a real number which describes the associated appreciation and allows to rank the different MAPs in order of appreciated benefit. The MAP with the highest overall utility is then recommended to the audiologist who judges it before putting it into the processor of the CI recipient. In essence, this working principle is comparable to a car navigation system that knows the current position and the target, then generates millions of possible trajectories and calculates for each trajectory its cost in terms of time or distance, etc. A first advantage of a probabilistic approach is that it is more suited to cope for the large biological variability across subjects and cognitive processes by adding uncertainty and likelihood. A second advantage is that it can analyze many millions of MAPs in a matter of seconds and that for each new MAP it can predict the patients' test outcomes in a probabilistic manner. In addition, FOX is able to manipulate more parameters than those commonly adjusted by most CI audiologists: fitting procedures are often restricted to adjusting T- and C-levels (CitationVaerenberg et al., 2014b), while global parameters such as the loudness growth function (Q), input dynamic range (IDR), and others are often left untouched because of the lack of published guidelines regarding these parameters. Finally, FOX has the ability to improve over time by comparing its predicted test outcomes with the observed outcomes and changing the underlying tables and algorithms to make future predictions more accurate. At this stage, this learning is instigated manually by expert audiologists and AI engineers who run machine learning algorithms on the database on a regular basis. It is expected that this process will be automated in the near future.
Such systematic machine learning is new in the concept of CI fitting and can be considered a cornerstone of AI. The purpose of this study is to evaluate whether this learning capacity of FOX2G yields measurable improvements in outcome. For this, we took long-term CI recipients who have been wearing their CI typically for several years and who were coming to the clinic for a routine annual visit. In general, these users have already well-adjusted MAPs created by the version of FOX2G of 1 year earlier. We then investigated whether FOX2G was capable of creating incremental benefit in auditory performance. We, therefore, measured speech audiometry with the old MAP, asked FOX2G to propose a new MAP, and measured speech audiometry again.
Material and methods
Subjects
A retrospective analysis was performed on all CI recipients who came to our clinic for their annual follow-up in a 10-week period between two FOX machine-learning moments. This guaranteed that all MAP changes were realized by the same version of FOX2G. Exclusion criteria were as follows:
Subjects with less than 1 year of CI experience to make sure that only long-term users entered the study.
Subjects younger than 6 years of age because open set ‘adult’ monosyllable speech audiometry may not be reliable at too young an age.
Subjects who had undergone a fitting session within 6 months prior to this study. This is because the objective is to investigate the learning effect of FOX2G by comparing the results from the previous FOX2G fitting to the current FOX2G results. This learning effect is smaller if the interval between both sessions is short.
Subjects with MED-EL or Neurelec implants. At this moment, FOX is only compatible with Cochlear and Advanced Bionics (AB) devices.
Audiological evaluation
Our annual visit, evaluation protocol comprises at least speech audiometry, which may be complemented by one or more of the other psychoacoustic tests (Tonal Audiometry, Spectral Discrimination, Loudness Growth Function) which have been described in more detail in CitationGovaerts et al. (2010) and CitationVaerenberg et al. (2011). The choice of whether or not to add these complementary tests is left to the audiologist's discretion. In this study group, most patients underwent audiometry, loudness scaling and speech audiometry, while spectral discrimination was performed in eight recipients (see Result section for details). All tests were executed in a sound-treated room with test sounds presented in sound field conditions. The A§E psychoacoustic test suite (Otoconsult NV, Antwerp, Belgium) was used to perform the test battery (CitationGovaerts et al., 2006). All tests were performed with the Autosensitivity function ON, SCAN off and ADRO OFF, Wind noise OFF for Nucleus processors, and Clearvoice switched ON (medium) for AB processors.
Sound field audiometry
Thresholds were determined with warble tones presented at 250, 500, 1000, 2000, 4000, and either 6000 or 8000 Hz, depending on the device. Cochlear devices have upper band widths limited to 7938 Hz, making 8000 Hz signals unreliable for test purposes.
Spectral discrimination
A§E phoneme discrimination was performed using up to 20 speech sound contrasts (a-r, u-ʃ, u-a, u-i, i-a, o-a, i-ε, m-z, s-ʃ, ε-a, u-o, ə-a, ə-o, ə-ε, ə-i, z-s, v-z, ə-u, u-y, y-i), presented at 70 dB HL in an oddity paradigm (see (CitationGovaerts et al., 2006) for test details). A result of yes or no was recorded for the discrimination of each contrast (For more details: https://youtu.be/c8XV5KUhc1I).
Loudness growth function
The A§E loudness scaling test was performed using one-third octave narrow band noises centered at 250, 1000, and 4000 Hz. The 1876 ms stimulus was presented twice at each level and the loudness scored on a visual analogue scale ranging from 0 (inaudible) to 6 (too loud). Levels were randomly presented at 5 dB increments between 30 and 80 dB HL (For more details: https://youtu.be/QRLUHieK_EM).
Speech audiometry
Twenty-four monosyllabic CVC words (NVA Vlaams) (CitationWouters et al., 1995) were presented at 40, 55, 70, and 85 dB SPL and the percentage of correctly repeated phonemes was registered. The average of the scores at the four presentation levels was calculated.
MAP optimization with FOX2G
All CI recipients underwent a typical annual follow-up fitting session in our clinic. The tests described above were executed once. The test results, together with the corresponding MAP, were entered into FOX. The intelligent agent then generated millions of new MAPS and for each MAP it calculated whether it was likely to create better outcomes. If so, the MAP with the best prediction was recommended to the audiologist. Otherwise, FOX concluded not being able to find a better MAP to propose. If a new MAP was recommended, the audiologist accepted this and programed it to the sound processor. No manual modifications were applied. Speech audiometry was then repeated with this new MAP.
Statistics
Nonparametric statistics were used for the analysis of data, with Tukey's five parameters (median, lower and upper quartiles, and lower and upper extremes) and box and whisker plots for descriptive statistics (CitationGovaerts et al., 1998; CitationTukey, 1977). Wilcoxon-matched pairs tests were used for analytical statistics to perform a within-subject comparison of speech audiometric results before and after MAP changes. A cut-off level (P-level) of 0.05 was used for statistical significance.
Results
Twenty-five otherwise unselected CI recipients met the inclusion criteria. Demographic details of the 25 subjects are given in Table . The median age was 31.5 years (range 10.3–81.8), with a median CI experience of 9.8 years (range 1.8–16.5) and a median interval of 13 months from the previous fitting (range 6–31). Fourteen subjects had a Nucleus device and eleven had an AB device, with the majority of them having either a CP910 sound processor (Nucleus) or a Naída CI Q70 processor (AB).
Table 1 Demographic details of the study participants
All subjects underwent speech audiometry and almost all audiometry (n = 24) and loudness scaling at 250, 1000, and 4000 Hz (n = 21) (Table ). Eight subjects also underwent the spectral discrimination task. This task is known to show a ceiling effect in many subjects soon after implantation, making it less relevant at later evaluation moments. These results were entered into FOX2G. After the analysis of the home MAP and the measured outcome, FOX2G refrained from recommending a MAP change in four subjects (S22-S25). This is because after analyzing between 1 and 24 million newly generated MAPs, FOX2G could not find a MAP configuration that predicted to significantly improve the results of the subject. The other 21 subjects received a newly proposed MAP by FOX2G. This was after analyzing a median number of 9 million (range 6–32) newly generated MAPs. The new MAP was programed into the speech processor and speech audiometry was assessed again. The speech audiometric results with the home MAP and the newly created MAP are given in Table and Fig. . The within-subject improvements are depicted in Fig. . At each presentation level, the within-subject improvement was statistically significant with median improvements of 10, 3, 1, and 7% at 40, 55, 70, and 85 dB SPL, respectively (40 dB SPL: Z = 2.9, P < 0.005; 55 dB SPL: Z = 2.1, P < 0.05; 70 dB SPL. Z = 1.99, P < 0.05; 85 dB SPL: Z = 2.05, P < 0.05). Table shows a list of the different MAP parameters and for each how often it was modified by FOX. The loudness growth parameter (Q) of the Nucleus processors, for example, was modified in 9 out of the 11 Nucleus recipients which accounts for 82%. The threshold level (T) is modified in 89% of the enabled electrodes over all 21 patients.
Figure 1 Box and whisker plots of the speech audiometry results before (light gray) and after (black) the FOX fitting. The Box and whiskers represent the median (square), interquartile range (box) non-outlier range (whiskers), and outliers (dots) for each group, calculated as in CitationGovaerts et al. (1998). An outlier is defined as any value that lies more than one and a half times the length of the box from either end of the box.
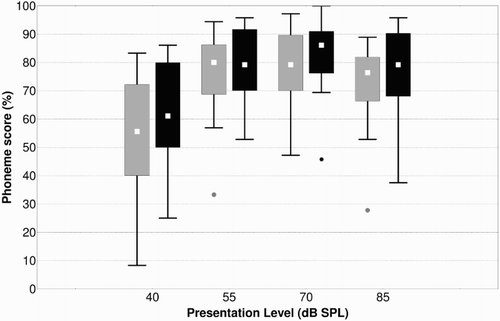
Figure 2 Box and whisker plots of the within-subject gains at each intensity level.
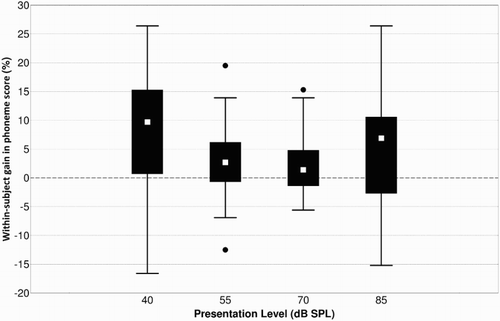
Table 2 Tests that each subject has performed in addition to the speech audiometry test
Table 3 Phoneme scores before and after the FOX-assisted fitting
Table 4 Prevalence of MAP parameter changes
Discussion
CI fitting is the art of finding the optimal MAP for any given CI recipient. This requires insight in the underlying CI technology, competence in psychoacoustics, and knowledge about the impact of the MAP parameters on the processing of sound. Theoretically, the best settings can be determined by functional measurements that can be made for each patient and for all possible MAPs (CitationBaskent et al., 2007). Since this would not be realistic, AI may offer fast, systematic, and flexible optimization algorithms (CitationBaskent et al., 2007; CitationDurant et al., 2004; CitationEiler et al., 2008; CitationWakefield et al., 2005). AI is a novel domain on its own and still in full expansion. Its typical embodiment consists of a black box software application that optimizes the process of bringing an object from a current state to a set target. For CI fitting, the ‘current state’ is assessed by means of psychoacoustic measures, while targets are defined as normal values. The algorithms in the black box are complex and require computational power beyond the capacity of a human brain. They consist of networks with nodes, links, layers, and inferences between many components that have a role in the relationship between a MAP and the measured outcome. This relationship is very variable between different CI users and even between different moments in time within one CI user. The factors that are responsible for this variability are unknown to a great extent. Probabilistic algorithms cope for this variation. They predict psychoacoustic outcome as a function of a MAP and in a probabilistic way.
AI also comes with learning, whereby the AI logic and probabilistic tables change over time by comparing the observed with the predicted results. In consequence, FOX2G becomes more accurate over time in predicting the outcome of a new MAP and so does the selection of the ‘best’ MAP, as defined by its capacity to achieve target outcome. As mentioned in the introduction, this machine learning is not yet fully autonomous in the current version of FOX2G. It still requires manual intervention and verification and new, ‘optimized’ versions of FOX2G are released on a regular basis. It is fair to assume that, whereas each optimized version may hardly display noticeable benefits in terms of predictive accuracy, the incremental benefit of multiple learning steps over a period of several months or a year should become noticeable. This study aimed to assess the impact of such learning by comparing, in an acute evaluation, the speech audiometric results in experienced CI recipients obtained with a MAP delivered by a FOX2G version of 1 year ago to one delivered by the latest FOX2G version.
The median length of CI experience of the 21 patients who received a new MAP was 9.7 years (range 2.1 and 16.5 years). All subjects received their last follow-up fitting session at least 6 months ago, which means they received the best MAP which our audiologist, assisted by the FOX2G version of that moment, could give. In the current fitting session, the median within-subject increments (Fig. ) are statistically significant at all presentation levels (Table ). In case of a phoneme score deterioration at a certain presentation level as expressed by the negative gains, as shown in Fig. , this was almost always accompanied with a larger improvement at one or more of the other presentation levels. Hence the increment of the average index was positive and statistically significant (Table ) for all but two subjects (S12 and S14). Subject S12 had a small roll-over with a score of 82% at 85 dB SPL compared to 89% at 70 dB SPL. FOX2G increased most of the C-levels, increased the T-levels in the high frequencies, and decreased them in the low frequencies. This improved the score to 89% at 85 dB and thus reduced the roll-over, but at the detriment of the scores at the other presentation levels, which went down by 1–7%. Subject S14 had a better score at 40 and 85 dB SPL than at 55 and 70 dB SPL. FOX2G increased most of the C-levels, decreased most of the T-levels, changed the Loudness Growth from 18 to 20, T-SPL from 20 to 22, and C-SPL from 70 to 65. As a result of these changes, the score at 85 dB SPL decreased with 15%, while at the other presentation levels, there was hardly a change. Both subjects received the new MAP to take home nevertheless, but, as for all other subjects, the previous MAP also stayed in the processor, so everyone was free to revert to the old MAP if this was appreciated more. It is our opinion that, even if two out of 25 subjects would experience a minor deterioration in speech understanding, 19 of them benefiting from the new MAP would still be a positive trade-off. It is noteworthy that deterioration at certain intensities was most of the times within the predicted probability density distribution of FOX2G and thus it was taken into account while calculating the best possible MAP for the patient. The within-subject gains are largest at 40 and 85 dB with a median increment of 10 and 7%, respectively. The intensity range of 60–70 dB SPL is considered to be the range of normal conversation in silence and this is commonly regarded as the most important and sometimes only point to optimize during CI fitting. However, the performance at low- and high-intensity levels can also be valuable for daily functioning of a CI patient in real life. Therefore, we believe it is worthwhile to invest time and effort to optimize these points too.
One can argue whether an average improvement in phoneme score of 4.6% (the average of the within-subject improvements of the average scores on the four presentation levels), even if statistically very significant (P < 0.001), has any clinical relevance. One should bear in mind that our subjects had an average use experience of almost 10 years and that it is unlikely to find ‘spontaneous’ improvements in two consecutive speech audiometries during the same session. This could only be attributed to an instantaneous learning effect. But these subjects have done the same speech audiometry many times before and during the same session, we always make sure not to present the same lists twice. Instantaneous learning due to knowledge of the speech stimuli, therefore, is rather unlikely. On the other hand, one speech audiometric evaluation takes 4 × 24 words, so the second evaluation can be assumed to suffer from fatigue and be biased downwards rather than upwards. In addition, ongoing research of ours indicates that average speech audiometric scores have improved with roughly 20% over the last 8 years (unpublished data). This still needs to be confirmed by more detailed analyses, but it points into the same direction that there may well be an incremental benefit which is attributable to AI-related machine learning.
Alternative explanations are difficult to underpin. As said earlier, the improvement in speech performance cannot be attributed to the learning effect from patient's cognitive function. Also, the type of speech processor was eliminated as a possible parameter as both speech tests were always performed with the same processor and microphone. Therefore, the improvement in speech recognition can only be attributed to the learning capacities of FOX2G resulting in more accurate calculations of the best possible MAP with the most up-to-date algorithms.
The MAP parameter adjustments made by FOX2G are often subtle, with sometimes parameter adjustments of only a few clinical units. Also, FOX2G often modified a number of parameters that are typically left untouched by most audiologists (Table ). These adjustments reflect a degree of accuracy and insight which is difficult for human intervention to achieve. It is very challenging, at this moment, to understand or explain the impact of MAP changes on speech audiometric results. This is because we hardly understand the role of the different electrical components at the cochlear interface, constituting the electrical pattern on the acoustical nerve. To the best of our knowledge, the relationship between patient speech perception performance and CI fitting procedures is not well documented in the literature, apart from a few speech-based optimization procedures, like CitationHolmes et al. (2012), yielding promising results in experienced users. AI seems to offer a toolkit to design a black box containing some relevant elements and relationships and suggesting MAP changes that may assist the expert audiologist in optimizing the hearing performance of the CI user. At present, AI is still in its early stages of development and this is especially the case in the domain of CI fitting. Many of the observations in this stage may be difficult to explain, but the authors believe that the observations on their own are fascinating and relevant and a necessary first step for further research and development. It can be anticipated that future research will focus on the analysis of the accumulated data over time in an attempt to gain new insight in the underlying electrophysiology of hearing and to find answers to the many questions which remain unanswered to date.
In CitationVargas et al. (2012) and CitationVaerenberg et al. (2014b), it is argued that manual parameter programing is mainly done within the first few months after switch-on and at about 6 months the MAP settings tend to stabilize in most CI centers. After that, annual visits are often planned for microphone and processor check-up and continuous guidance of the patient rather than for modifying MAP settings as it is commonly accepted that the MAP is optimal at this stage. Although it is very plausible that trained audiologists exhibit a learning curve over time due to increasing experience, such learning has never been shown formally to result in improved outcome. The current observation that there still seems to be room for improvement in established users is an interesting one. These outcomes support our vision that CI fitting is a life-long commitment toward the patient and progress can be made even after many years of CI use. Moreover, the limits of FOX2G seem to be far from reached, since it only represents the first introduction of AI in our domain. For instance, whereas learning to date has to be instigated case wise by an expert audiologist, techniques exist to automate this. It is our intention to implement such automated self-learning methods in the near future. As already mentioned in the introduction, FOX1G was already able to reach preset targets and achieve a level of auditory performance equivalent to manual fitting. This study shows that FOX2G further improves the outcome in a measurable way. It is our belief that in view of the intrinsic complexity of CI behavior and its interaction with human psychoacoustics, the expert audiologist assisted by an intelligent agent like FOX2G will ultimately yield better and more predictable results than the audiologist on his or her own.
Conclusion
In summary, the second generation of FOX, like its precursor, encompasses a target-driven, systematic way of assisting the CI audiologist in fitting CI processors. The authors believe that such systematic approach is highly necessary to reduce the variability and randomness across CI fitters. Thanks to the learning effect of FOX2G, there is a significant gain in speech scores in long-term users, illustrating that there is still room for improvement even after many years of CI use. The integration of a fully automated self-learning engine, in the near future, will allow further fine-tuning of the underlying FOX logic based on the outcomes of patients in the clinic. In this way, there is a possibility that speech performance will be optimized even further in established users.
Disclaimer statements
Contributors None.
Funding None.
Conflicts of interest The Eargroup receives royalties and has ongoing research grants on A§E and FOX. The current study was conducted on own budget and was not supported by any grant.
Ethics approval None.
ORCID
Matthias Meeuws http://orcid.org/0000-0002-4122-5607
David Pascoal http://orcid.org/0000-0002-5321-1712
Iñigo Bermejo http://orcid.org/0000-0001-9105-8088
Miguel Artaso http://orcid.org/0000-0002-4458-5616
Geert De Ceulaer http://orcid.org/0000-0003-2639-2578
Paul J. Govaerts http://orcid.org/0000-0002-9519-9002
References
- Baskent, D., Eiler, C.L., Edwards, B. 2007. Using genetic algorithms with subjective input from human subjects: implications for fitting hearing aids and cochlear implants. Ear and Hearing, 28(3): 370–380. doi: 10.1097/AUD.0b013e318047935e
- Battmer, R.D., Borel, S., Brendel, M., Büchner, A., Cooper, H., Fielden, C., et al. 2015. Assessment of “Fitting to Outcomes Expert” FOX with new cochlear implant users in a multicentric study. Cochlear Implants International, 16(2): 100–109. doi: 10.1179/1754762814Y.0000000093
- Bermejo, I. 2015. New types of probabilistic graphical models. Applications to medicine [PhD thesis]. Madrid: Universidad Nacional de Educación a Distancia (UNED).
- Bermejo, I., Diez, F.J., Govaerts, P.J., Vaerenberg, B. 2013. A probabilistic graphical model for tuning cochlear implants. In: Marin Morales R, Peleg M, Peek N, (eds.) Artificial intelligence in medicine. Berlin-Heidelberg: Springer-Verlag, p. 150–155.
- Blamey, P., Arndt, P., Bergeron, F., Bredberg, G., Brimacombe, J., Facer, G., et al. 1996. Factors affecting auditory performance of postlinguistically deaf adults using cochlear implants. Audiology & Neurotology, 1(5): 293–306. doi: 10.1159/000259212
- Blamey, P., Artieres, F., Başkent, D., Bergeron, F., Beynon, A., Burke, E., et al. 2013. Factors affecting auditory performance of postlinguistically deaf adults using cochlear implants: an update with 2251 patients. Audiology & Neurotology, 18(1): 36–47. doi: 10.1159/000343189
- Briaire, J.J., de Vos, J.J., Biesheuvel, J.D., Boot, P.S., van Gendt, M.J., Dekkers, O.M., et al. 2016. Use of electrically evoked compound action potentials for cochlear implant fitting, a systematic review. In 9th international symposium on objective measures in auditory implants, Szeged, Hungary.
- Brown, C.J., Hughes, M.L., Luk, B., Abbas, P.J., Wolaver, A., Gervais, J. 2000. The relationship between EAP and EABR thresholds and levels used to program the nucleus 24 speech processor: data from adults. Ear and Hearing, 21(2): 151–163. doi: 10.1097/00003446-200004000-00009
- Buechner, A., Vaerenberg, B., Gazibegovic, D., Brendel, M., De Ceulaer, G., Govaerts, P., et al. 2014. Evaluation of the ‘Fitting to Outcomes Expert’ FOX with established cochlear implant users. Cochlear Implants International, 16(1): 39–46. doi: 10.1179/1754762814Y.0000000085
- Durant, E., Wakefield, G.H., Van Tasell, D., Rickert, M. 2004. Efficient perceptual tuning of hearing aids with genetic algorithms. IEEE Transactions on Speech and Audio Processing, 12(2): 144–155. doi: 10.1109/TSA.2003.822640
- Eiler, C., Baskent, D., Recker, K., Edwards, B. 2008. Genetic algorithms: are they the future of hearing aid fittings? The Hearing Journal, 61(12): 16–18. doi: 10.1097/01.HJ.0000343021.84357.78
- Govaerts, P.J., Somers, T., Offeciers, E. 1998. Box and whisker plots for graphic presentation of audiometric results of conductive hearing loss treatment. Otolaryngology Head and Neck Surgery, 118(6): 892–895. doi: 10.1016/S0194-5998(98)70293-1
- Govaerts, P.J., Daemers, K., Yperman, M., De Beukelaer, C., De Saegher, G., De Ceulaer, G. 2006. Auditory speech sounds evaluation (A§e): a new test to assess detection, discrimination and identification in hearing impairment. Cochlear Implants International, 7(2): 92–106. doi: 10.1179/146701006807508106
- Govaerts, P.J., Vaerenberg, B., De Ceulaer, G., Daemers, K., De Beukelaer, C., Schauwers, K. 2010. Development of a software tool using deterministic logic for the optimization of cochlear implant processor programming. Otology & Neurotology, 31(6): 908–918. doi: 10.1097/MAO.0b013e3181dd160b
- Holmes, A.E., Shrivastav, R., Krause, L., Siburt, H.W., Schwartz, E. 2012. Speech based optimization of cochlear implants. International Journal of Audiology, 51(11): 806–816. doi: 10.3109/14992027.2012.705899
- Ji, F., Liu, K., Yang, S. 2014. Clinical application of electrically evoked compound action potentials. Journal of Otology, 9: 117–121. doi: 10.1016/j.joto.2014.11.002
- Roditi, R.E., Poissant, S.F., Bero, E.M., Lee, D.J. 2009. A predictive model of cochlear implant performance in postlingually deafened adults. Otology & Neurotology, 30(4): 449–454. doi: 10.1097/MAO.0b013e31819d3480
- Russell, S., Norvig, P. 2003a. Chapter 15 “Probabilistic reasoning systems”. In Artificial intelligence. A modern approach. Englewood Cliffs, NJ: Prentice Hall, p. 436–471.
- Russell, S., Norvig, P. 2003b. Chapter 16 “Making simple decisions”. In Artificial intelligence. A modern approach. Englewood Cliffs, NJ: Prentice Hall, p. 471–498.
- Tukey, J.W. 1977. Exploratory data analysis. Reading, MA: Addison-Wesley.
- Vaerenberg, B. 2014. Programming cochlear implants for auditory performance [PhD thesis]. Antwerp: University of Antwerp.
- Vaerenberg, B., Govaerts, P.J., De Ceulaer, G., Daemers, K., Schauwers, K. 2011. Experiences of the use of FOX, an intelligent agent, for programming cochlear implant sound processors in new users. International Journal of Audiology, 50(1): 50–58. doi: 10.3109/14992027.2010.531294
- Vaerenberg, B., De Ceulaer, G., Szlávik, Z., Mancini, P., Buechner, A., Govaerts, P.J. 2014a. Setting and reaching targets with computer-assisted cochlear implant fitting. The Scientific World Journal, 2014: Article ID 646590.
- Vaerenberg, B., Smits, C., De Ceulaer, G., Zir, E., Harman, S., Jaspers, N., et al. 2014b. Cochlear implant programming: a global survey on the State of the Art. The Scientific World Journal, 2014: Article ID 501738.
- Vargas, J.L., Sainz, M., Roldan, C., Alvarez, I., de la Torre, A. 2012. Long-term evolution of the electrical stimulation. Clinical and Experimental Otorhinolaryngology, 5(4): 194–200. doi: 10.3342/ceo.2012.5.4.194
- Wakefield, G.H., van den Honert, C., Parkinson, W., Lineaweaver, S. 2005. Genetic algorithm for adaptive psychophysical procedures: recipient-directed design of speech processor MAP's. Ear and Hearing, 26(4): 57–72. doi: 10.1097/00003446-200508001-00008
- Wouters, J., Damman, W., Bosmans, A. 1995. Evaluation of Flemish-Dutch materials for speech audiometry. In Proceedings of the European Conference on Audiology; Noorderwijkerhout, The Netherlands, pp. 417–420.