
Abstract
Objectives: This study aimed to improve access to high-frequency interaural level differences (ILD), by applying extreme frequency compression (FC) in the hearing aid (HA) of 13 bimodal listeners, using a cochlear implant (CI) and conventional HA in opposite ears.
Design: An experimental signal-adaptive frequency-lowering algorithm was tested, compressing frequencies above 160 Hz into the individual audible range of residual hearing, but only for consonants (adaptive FC), thus protecting vowel formants, with the aim to preserve speech perception. In a cross-over design with at least 5 weeks of acclimatization between sessions, bimodal performance with and without adaptive FC was compared for horizontal sound localization, speech understanding in quiet and in noise, and vowel, consonant and voice-pitch perception.
Results: On average, adaptive FC did not significantly affect any of the test results. Yet, two subjects who were fitted with a relatively weak frequency compression ratio, showed improved horizontal sound localization. After the study, four subjects preferred adaptive FC, four preferred standard frequency mapping, and four had no preference. Noteworthy, the subjects preferring adaptive FC were those with best performance on all tasks, both with and without adaptive FC.
Conclusion: On a group level, extreme adaptive FC did not change sound localization and speech understanding in bimodal listeners. Possible reasons are too strong compression ratios, insufficient residual hearing or that the adaptive switching, although preserving vowel perception, may have been ineffective to produce consistent ILD cues. Individual results suggested that two subjects were able to integrate the frequency-compressed HA input with that of the CI, and benefitted from enhanced binaural cues for horizontal sound localization.
Introduction
The primary acoustic cues for sound localization in the horizontal plane in normal-hearing listeners are interaural time differences (ITDs, for frequencies <1.5 kHz), which arise as a result of the differences in traveling distance for the acoustic input to the two ears, and interaural level differences (ILDs, for frequencies >1.5 kHz), which result from the acoustic head shadow. As these binaural differences are identical for all locations on the so-called ‘cone of confusion’ and for all locations in the vertical plane (CitationBlauert, 1997), high-frequency (>4 kHz) spectral-shape cues from the pinnae are essential to further disambiguate these cues to enable full directional hearing. Bimodal listeners, who use a cochlear implant (CI) and a conventional hearing aid (HA) in opposite ears, are thought to rely predominantly on ILDs for localization, since CI signal processing eliminates fine-structure ITDs (CitationFrancart and McDermott, 2013). However, residual hearing in the non-implanted ear is typically restricted to the lower frequencies, where the head-shadow related ILD cues are poor (CitationRayleigh, 1907; CitationVan Wanrooij and Van Opstal, 2004). In this study, we tried to enhance ILDs by compressing high-frequency information, containing potentially large ILDs, into the low-frequency audible range of residual binaural hearing. In this way, inaudible high-frequency ILD information would be made available as audible low-frequency ILD information. Although in natural environments the low frequencies do not produce significant ILDs, and therefore the intact auditory system does not need to process low-frequency ILD information, it might be conceivable that the impaired auditory system could learn to use consistently applied low-frequency ILD cues to localize sound sources, even though they are derived from intensity differences in the higher frequency bands. We therefore tested whether frequency-compressed ILDs could be helpful to establish horizontal sound localization in bimodal listeners, as for these listeners the fine-structure ITD cues are not available.
Several studies have reported an improvement in speech perception from frequency compression (FC) in HA users (CitationBohnert et al., 2010; CitationGlista et al., 2009; CitationMcCreery et al., 2013; CitationSimpson et al., 2005; CitationWolfe et al., 2011), most likely resulting from a better audibility of consonants (CitationAlexander, 2013). Others, however, found no effect, neither beneficial, nor detrimental (CitationO'Brien et al., 2010; CitationSimpson et al., 2006). So far, only a few studies have investigated FC in bimodal listeners, but no significant benefits were found. Yet, speech and consonant perception remained unaffected in those studies (CitationDavidson et al., 2015; CitationHua et al., 2012; CitationMcDermott and Henshall, 2010; CitationPark et al., 2012; CitationPerreau et al., 2013). CitationPerreau et al. (2013) and CitationDavidson et al. (2015) investigated bimodal sound localization of daily sounds or words, but found no improvement as a result of FC in the HA. None of these studies specifically addressed ILD perception after FC. The present study therefore set out to test the potential use of ILDs, by measuring sound-localization responses to high-pass filtered noise stimuli, which had been compressed into the audible range of the HA.
In previous studies and in commercial hearing aids, FC was typically applied to frequencies above 1.5 kHz, which does not fully match the poor residual hearing of many bimodal listeners (often <1 kHz). We therefore wondered whether more benefit could be obtained with stronger compression settings of the FC algorithm. Considering the severe hearing loss of most bimodal listeners, we applied an experimental hearing-aid algorithm, in which the compression knee point was set as low as 160 Hz, hence further referred to as ‘extreme frequency compression’. Clearly, such extreme FC potentially creates severe pitch distortions, and thus may degrade speech intelligibility. To preserve speech perception, as well as the perceived naturalness of sounds, the experimental algorithm employed signal-adaptive FC, by protecting vowel formants (i.e. leaving their harmonic structure undistorted), and only compressing the consonants into the low-frequency audible area. For normal- and hearing-impaired listeners, vowels contribute significantly more to sentence intelligibility than consonants (CitationKewley-Port et al., 2007), although the opposite has been reported for isolated words (CitationOwren and Cardillo, 2006). The switching between consonants and vowels was based on the energy content of the input signal: fricative consonants are characterized by their non-harmonic broadband frequency content, in which the high-frequency part contains potentially strong ILD information. We hypothesized that adaptive FC would also avoid the decrement in vowel perception of bimodal users equipped with a HA with FC (CitationPerreau et al., 2013). Therefore, besides localization performance in the horizontal plane (which might improve with FC), we also performed additional psychophysical tests to determine the effects of adaptive FC on speech perception (which should not deteriorate). Finally, adaptive frequency compression, preserving low-frequency temporal information in vowels, hopefully protects cues to voice pitch, which we tested by measuring the perception of pitch accents in words.
It is not clear to what extent sound localization is possible on the basis of ILDs that are spectrally compressed in one ear. The study of Goupell and co-workers (CitationGoupell et al., 2013) in normal-hearing listeners showed robust lateralization responses, by using stimuli with an interaural mismatch in center frequency up to 4 kHz in one ear, and 14 kHz in the other. CitationFrancart and Wouters (2007) demonstrated ILD sensitivity in normal-hearing listeners for signals with an interaural frequency mismatch of up to one octave. Even though just noticeable differences in ILD increased with increasing interaural frequency mismatch, the 3–5 dB thresholds for 1-octave shifts might still be usable in realistic listening environments (CitationShaw, 1974). Most likely, the auditory system will learn to use such artificially altered cues, only after prolonged exposure to many listening situations. The study of CitationDorman et al. (2015) describes another example of sound localization with interaural frequency mismatches. They showed that single-sided deaf listeners with a CI in the deaf ear had learned to adequately use ILD information for sound localization within 1–3 months after device activation.
We tested sound-localization performance and bimodal listening with extreme FC in the HA after a period of chronic use, also considering that extended use could result in a better match of pitch between the ears over time. The latter has been reported for CI users who gradually lowered their perceived pitch in the implanted ear over several octaves towards the pitch in the acoustically stimulated ear (CitationReiss et al., 2007).
Methods
Subjects
Thirteen experienced bimodal listeners participated in this study, all using on a daily basis a Naida S IX UP hearing aid (Phonak, Stäfa, Switzerland) in one ear, and a CI processor (Advanced Bionics, Sylmar, CA, USA) on the contralateral ear Note that these devices did not feature synchronized processing. Seven subjects used the Harmony processor, and six used the Naida Q70 (see Table for demographic details). The devices were balanced in loudness and automatic gain control, as described before (CitationVeugen et al., 2016a), at least 2 months prior to this study. This is further referred to as their ‘standard HA program’, which never used frequency compression or transposition. Briefly, loudness matching was performed using steady-state speech-shaped noise, at two loudness levels (45 and 80 dB SPL) and in three frequency bands (250–548 Hz, 548–1000 Hz and 1000 Hz up to the frequency where hearing loss in the non-implanted ear exceeded 120 dB HL). The hearing aids were altered to enable compression knee-points, as well as the attack and release times to be the same in both devices (CitationVeugen et al., 2016b). We always checked the loudness balance between the CI and the HA during the fitting sessions using a running speech signal from straight ahead. In a few subjects, we increased the overall HA gain when using FC, to re-establish a loudness balance with the CI.
Table 1 Demographic details of the participating subjects
Adaptive features including noise reduction and directional microphones were turned off in both devices for the entire duration of the study, to avoid mismatches in signal processing between the CI and HA that could possibly disturb ILD perception. Twelve subjects were tested with both the adaptive FC algorithm, and the standard HA program (see below, study design). One subject (P8) could not complete the study because of personal problems, and was only measured with the adaptive FC algorithm. For this subject we could still compare sound-localization performance with and without FC, using data of a previous study. The study was approved by the Local Ethics Committee of the Radboud University Nijmegen (protocol number 40327.091.12).
Frequency compression
Like contemporary FC algorithms, the experimental algorithm in this study compressed high frequencies above a certain knee point into the better audible low-frequency area. If the knee point is set below the upper boundary of usable hearing, part or all of the high frequencies previously inaudible become accessible to the listener. Such an approach is called ‘nonlinear frequency compression’ (CitationAlexander, 2013). A particular novelty of our experimental HA algorithms over current FC techniques is that it only applies the compression to consonants, thus protecting vowels by preserving their harmonic structure. Switching between these two states is based on the spectral energy content of the input signal (i.e. output of the hearing aid's filter bank analysis; see Figure B, below, for an example). We will further refer to this algorithm as ‘adaptive’ (applied to consonants only) FC.
Frequency compression was only applied above the compression knee point that was fixed at 160 Hz for all listeners. The compression ratio (CR) above 160 Hz was determined individually for each subject, aiming to map the input range between 160 Hz and 10 kHz onto the frequency range where pure-tone thresholds were below 90 dB HL. The relationship between input and output frequency for a detected consonant is described as follows:(1)
with fin the original sound frequency (in Hz), fout the compressed frequency (in Hz), and CR (dimensionless) the compression ratio of the algorithm.
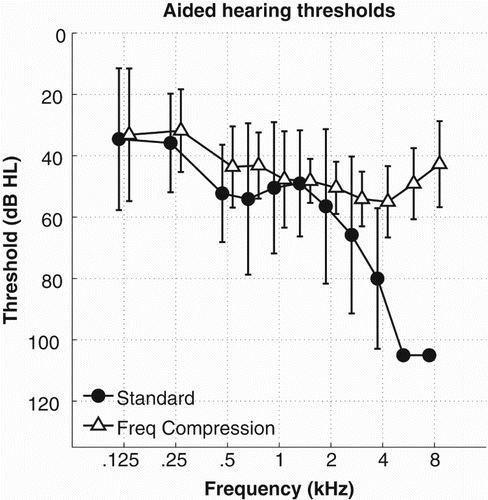
For seven subjects the mapping procedure resulted in a frequency compression ratio that would exceed the maximum of 4; for these listeners, we fixed CR = 4 (see Figure for the applied input–output curves). Figure visualizes a spectrogram of a speech fragment (Figure A) after adaptive (Figure B) and static (Figure C) FC, with a CR 4.0. HA-aided thresholds with and without FC were measured using warble tones with a calibrated Diagnostic Audiometer AD229e (Interacoustics, Denmark) in a sound field using a loudspeaker (JBL Control 1, Washington DC, USA) and an amplifier (MPA 4–80, Ecler, Spain) (Figure ).
Figure 1 Input–output characteristic of experimental frequency compression of consonants in the HA, with the four different compression ratios (CR) used in this study, according to equation (1). The number of subjects tested with each CR under adaptive FC, is indicated
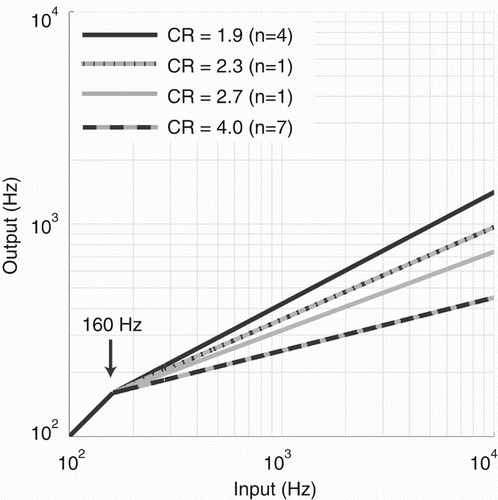
Figure 2 (A) Spectrogram of a female speech fragment, uttering the sentence ‘And everyone around him is a china man too'. (B) Spectrogram of the same fragment after HA processing with experimental adaptive frequency compression. The knee point of the frequency lowering was 160 Hz (dashed line) with a compression ratio of 4.0. (C) Static frequency compression of the same fragment and compression settings
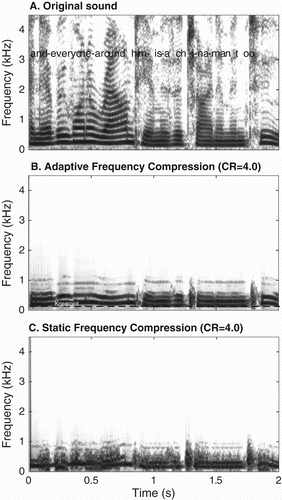
Figure 3 Aided pure-tone thresholds (mean ± 1 SD) in the non-implanted ear across listeners (n = 12), with (open triangles) and without (closed circles) frequency compression. Thresholds beyond the audiometer limit (100 dB HL) were assigned a value of 105 dB HL
Study design
Using a three-visit cross-over design, we compared the subjects’ bimodal performance using their standard HA fitting without FC to a fitting with adaptive FC. During the first session, six subjects were fitted with the standard HA program, and the other seven were fitted with adaptive FC. In the second session, bimodal listening performance was measured and thereafter subjects were fitted with the other HA program (excluding subject 8). In the third session, listening performance was measured again. The two groups of subjects were matched in age, pure-tone thresholds, gender and duration of CI and bimodal use (see Table ). Visits were scheduled at least 5 weeks apart (on average 8.5 ± 2.1 weeks standard deviation) to allow for acclimatization to the bimodal hearing condition with the new HA program. The subjects had no access to another HA fitting program during their take-home period.
After the 5-week take-home acclimatization period for each of the two HA fittings, we assessed performance and subjective preferences in a series of tests, described below. For all tests, performance was measured in the bimodal listening condition and sometimes also with only the HA. For some tests, CI-only performance was measured to be able to calculate the bimodal benefit.
Localization
Horizontal sound-localization performance was tested in the bimodal listening condition as described by CitationBremen et al. (2010). Sounds were presented via a motorized hoop with 58 speakers that rotated around the subject's chair in a completely dark and sound-attenuated room. Subjects wore a custom-built spectacle frame with a small search coil attached to the nose bridge in order to record their head movements using the magnetic search-coil induction technique (CitationRobinson, 1963; CitationBremen et al., 2010; CitationAgterberg et al., 2011).
Trials always started with the presentation of a green LED on the wall. Subjects were instructed to fixate the LED in front of them and then press a button that triggered the sound and turned the LED off. Subjects had to indicate the perceived direction of the sound by making a rapid goal-directed head movement. Stimulus intensities were set at comfortable and well-audible levels. We presented broadband noise bursts (250–6000Hz) at 55 and 65 dB(A) and high-pass filtered noises (2000–6000 Hz) at 65 and 75 dB(A), both with a duration of 150 ms (including 5 ms sine squared on- and offset ramps); we applied the 10 dB sound-level roving to minimize the use of (ambiguous) monaural level cues (CitationVan Wanrooij and Van Opstal, 2004). We did not test all three stimulus intensities for both stimuli to reduce total testing time. Twenty trials per stimulus and intensity were presented in random order, and at a randomly selected location in the frontal hemifield limited to −75° to +75° in azimuth, and −30° to +30° in elevation (to avoid uncomfortable head-orienting movements). To calibrate the head coil, subjects also fixated 18 LEDs at known locations to map the corresponding head-position data. For eleven subjects, localization performance with the standard HA program had been collected already in our previous study (CitationVeugen et al., 2016c); in that case we used their existing data for a comparative analysis. We could thus still analyze the localization data of subject 8, who was only tested on adaptive FC in this study. Unfortunately, localization data for subjects 2 and 3 could not be collected due to technical problems with the localization setup.
Head-movement signals were analyzed in MatLab (version 2014b) using custom-written software (CitationVan Barneveld and Van Wanrooij, 2013). For each stimulus and participant, we determined the best-fit linear regression line between stimulus and response location, respectively αT and αR:(2) The intercept (b; in degrees) is the response location for stimuli presented at straight ahead; the slope (g, dimensionless) represents the change in response per degree change in stimulus location. Perfect localization would yield an intercept of b = 0° and a slope of g = 1.
Speech tests
Apparatus
Target signals for all tests described below were presented from a speaker (JBL Control 1, Harmon International Industries, Washington DC, USA) at 1 m in front of the subject, at 65 dB(A), as calibrated by a sound-level meter (Brüel & Kjaer 2260). Sound stimuli were delivered through an external sound card (RME Babyface, Audio AG, Germany) and a main amplifier (MPA 4-80, Ecler, Spain).
Speech understanding in quiet
We used the NVA (Nederlandse Vereniging voor Audiologie) Dutch monosyllabic word test to assess speech understanding in quiet (CitationBosman and Smoorenburg, 1992). Three lists of 12 words, spoken by a female speaker, were used in each listening condition: CI-only, HA-only and bimodal listening. The number of phonemes correct was calculated as a percentage from the last two lists per condition. Percentage scores were transformed to rationalized arcsine units (RAU) before statistical analysis to stabilize the error variance in the presence of floor and ceiling effects (CitationStudebaker, 1985).
Speech understanding in noise
Speech understanding in noise was measured in the CI-only and bimodal listening condition using the Matrix Sentence Test (Dutch version) (CitationHouben et al., 2014; CitationTheelen-van den Hoek et al., 2014). Target sentences with five pseudo-randomly selected words in a fixed grammatical order (example, translated to English: ‘Mark gives five large flowers’) were spoken by a female speaker with F0 at 175 Hz as determined by Praat software (CitationBoersma and Weenink, 2001). Sentences were presented from the front at 65 dB(A) and noise was either presented from the front (S0N0) or from the HA side (S0NHA) (to reduce testing time we did not test noise from the CI side). Subjects selected on a touch-screen which of the closed set of 50 words (5 columns of 10 words) they heard from every sentence. We used single-talker babble noise (International Speech Test Signal, (CitationHolube et al., 2010), with shortened pauses between words and with F0 lowered to 127 Hz to make it more distinct from the target speaker's voice, possibly facilitating speech understanding. Noise started playing two seconds before the target sentence. The level of the noise was varied adaptively according to the Brand and Kollmeier procedure (CitationBrand and Kollmeier, 2002), but with a minimum step size of ± 1 dB for a correctly repeated sentence. The 50% speech reception threshold (SRT) was calculated as the average SNR level in dB of the last six sentences. Two lists of ten sentences were presented per noise configuration and listening condition; an additional list was measured if the difference in SRT between these two was larger than 2 dB SNR. Prior to testing, two training lists were used to familiarize the subjects with the task, the first one starting at an easy 20 dB SNR. The SRT after the second training list was used as a starting point for the actual measurements and this was kept the same over the two blocks of the cross-over design.
Voice-pitch perception
Just notable differences in fundamental frequency (F0) were determined for the bimodal listening condition as described by CitationStraatman et al. (2010). Stimuli were based on the bi-syllabic nonsense word ‘baba’, produced by a female speaker with F0 at 200 Hz. Pitch accents ranging from 0.85 to 22.1 semitones (step size of 0.85 semitones) were artificially imposed on the first syllable (200 ms) of the stimulus. In an adaptive two interval, same-different procedure, subjects had to indicate whether they heard two identical stimuli (both without a pitch accent) or two stimuli that differed in word accent. The 70.7% threshold in semitones was determined from the last six out of ten reversals; the test was repeated if the standard deviation of these last six reversals was larger than two semitones. Visual feedback was provided during the test.
Consonant and vowel perception
A custom-written Matlab program was made to test the identification of consonants (C) and vowels (V) in a vCv and cVc format, respectively. Three different vCv stimuli were used for each of the 17 consonants /b, d, f, g, h, j, k, l, m, n, p, r, s, t, v, w, z/, which were composed like /ibi/, /aba/ and /obo/ for the consonant /b/. Four different cVc stimuli were used for each of the 10 vowels /a, ɑu, e, ϵi, ø, i, u, o, œy, y/ (aa, au, ee, ei, eu, ie, oe, oo, ui, uu) as follows: /hat/, /hag/, /pat/ and /paf/ for the vowel /a/. All stimuli were spoken by a female speaker and presented twice in random order, resulting in 102 trials for the vCv task and 80 trials for the cVc task. Subjects were instructed to select the perceived letter on a touch-screen, which also initiated the next trial. No feedback was provided during the test.
Statistics
We used a Linear Mixed Model (LMM) with a random factor Subject to compare performance with the standard HA program versus adaptive FC. Localization slopes and intercepts were tested with fixed factors Condition (standard, frequency compression) and Stimulus (Broadband, High-pass noise). Speech in quiet was analyzed using the factor Device, containing six levels (CI-only, Bimodal and HA-only for the standard and frequency compression block). Speech in noise was tested using the factor Condition, separately for S0N0 and S0NHA. Paired t-tests were performed for the other tests: voice-pitch perception thresholds in semitones, percentage consonant correct scores in the vCv task and for each of the five subtypes of consonants (stops, liquids, nasals, fricatives and glides) and for the percentage vowel correct scores in the cVc task. We calculated Pearson's correlation coefficient for the frequency compression ratio versus performance with the FC program for speech understanding in quiet (bimodal and HA-only), bimodal benefit in speech understanding in noise (S0N0 and S0NHA) and versus the localization slope and intercept, averaged over stimuli. Level of significance was set at P < 0.05.
Results
Localization
Figure shows the localization slope and intercept for the broadband and high-pass filtered stimuli. Perfect localization would result in a slope of one and an intercept of zero degrees. Clearly, the listeners’ responses were far from perfect under both listening conditions, and for both stimulus types. Expressed differently, the mean absolute group errors with and without frequency compression were 47 ± 13° and 47 ± 20°, respectively, for BB sounds, and 47 ± 13° and 50 ± 20° for the HP sounds. These differences were not significant (P > 0.05).
Figure 4 Best-fit regression slopes (A, B) and intercepts (C, D) for listeners (n = 11) in the bimodal condition (with and without frequency compression), for the (A, C) broadband and (B, D) high-pass filtered noise. Subjects are identified by the same marker in all panels. The line indicates the compression ratio. Perfect localization responses have a slope of 1 and an offset of 0 degrees
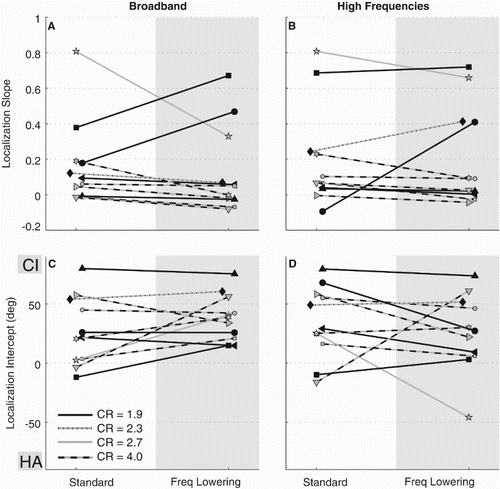
Frequency compression had no effect on the localization slope (F(1,30) = 0.06, P = 0.82), and we did not obtain a difference between the performance for BB and HP stimuli (F(1,30) = 2.09, P = 0.16). The localization slope with and without frequency compression was 0.13 ± 0.25 and 0.17 ± 0.24 for BB sounds and 0.21 ± 0.28 and 0.20 ± 0.29 for HP sounds.
The localization intercept (left-right bias) with and without frequency compression was directed towards the CI side for both stimuli: 39 ± 19 vs. 27 ± 29 degrees for BB sounds, and 26 ± 33 and 34 ± 31 degrees for HP sounds. No significant effect of frequency compression (F(1,30) = 0.07, P = 0.79), and type of stimulus (F(1,30) = 0.18, P = 0.67) was found on the intercept.
Interestingly, two listeners (12, 13) with the lowest CR improved their localization performance after frequency compression: these listeners had increased slopes, and a relatively small localization intercept of the stimulus-response relations with FC for both stimulus types. Note that both listeners had the lowest CR (1.9), because of better residual hearing at higher frequencies on the HA side (<95 dB HL up to 2 and 6 kHz) compared to the other subjects. In contrast, localization performance for subject 4 (CR = 2.7) worsened.
Speech understanding in quiet
For speech understanding in quiet, we determined the percentage phonemes correct, transformed to RAU scores, in the HA-only, CI-only and bimodal listening condition. With and without adaptive FC, scores were respectively 17 ± 26 and 26 ± 25 RAU for HA-only, 76 ± 14 and 80 ± 16 RAU for CI-only and 81 ± 12 and 84 ± 9 RAU for bimodal listening. A significant difference was found between the different listening conditions (F(1,5) = 34.21, P < 0.001): both HA-only conditions differed significantly from all other listening conditions (all P < 0.001). All other pairwise comparisons had P values of 1.0, so no effect (neither negative, nor positive) of adaptive frequency compression was found.
Speech understanding in noise
Speech reception thresholds at 50% correct for speech understanding in noise are displayed in Figure for the different listening conditions (CI-only and bimodal) and noise configurations (S0N0 and S0NHA).
Figure 5 (A and C) Box-whisker plots of the speech reception threshold in noise in the two noise configurations S0N0 and S0NHA, for the CI-only and bimodal listening conditions with and without frequency compression. SNR50 represents the signal to noise ratio at 50% correct responses (n = 12). Lower values indicate better performance. Outliers beyond 1.5 interquartile range are represented by plus symbols. (B and D) Individual scores of bimodal benefit with the standard HA program versus frequency compression. Stars indicate mean values. Subjects are identified by the same marker as in Figure . Points above the diagonal indicate more bimodal benefit with FC and points below the diagonal indicate more benefit with the standard HA fitting
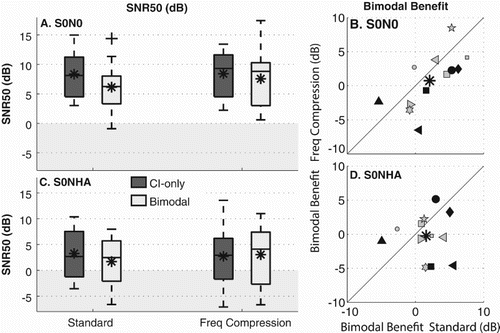
Bimodal benefit was calculated as the difference between the CI-only and the bimodal condition (Figure B and D). On average, the bimodal benefit in S0N0 was 2.2 ± 3.7 dB with the standard HA program and 0.9 ± 4.1 dB with adaptive FC. For S0NHA these values were respectively 1.6 ± 3.0 dB and −0.3 ± 3.2 dB. However, statistical tests showed that the bimodal benefit was not significantly different from zero (S0N0: F(1,11) = 2.20, P = 0.17; S0NHA: F(1,11) = 2.3, P = 0.16), although we obtained a large variability across subjects (Figure BD). No significant effect of adaptive FC was found on the bimodal benefit in S0N0 (F(1,11) = 2.22, P = 0.16) or S0NHA (F(1,11) = 0.97, P = 0.34).
Voice-pitch perception
On average, F0 differences at threshold in the bimodal listening condition were 6.0 ± 4.5 and 6.3 ± 5.2 semitones with and without adaptive FC in the HA, respectively, which were not significantly different from each other (t(11) = 0.27, P = 0.79).
Consonant and vowel perception
The percentage consonants correct in the vCv task for bimodal listening was 62 ± 13% with adaptive FC in the HA and 65 ± 12% with the standard HA program. We did not obtain a significant difference in performance between the two HA programs for the percentage of correct consonants (t(11) = 1.55, P = 0.15), nor for any of its subtypes (stops, liquids, nasals, fricatives and glides; all P > 0.10).
Vowels in the cVc task were correctly identified in 76 ± 17% of the trials with adaptive FC and in 75 ± 17% with the standard HA program. No difference was found between the two bimodal listening conditions (t(11) = −0.86, P = 0.41). This was expected since adaptive FC did not affect the vowels.
Correlations
The lower the compression ratio of frequency compression, the higher RAU scores for speech understanding in quiet in the HA-only condition (r = −0.9, P < 0.001), which was most likely also related to the degree of residual hearing. The compression ratio did not correlate with bimodal benefit for speech understanding in noise, or with the localization intercept and slope.
Subjective preference
We asked subjects which HA program they preferred to use after the study. Four subjects opted for the standard HA program (1, 7, 10, 11), four subjects preferred adaptive FC (2, 4, 6, 12), and four subjects had no preference (3, 5, 9, 13). Only one of the two subjects (12, 13) that seemed to improve localization performance with adaptive FC had a preference for FC. Interestingly, the four subjects that preferred adaptive FC performed better in the various tests compared to the other two groups, when using FC, as well as with the standard HA program. They performed above average (reported as Standard score and FC score) for sound localization (slope 0.41 ± 0.38 and 0.33 ± 0.35, intercept 16 ± 37° and 30 ± 13°), showed a favorable SNR50 (2.0 ± 3.4 dB and 2.2 ± 4.4 dB), consonant (77 ± 6% and 75 ± 10%) and vowel (88 ± 17% and 85 ± 11%) perception and pitch threshold (3.9 ± 3.1 smt and 2.8 ± 1.4 smt). In contrast, the HA-only thresholds of this group were not better than average and the mean compression ratio was 3 ± 1 for all three groups (also see supplementary material Table S1). Because each group consisted only of four subjects, we performed no further statistics on these data.
Discussion
In the present study we tested a novel experimental frequency compression algorithm with an extremely broad operating range in the HA of thirteen bimodal listeners, with the aim to provide ILD cues for localization in the horizontal plane, while at the same time preserving the harmonic structure of vowels in speech, by applying the FC exclusively to the consonants (Figure B). Even though FC was effective in producing markedly better audiometric thresholds at high frequencies (Figure ), localization performance remained poor, when averaged across subjects. Our results therefore suggest that frequency compression does not lead to a veridical localization related ILD percept. Two of the thirteen listeners, however, seemed to improve their localization performance with adaptive FC (Figure ). In addition, despite the absence of an overall effect on localization and on the speech tests, four subjects preferred to use adaptive frequency compression in the HA, another four preferred the standard HA program, whereas the remaining four listeners had no preference.
Our results extend previous studies in bimodal listeners, in which FC was limited to high frequencies above 1.5 kHz. These studies reported no benefit of FC for speech perception or sound localization either (CitationDavidson et al., 2015; CitationMcDermott and Henshall, 2010; CitationPark et al., 2012; CitationPerreau et al., 2013). CitationPerreau et al. (2013) reported impaired vowel perception, in contrast to our results, even though we used FC across a much broader frequency range. This discrepancy most likely is a consequence of our signal-adaptive variant of FC, specifically aiming at preserving the vowels (Figure B).
ILD cues
A possible explanation for the lack of a benefit in localization and speech understanding in noise is that our subjects were not able to use the frequency shifted ILDs. CitationFrancart and Wouters (2007) showed reasonable ILD thresholds for noise bands that differed up to one octave in center frequency across the ears in normal-hearing listeners, even without acclimatization. Note, however, that reasonable ILD thresholds do not necessarily imply a percept of an auditory object with a distinct location in space. Moreover, in our study, the frequency mismatches were even larger than one octave. Most subjects used a compression ratio of 4:1, meaning that an input of 1 kHz was presented to the cochlea as 250 Hz (Figure ). Even the weakest compression ratio used in this study (1.9:1) mapped a 1 kHz input to 420 Hz (a mismatch of more than 1 octave).
Still, it is noteworthy that two subjects considerably improved their localization performance with adaptive FC, compared to the standard HA program (Figure ). A third subject showed a small improvement in the localization slope for high-pass filtered noise sounds. All three listeners had a relatively low-frequency compression ratio (1.9:1 and 2.3:1). The subjects provided with a compression ratio of 4:1 generally showed very low localization slopes (<0.2) for both stimulus types and HA programs. The one subject with a clear decrement in localization slope for broadband sounds (0.8 without FC) used a compression ratio of 2.7:1. This could hint at the importance to limit interaural frequency mismatches in promoting potentially usable binaural difference cues. Alternatively, the subjects with low compression ratios all had better residual hearing and therefore possibly a better spectral and temporal resolution.
Apart from the frequency mismatch possibly preventing subjects to integrate the CI and the HA signal, a shorter processing delay in the CI device compared to the HA may have caused the strong localization bias observed in most subjects towards the CI side. This effect is evidenced by the large intercepts in Figure (CitationChalupper et al., 2014). Such a consistent timing difference would induce a strong precedence effect (CitationBlauert, 1997), in which the leading ear fully dominates the localization percept. If true, such an effect can hardly ever be overcome by competing (unnatural) ILD cues, and additional changes should then be considered to match the potential processing delays as good as possible.
Unfortunately, the improvement in sound localization with adaptive FC, observed in two subjects, was not reflected in the other listening tasks. The bimodal benefit for speech understanding in noise for these subjects decreased on average from 2.9 dB with the standard HA program, to only 0.5 dB with adaptive FC in these subjects in contrast to the idea that improved ILD cues could speech understanding in challenging listening situations. Perhaps, there might have been a trade-off with the distortions in the speech signal, due to the extreme FC applied in this study. No noteworthy differences were found in the results of these two subjects in the other tasks, but they did perform below average in the CI-only listening condition for speech understanding in quiet and in noise, which suggests that they relied more on their (normal) HA input, and possibly had adapted better to the bimodal listening situation. Besides the low compression ratio for these listeners, this could be an additional explanation for their better adaptation to FC. Still, the question remains why these subjects could not use their improved localization skills for speech understanding in noise.
We tested a signal-adaptive algorithm that was designed to apply extreme FC only to consonants and not to vowels. As a result, the binaural cues differed across input signals. This could provide a third reason for the lack of improvement in the binaural tasks: the brain may just be unable to adapt to such inconsistencies (e.g. CitationHofman et al., 1998), resulting in ineffective binaural cues.
Four out of thirteen subjects preferred to continue using extreme FC after the study. These four subjects also performed better than the other subjects in almost all tests, with and without adaptive FC in the HA. They reported that the adaptive FC resulted in a more fused sound percept between the CI and HA. Possibly these subjects had a better capacity to adapt to new auditory inputs, or they were more motivated participants, trying harder to acclimatize. An alternative explanation would be that these subjects were already acclimatized to gross pitch mismatches between their ears, as their high-frequency residual hearing was poorer than for the subjects who did not prefer adaptive FC (70 ± 25 versus 63 ± 18 dB HL).
The present study was based on the assumption that bimodal listeners have to rely on ILD cues for sound localization. A speculative explanation for the lack of an overall improvement in our results is that bimodal subjects may instead use temporal cues in the envelope of sounds (envelope ITDs), or yet unknown cues. A final explanation could be that our subjects had too limited residual hearing in the non-implanted ear. As a result, even with extreme FC the high-frequency information may not have been sufficiently audible to be used as binaural cues. It has been argued that a bimodal benefit for speech understanding is largely the result of a better audible fundamental frequency through the HA (CitationZhang et al., 2010). This could explain the similarity in performance for our speech and voice-pitch perception tasks, since adaptive FC was only applied to consonants, leaving voicing cues in vowels unaffected.
Bimodal benefit
Results of the voice-pitch perception task (both with and without adaptive FC) corresponded well with an earlier study in bimodal subjects (CitationStraatman et al., 2010), which also reported F0 differences at thresholds of about 6–7 semitones. Also the bimodal benefit for speech understanding in noise was in line with the 1–3 (S0N0) and 1 (S0NHA) dB reported in the literature (CitationChing et al., 2007; Citationvan Hoesel, 2012). Still, the benefit in S0NHA was rather small compared to our previous study with largely the same subjects (1.6 versus 3.0 dB) (CitationVeugen et al., 2016b). This can possibly be explained by the different sentence materials that we used. The fundamental frequency of the target speaker in the Matrix test was 175 Hz, and in our previous study we used the Leuven Intelligibility Sentence Test (Citationvan Wieringen and Wouters, 2008) with sentences that had an F0 of 200 Hz. Since the single-talker babble noise used in both studies had an F0 of 127 Hz, target and noise may have been more difficult to separate in the present study. Maybe this has reduced the potential benefit of the complementary low-frequency information provided by the HA that helps to segregate different voices.
Conclusion
We aimed to improve ILD cues and preserve speech perception by an experimental adaptive frequency compression algorithm in the HA of 13 bimodal listeners. Frequency compression was applied above 160 Hz, but only to consonant signals, therefore preserving vowel formants. Adaptive frequency compression did not significantly affect bimodal localization or listening performance, most likely because (1) subjects could not use frequency-compressed ILDs, or (2) the adaptive switching between vowels and consonants prevented adaptation to consistent ILD cues.
Disclaimer statements
Contributors None.
Funding This work was supported by Advanced Bionics.
Conflicts of interest None.
Ethics approval The study was approved by the Local Ethics Committee of the Radboud University Nijmegen (protocol number 40327.091.12).
Supplementary material
Supplemental data for this article can be accessed at https://doi.org/10.1080/14670100.2017.1353762.
References
- Agterberg, M.J., Snik, A.F., Hol, M.K., van Esch, T.E., Cremers, C.W., Van Wanrooij, M.M., et al. 2011. Improved horizontal directional hearing in bone conduction device users with acquired unilateral conductive hearing loss. Journal of the Association for Research in Otolaryngology, 12: 1–11. doi: 10.1007/s10162-010-0235-2
- Alexander, J.M. 2013. Individual variability in recognition of frequency-lowered speech. Seminars in Hearing, 34: 86–109. doi: 10.1055/s-0033-1341346
- Blauert, J. 1997. Spatial hearing – the psychophysics of human sound localization. Cambridge, MA: MIT Press.
- Boersma, P., Weenink, D. 2001. Praat, a system for doing phonetics by computer. Glot International, 5(9/10): 341–345.
- Bohnert, A., Nyffeler, M., Keilmann, A. 2010. Advantages of a non-linear frequency compression algorithm in noise. European Archives of Oto-rhino-laryngology, 267: 1045–1053. doi: 10.1007/s00405-009-1170-x
- Bosman, A.J., Smoorenburg, G.F. 1992. Woordenlijst voor spraakaudiometrie [compact disc]. Nederlandse Vereniging voor Audiologie. Doesburg, NL: Electro Medical Instruments b.v. & Gouda, NL: Veenhuis Medical Audio b.v.
- Brand, T., Kollmeier, B. 2002. Efficient adaptive procedures for threshold and concurrent slope estimates for psychophysics and speech intelligibility tests. The Journal of the Acoustical Society of America, 111: 2801–2810. doi: 10.1121/1.1479152
- Bremen, P., van Wanrooij, M.M., van Opstal, A.J. 2010. Pinna cues determine orienting response modes to synchronous sounds in elevation. The Journal of Neuroscience, 30: 194–204. doi: 10.1523/JNEUROSCI.2982-09.2010
- Chalupper, J., Geissler, G., Büchner, A., Battmer, R. 2014. Tolerable processing delay in electro-acoustic stimulation. Poster presented at the 13th Conference on Cochlear Implants and Other Implantable Auditory Technologies, Munich, Germany.
- Ching, T.Y., van Wanrooy, E., Dillon, H. 2007. Binaural-bimodal fitting or bilateral implantation for managing severe to profound deafness: a review. Trends in Amplification, 11: 161–192. doi: 10.1177/1084713807304357
- Davidson, L.S., Firszt, J.B., Brenner, C., Cadieux, J.H. 2015. Evaluation of hearing aid frequency response fittings in pediatric and young adult bimodal recipients. Journal of the American Academy of Audiology, 26: 393–407. doi: 10.3766/jaaa.26.4.7
- Dorman, M.F., Zeitler, D., Cook, S.J., Loiselle, L., Yost, W.A., Wanna, G.B., et al. 2015. Interaural level difference cues determine sound source localization by single-sided deaf patients fit with a cochlear implant. Audiology and Neurotology, 20: 183–188. doi: 10.1159/000375394
- Francart, T., McDermott, H.J. 2013. Psychophysics, fitting, and signal processing for combined hearing aid and cochlear implant stimulation. Ear and hearing, 34: 685–700. doi: 10.1097/AUD.0b013e31829d14cb
- Francart, T., Wouters, J. 2007. Perception of across-frequency interaural level differences. The Journal of the Acoustical Society of America, 122: 2826–2831. doi: 10.1121/1.2783130
- Glista, D., Scollie, S., Bagatto, M., Seewald, R., Parsa, V., Johnson, A. 2009. Evaluation of nonlinear frequency compression: Clinical outcomes. International Journal of Audiology, 48: 632–644. doi: 10.1080/14992020902971349
- Goupell, M.J., Stoelb, C., Kan, A., Litovsky, R.Y. 2013. Effect of mismatched place-of-stimulation on the salience of binaural cues in conditions that simulate bilateral cochlear-implant listening. The Journal of the Acoustical Society of America, 133: 2272–2287. doi: 10.1121/1.4792936
- Hofman, P.M., Van Riswick, J.G.A., Van Opstal, A.J. 1998. Relearning sound localization with new ears. Nature Neuroscience, 1: 417–421. doi: 10.1038/1633
- Holube, I., Fredelake, S., Vlaming, M., Kollmeier, B. 2010. Development and analysis of an International Speech Test Signal (ISTS). International Journal of Audiology, 49: 891–903. doi: 10.3109/14992027.2010.506889
- Houben, R., Koopman, J., Luts, H., Wagener, K.C., van Wieringen, A., Verschuure, H., Dreschler, W.A. 2014. Development of a Dutch matrix sentence test to assess speech intelligibility in noise. International Journal of Audiology, 53: 760–763. doi: 10.3109/14992027.2014.920111
- Hua, H., Johansson, B., Jönsson, R., Magnusson, L. 2012. Cochlear implant combined with a linear frequency transposing hearing aid. Journal of the American Academy of Audiology, 23: 722–732. doi: 10.3766/jaaa.23.9.6
- Kewley-Port, D., Burkle, T.Z., Lee, J.H. 2007. Contribution of consonant versus vowel information to sentence intelligibility for young normal-hearing and elderly hearing-impaired listeners. The Journal of the Acoustical Society of America, 122: 2365–2375. doi: 10.1121/1.2773986
- McCreery, R.W., Brennan, M.A., Hoover, B., Kopun, J., Stelmachowicz, P.G. 2013. Maximizing audibility and speech recognition with nonlinear frequency compression by estimating audible bandwidth. Ear and Hearing, 34: E24–E27. doi: 10.1097/AUD.0b013e31826d0beb
- McDermott, H., Henshall, K. 2010. The use of frequency compression by cochlear implant recipients with postoperative acoustic hearing. Journal of the American Academy of Audiology, 21: 380–389. doi: 10.3766/jaaa.21.6.3
- O'Brien, A., Yeend, I., Hartley, L., Keidser, G., Nyffeler, M. 2010. Evaluation of frequency compression and high-frequency directionality. The Hearing Journal, 63(32): 34–37.
- Owren, M.J., Cardillo, G.C. 2006. The relative roles of vowels and consonants in discriminating talker identity versus word meaning. The Journal of the Acoustical Society of America, 119: 1727–1739. doi: 10.1121/1.2161431
- Park, L.R., Teagle, H.F.B., Buss, E., Roush, P.A., Buchman, C.A. 2012. Effects of frequency compression hearing aids for unilaterally implanted children with acoustically amplified residual hearing in the nonimplanted ear. Ear and Hearing, 33: E1–E12. doi: 10.1097/AUD.0b013e31824a3b97
- Perreau, A.E., Bentler, R.A., Tyler, R.S. 2013. The contribution of a frequency-compression hearing aid to contralateral cochlear implant performance. Journal of the American Academy of Audiology, 24: 105–120. doi: 10.3766/jaaa.24.2.4
- Rayleigh, L. 1907. On our perception of sound direction. Philosophical Magazine, 13: 214–232. doi: 10.1080/14786440709463595
- Reiss, L.A., Turner, C.W., Erenberg, S.R., Gantz, B.J. 2007. Changes in pitch with a cochlear implant over time. Journal of the Association for Research in Otolaryngology, 8: 241–257. doi: 10.1007/s10162-007-0077-8
- Robinson, D.A. 1963. A method of measuring eye movements using a sclera search coil in a magnetic field. IEEE Transactions on Bio-medical Electronics, 10: 137–145. doi: 10.1109/TBMEL.1963.4322822
- Shaw, E.A. 1974. Transformation of sound pressure level from the free field to the eardrum in the horizontal plane. The Journal of the Acoustical Society of America, 56: 1848–1861. doi: 10.1121/1.1903522
- Simpson, A., Hersbach, A.A., McDermott, H.J. 2005. Improvements in speech perception with an experimental nonlinear frequency compression hearing device. International journal of audiology, 44: 281–292. doi: 10.1080/14992020500060636
- Simpson, A., Hersbach, A.A., McDermott, H.J. 2006. Frequency-compression outcomes in listeners with steeply sloping audiograms. International journal of audiology, 45: 619–629. doi: 10.1080/14992020600825508
- Straatman, L.V., Rietveld, A.C., Beijen, J., Mylanus, E.A., Mens, L.H. 2010. Advantage of bimodal fitting in prosody perception for children using a cochlear implant and a hearing aid. The Journal of the Acoustical Society of America, 128: 1884–1895. doi: 10.1121/1.3474236
- Studebaker, G.A. 1985. A “rationalized” arcsine transform. Journal of Speech Language and Hearing Research, 28: 455–462. doi: 10.1044/jshr.2803.455
- Theelen-van den Hoek, F.L., Houben, R., Dreschler, W.A. 2014. Investigation into the applicability and optimization of the Dutch matrix sentence test for use with cochlear implant users. International Journal of Audiology, 53: 817–828. doi: 10.3109/14992027.2014.922223
- Van Barneveld, D.C., Van Wanrooij, M.M. 2013. The influence of static eye and head position on the ventriloquist effect. European Journal of Neuroscience, 37: 1501–1510. doi: 10.1111/ejn.12176
- van Hoesel, R.J. 2012. Contrasting benefits from contralateral implants and hearing aids in cochlear implant users. Hearing Research, 288: 100–113. doi: 10.1016/j.heares.2011.11.014
- Van Wanrooij, M.M., Van Opstal, A.J. 2004. Contribution of head shadow and pinna cues to chronic monaural sound localization. The Journal of Neuroscience, 24: 4163–4171. doi: 10.1523/JNEUROSCI.0048-04.2004
- van Wieringen, A., Wouters, J. 2008. LIST and LINT: sentences and numbers for quantifying speech understanding in severely impaired listeners for Flanders and the Netherlands. International Journal of Audiology, 47: 348–355. doi: 10.1080/14992020801895144
- Veugen, L.C., Chalupper, J., Snik, A.F., van Opstal, A.J., Mens, L.H. 2016a. Frequency-dependent loudness balancing in bimodal cochlear implant users. Acta Oto-laryngologica, 136: 775–781. doi: 10.3109/00016489.2016.1155233
- Veugen, L.C., Chalupper, J., Snik, A.F., van Opstal, A.J., Mens, L.H. 2016b. Matching automatic gain control across devices in bimodal cochlear implant users. Ear and hearing, 37: 260–270. doi: 10.1097/AUD.0000000000000260
- Veugen, L.C.E., Hendrikse, M.M., van Wanrooij, M.M., Agterberg, M.J., Chalupper, J., Mens, L.H.M., Snik, A.F. and van Opstal, A.J. 2016c. Horizontal sound localization in cochlear implant users with a contralateral hearing aid. Hearing research, 336: 72–82.
- Wolfe, J., John, A., Schafer, E., Nyffeler, M., Boretzki, M., Caraway, T., Hudson, M. 2011. Long-term effects of non-linear frequency compression for children with moderate hearing loss. International Journal of Audiology, 50: 396–404. doi: 10.3109/14992027.2010.551788
- Zhang, T., Dorman, M.F., Spahr, A.J. 2010. Information from the voice fundamental frequency (F0) region accounts for the majority of the benefit when acoustic stimulation is added to electric stimulation. Ear and hearing, 31: 63–69. doi: 10.1097/AUD.0b013e3181b7190c