
Abstract
Objectives
In human cochlear implant (CI) recipients, the slope of the electrically evoked compound action potential (ECAP) amplitude growth function (AGF) is not very well investigated, in comparison to the threshold derived from the AGF. This is despite the fact that it was shown in animal experiments that the slope correlates with the number of excitable neurons. The rationale of this study was to establish baseline data of the AGF slope for possible clinical applications, while investigating stability over time and dependence on cochlear site.
Design
ECAP AGFs of 16 ears implanted with MED-EL CIs were recorded on all electrode contacts during the normal clinical routine at 4 different points in time.
Results
Due to patient availability, not all 16 ears could be measured at all 4 points in time. A dependence of the slope on the electrode position was visible and statistically significant: At the three electrode contacts at the apical end of the array, the slope is greater compared to the medial and basal region of the cochlea.
Conclusion
The three most apical electrode contacts show greater slopes of ECAP AGF recordings. Our data of the cohort slopes show mild effects between the 4 different points in time.
Introduction
Modern cochlear implants (CI) are capable of recording electrically evoked compound action potentials (ECAP) which reflect the response of the auditory nerve to electrical stimulation. Clinical applications of ECAP recordings include functionality tests during surgery, long-time monitoring of integrity of the implant–nerve interface and provide guidance for fitting when subjective feedback from the CI user is unreliable.
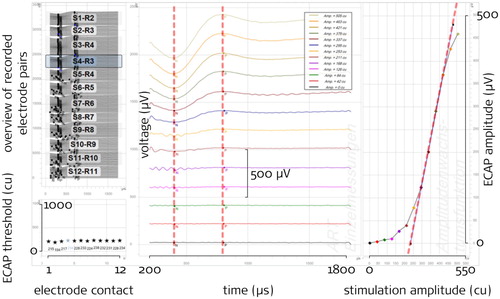
With the gradually growing stimulation intensity during a recording, an ECAP response forms and the amplitude of the characteristic ECAP waveform increases with stimulation intensity. In clinical practice, the most frequently used parameter from such measurements is the ECAP threshold, that is the stimulation intensity from which on ECAPs are being detected. There are different strategies to determine thresholds, one of them being based on all the ECAP amplitudes of a recording sequence plotted as a function of the stimulation current. The resulting graph is referred to as the Amplitude Growth Function (AGF) (see right panel of ). The ECAP amplitudes within the AGF usually follow a sigmoidal shape, which can be characterized by two basic parameters, the threshold and the slope: The intersection of a linear extrapolation from the steepest portion of the AGF and the base line provides one possible definition of the ECAP threshold, where slope is defined as the steepness of this linear extrapolation of the AGF. Notably, different implant manufacturers use different methods to determine ECAP features, with linear extrapolation being just one of them. While some researchers and manufacturers use an exponential transformation of current levels into clinical units, which results in a logarithmic x axis scale for stimulation amplitude (µA or µC per phase), we prefer to display stimulation amplitude on a linear scale. Please note that extrapolated thresholds and slope values therefore cannot directly be compared between these approaches.
Figure 1 Example screenshot of manual slope determination with the MAESTRO software as seen by the analyst (the red dashed lines shown here are not visible in MAESTRO as well as the black annotations)
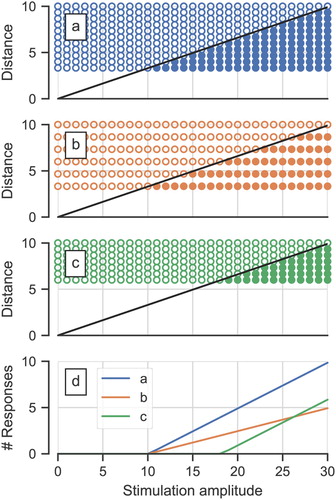
In animal models, several studies demonstrated that the slope of the ECAP AGF is a predictor of the number of remaining nerve fibers or ‘neural status’ of the ear (Hall, Citation1990; Pfingst et al., Citation2015, Citation2017; Ramekers et al., Citation2014). Earlier, it has been proposed that the slope in humans is proportional to the neural density (Cullington, Citation2003) while the ECAP threshold is affected by the distance between the stimulating electrode and the excitable part of the neurons (Nehmé et al., Citation2014). A simplified graphical representation of this idea () illustrates that despite similar distance of electrode to neurons, a lower neural density (a versus b) would result in the same ECAP thresholds but different slopes. The basis for this lies within a model wherein the ECAP amplitude represents the number of responding neurons (Cullington, Citation2003; Kim et al., Citation2010; Nehmé et al., Citation2014). A detailed computer model indicated that the ECAP amplitude does indeed increase with the number of responding neurons but only until certain stimulation amplitudes – at very high stimulation intensities, ECAP amplitudes start decreasing again (Briaire and Frijns, Citation2005). However, with stimulation amplitudes as used in clinical practice with humans, this pattern is typically not observed.
Figure 2 A simple model showing the dependency of the ECAP threshold and slope from the distance between stimulation electrode contact and neurons and neural density. The three upper panels a, b, c depict ‘neurons’ as open and filled circles, at different distances from the stimulation site: open if they are not excited by the stimulation and filled if they are with increasing stimulation amplitude. The bottom panel shows the number of excited neurons as a function of the stimulation amplitude for the three geometric configurations. This corresponds to the AGF when, for this discussion, assuming that each neuron contributes equally to the ECAP signal. (a) depicts a case with dense neurons and small distance stimulation-site to neurons, causing low threshold and steep slope. (b) corresponds to (a) except for a lower neural density: The threshold remains the same, whereas the resulting slope is shallower. (c) has the same neural density as (a) but increased distance and lesser overall number of neurons, causing greater threshold but the same slope
To date there is no proof of slope being a predictor of neural status in humans, however there are indications from research that point towards a similar direction: For instance, consistent with the animal data on flatter slopes correlating with poor neuronal survival, He et al. (Citation2018) observed a significantly shallower slope in children with cochlear nerve deficiency compared to children with normal sized cochlear nerve. Nehmé et al. (Citation2014) compared slopes from Advanced Bionics HiRes90K device-users with congenital and acquired hearing loss and found a steeper median slope (and a broader variation) for the former. Congenital hearing loss can present as a wide variety of structural deficiencies, while acquired hearing loss, on the other hand, often involves degradation processes of hair cells and, in consequence, neurons (Liberman and Kujawa, Citation2017). In humans, degeneration of neurons in the cochlea is affected by duration of hearing loss (Nadol, Citation1997) – a recent article demonstrated that slopes were shallower for CI users with longer duration of hearing loss suggesting that neural density may be (at least partially) reflected in the slope characteristic of an ECAP recording (Schvartz-Leyzac and Pfingst, Citation2016). Also, an effect of age on the AGF slope has been reported in numerous studies: Slopes in a younger age group (15-30 years) were found to be significantly steeper than in older age groups (above 30 years) (Cafarelli Dees et al., Citation2005). Similarly, pediatric CI users had steeper AGF slopes than (post-lingually deafened) adults (Brown et al., Citation2010; Chiou, Citation2016; Kosaner et al., Citation2018). Neural density generally decreases with age (Dhanasingh et al., Citation2020).
Prior research also investigated whether slopes correlate with speech performance and could thus be used as predictive parameter in clinical practice (van Eijl et al., Citation2017). Correlations between slope and speech perception were observed only by Kim et al. (Citation2010). A meta-analysis on those studies suggested that the inconsistent results could be due to the mean effect of slope being small and other factors having stronger influences on speech perception (van Eijl et al., Citation2017).
What has been established, based on recordings from a subset of representative electrodes, is that ECAP slopes are steeper in the apical region of the cochlea than in medial or basal regions (Brill et al., Citation2009; van de Heyning et al., Citation2016). As discussed by the authors of the studies, the steeper slope could be indicative of a higher neural cell population in the apex. The predominant neuronal structures in these regions are afferent peripheral axons rather than spiral ganglion cell somas (Ariyasu et al., Citation1989; Hochmair et al., Citation2003; Kawano et al., Citation1996). Spiral ganglion cells extend up to about 720 angular degrees from the round window (Stakhovskaya et al., Citation2007). Depending on the individual size of the cochlea, the surgical approach and the choice of the electrode, the apicalmost electrode contacts may reach close to this site (Dhanasingh and Jolly, Citation2017; Rader et al., Citation2016). Besides higher neural density in the apex, there are also other possible explanations for steeper apical slopes, for instance, the presence of more excitable structures (predominantly dendrites) in the apex (Lai and Dillier, Citation2000; Westen et al., Citation2011), a narrower scala tympani, better nerve survival at low frequencies, wider excitation for high stimulation amplitudes in the apex, different current paths for apical electrode contacts having more suitable spatial orientation for recording and/or recording electrodes being closer located to spiral ganglion cells (Frijns et al., Citation2002).
To date, there are only a few longitudinal studies on ECAP parameters, even less investigating the AGF slope. One study looked at slope in users of the Advanced Bionics HiFocus 1j electrode (straight) on initial activation and four subsequent points in time and found that at ≥24 months after activation slopes were significantly steeper than at the earlier time points (Nehmé et al., Citation2014). Tanamati et al. (Citation2009) recorded slope data in subjects using Nucleus 24 implant at three points in time after activation (1st–3rd return visit) and found no significant changes over time. Another large-scale longitudinal study (Brown et al., Citation2010) in pediatric and adult Nucleus CI24M (straight electrode) and CI24R (Contour electrode) users found that the slope of the ECAP growth function did not change significantly across ‘early’ and ‘late’ points after activation.
Notably, all of the above studies used just a selection of representative electrodes rather than the complete electrode array. To detect all subtle position effects, the present study aims to monitor slope on all inserted contacts of MED-EL electrode arrays. The AGF slope over time has not been extensively studied with MED-EL devices yet. Electrode arrays from different manufacturers vary in multiple aspects, including length, insertion depths, exact location (lateral wall vs. perimodiolar) (Dhanasingh and Jolly, Citation2017) as well as stimulation paradigm and slope determination method. In particular, the MED-EL electrode arrays are comparatively long, and are thus suited to investigate the apical region. Our first hypothesis was that contacts located in the more apical region of the cochlea would have greater slopes than contacts located in the middle or basal regions. The second hypothesis was that the slope would be stable over time. If so, slope recordings measured at any point in time, even as early as during surgery (intraoperatively), could be included for longitudinal monitoring of neural excitability. The present dataset may also be used as a baseline for exploring slope over time in clinical practice.
Materials and methods
During the routine CI procedure at the University Medicine Greifswald, 14 patients agreed to participate in the study. Two of them, who were bilaterally (sequentially) implanted, contributed both sides. Therefore, recordings of 16 ears were available at one or more different points in time. ECAPs were recorded from all electrodes and slopes determined (a) intraoperatively, after implantation and wound suture (OP), (b) at initial activation (IA), (c) 3 months (III) and (d) 6 months (VI) after initial activation.
Participants
All 16 ears had MED-EL cochlear implants: 15 SYNCHRONY and 1 CONCERTO. The mean age at CI surgery was 58.4 years (min: 8; max: 77). The initial activation on average took place 27 days after surgery (min: 19; max: 35). 15 implants had a Flex28, one a Medium electrode array. In 13 ears, the electrode array was inserted via the round window, in three ears a cochleostomy was performed. summarizes the participants and shows at which points in time the recordings were performed for each ear.
Table 1 Participants. Ear ID 220/259 and 244/255 are bilaterally sequentially implanted participants
Table 2 Available measurements per ear and point in time
ECAP recording paradigm
The ECAP recordings were performed with the ‘ART’ task (Auditory nerve Response Telemetry) of the clinical MED-EL software MAESTRO 6 and MAESTRO 7. The version update occurred during the course of the study. The ‘AutoART’ task as available in MAESTRO 7 was not used in order to keep the recording paradigms consistent. All 12 electrode contacts were used, except in three cases of incompletely inserted electrode arrays or cases of deactivated channels in clinical maps (). summarizes the ART recording parameters: The recording started at the minimum amplitude and increased through 20 levels to the maximum amplitude (the minimum and maximum are included in the number of levels). We aimed at a level repetition of 2*30 recordings (the factor 2 results from the alternating stimulation pulse polarity which is used as a method of artifact reduction), in each case a minimum repetition of 2*25 was reached. The phase duration was set to 50 µs which is greater than the default values (30 µs for MAESTRO 6 and 40 µs for MAESTRO 7). This was done to benefit from the findings of Berger et al. (Citation2017) which are assumed to be similar for MED-EL: Greater phase durations should enable stimulation above the ECAP thresholds in a greater proportion of patients. The inter-phase gap was 2.1 µs (fixed). The stimulation rate resulting from these settings was 75.7 Hz. The participants were instructed to indicate their loudness perception during the measurement and were closely observed after the stimulation/recording had started. The maximum stimulation amplitude was set to 800 cu (1 cu corresponds approximately to 1 µA) resulting in a maximum stimulation charge per phase of 40 qu (1 qu is approximately 1 nC). If individual maximum acceptable loudness was reached earlier, recording of the current electrode contact was stopped, the remaining stimulation pulses for this contact skipped, and the next contact was measured. Each recording was done once.
Table 3 Setting used for ECAP recordings with the ‘ART’ task of MAESTRO
Electrode position
MED-EL electrodes have physical electrode contact numbers from E01 (most apical) to E12 (most basal). All electrodes in use were Flex28 arrays with a length of 28 mm (contact distance 2.1 mm) except one, which was a Medium electrode with 24 mm length and 1.9 mm contact distance. Due to this fact and because not all electrode arrays were inserted fully (see ), we introduced ‘compensated’ electrode contact numbers from C01 (most apical) to C12 (most basal): for a fully inserted Flex28 electrode array, those numbers correspond to each other (e.g. E01 = C01). In cases where only 11 of the 12 contacts of a Flex28 were inserted, E01 corresponds to C02, E02 corresponds to C03, and so on (C01 does not exist). We mapped all Medium electrode contact positions to the corresponding Flex28 positions with the assumption that the basal contacts are aligned. This leads to E01 = C02, E02 = C03, […], E06 = C07, E07 = C07, E08 = C08, […], E12 = C12 for this single case. Note that this is only an estimation of where the compensated electrode would be.
Results
Descriptive statistics
In this study on MED-EL devices, we collected a total of 516 measurements from 16 ears – the slope could be obtained from 437 of those measurements (see ), meaning we could successfully determine the slope parameter from the AGF in 84.7% of the cases. The actually used mean maximum stimulation amplitude was 636 cu (standard deviation 119 cu; median 667 cu). As shown in , missing recordings occurred mostly in the intraoperative session and at the most basal electrodes (11 and 12) across all time points. The lower intra-operative success rate can be allocated to two ears where nearly no ECAPs could be recorded. We attribute this to a suboptimal electric connection between tissue and the reference electrode. Possible reasons for the smaller number of ECAP slopes determined in the basal electrodes are: Incomplete electrode insertion and less tolerance to the unpleasant high pitch of the stimulus and subsequent earlier abortion of the recording.
Table 4 Number of successfully measured/determined slopes per point in time and (physical) electrode contact
Table 5 Number of missing slope recordings per (physical) electrode contact and point in time due to exclusion of measurement or unsuccessful determination of slope
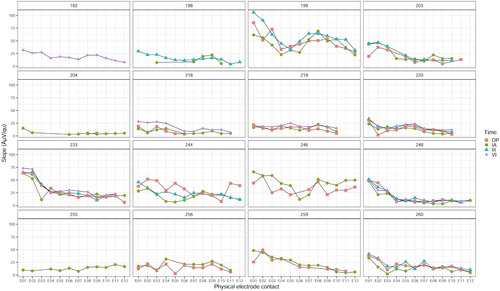
The ECAP slope was determined at the steepest point of the Amplitude Growth Function. Values ranged from 1.9 to 105.9 µV/qu. shows AGF slopes for individual ears, points in time and electrode contacts, and illustrates the broad variation in absolute slope values across individuals. Among the four different measurement time points, the slope profiles visually appear to trace each other well within several individuals (; ear IDs 199, 203, 218, 219, 220, 233, 248, 259, 260).
Figure 3 Individual ECAP AGF slope values per ear, physical electrode contact and point in time
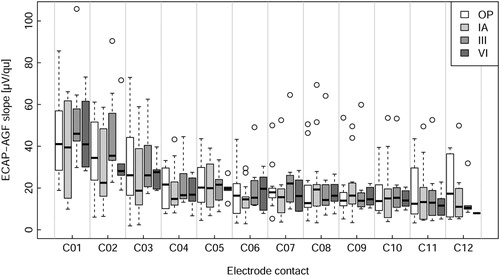
The slope values pooled across participants () indicated higher slopes at electrodes located in the apical region of the cochlea compared to the middle and basal regions. This appeared to be true for all four measured time points ().
Figure 4 ECAP AGF slopes for all ears and all compensated electrode contacts at all four points in time in µV/qu
Statistical analysis of the effect of electrode position and point in time on slope
In the design of this study, a mixed-effect model ANOVA was selected to be used for statistical analysis to evaluate the possible effects of time and electrode site on AGF slope. Analyses demonstrated that AGF slopes were not normally distributed, and data points could not be collected on every electrode for every participant, resulting in missing data. Therefore, a linear mixed effects model was used with electrode site (factor with levels C01 to C12) and point in time (factor with levels OP, IA, III, VI) as fixed effects and ear as random effect. This method does not require normally distributed data and is robust regarding missing data points. The ‘R programming language and statistical environment’ was used to perform statistics (R Core Team, Citation2018), version 3.5.1 with the packages ‘lmerTest’ (Kuznetsova et al., Citation2017) and ‘lme4’ (Bates et al., Citation2015), function ‘lmer’ for the linear mixed model and ‘multcomp’ (Hothorn et al., Citation2008), function ‘glht’ for the post-hoc test.
The linear mixed effect model to predict the slope was sequentially constructed. All steps included the ear as random effect. The basic model used had no fixed effect (Baseline Model). The second model included the compensated electrode position factor as fixed effect with electrode contact C07 as reference group for the treatment contrasts (Electrode Model). Electrode contact C07 was chosen due to its medial location in the electrode array and because it had the least number of missing data points (). The third model additionally included point in time as fixed factor (Electrode + Time Model), whereby initial activation (IA) was used as reference group for the other time points. The IA time point was chosen because it was the time point with the most measurements available and fewer missing values compared to the OP time point. The last model additionally included the interaction between electrode and time (Electrode + Time + Interaction Model). The cascade of models is shown in : The inclusion of electrode contacts as factor improved the prediction substantially (P < 0.001). The inclusion of point in time as factor significantly improved the prediction as well (P < 0.01). Including the interaction between time and electrode did not further improve the prediction, leaving the Electrode + Time Model as the best fit for the data and was used henceforth. The model estimates and confidence intervals are displayed in and listed in . The interpretation is as follows: The predicted slope of electrode C07 at IA is the intercept (16.1 µV/qu). For instance, to get the predicted value of electrode C02 at OP, the relative predictions must be added, resulting in 16.1 (intercept) + 16.6 (C02) + 0.4 (OP) = 33.1 µV/qu. The predicted slopes of the most apical electrode contacts, namely C01, C02 and C03, differed significantly (P < 0.001) from the slope of the reference electrode C07. For the other contacts, the model did not show significant differences (). The QQ-plot of the residuals of the model (not shown) suggested that the model was valid.
Figure 5 Model outcome: Intercept: Best guess of ‘overall’ slope referenced to electrode C07 at initial activation. Electrode: model prediction of correction of slope for different electrodes. Time: model prediction of correction for different points in time: OP, III and VI. An effect is considered significant if the confidence interval does not contain 0 (shaded). The estimate in numbers is presented in
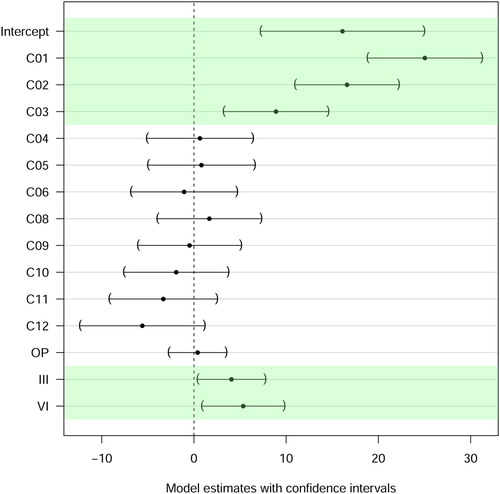
Table 6 ANOVA table comparing the cascade of models: Baseline Model; Electrode Model; Electrode + Time Model; Electrode + Time + Interaction Model
Table 7 Simultaneous tests for general linear hypotheses from the model
Concerning time of measurement, the model estimated significantly steeper slopes for the two later time points III (P = 0.001) and VI (P < 0.001) compared with time point IA. It should be noted however: (a) The effect size is smaller compared to the effect size in the apex. (b) The raw data show no clear trend over time. (c) Recordings at all four points in time were available from only three participants (). Therefore, the analysis was re-done with only those three ears (Ear ID 220, 233 and 248), applying the same model: Both factors, electrode and time, still contributed significantly to the prediction of the slope (both P < 0.001) and slope effects for electrodes C01, C02 and C03, as well as time effects for III and VI remained significant.
The two surgical techniques used in this study, cochleostomy and round window insertion, are the most commonly used methods for cochlear implantation. Prior research demonstrated that particular outcome parameters of a cochlear implantation can be influenced by the surgical technique used: For instance, implantations performed using the round window approach were shown to have a higher probability of complete insertion into the scala tympani (Jiam and Limb, Citation2016; Wanna et al., Citation2014, Citation2015). Another publication showed that with the round window approach, the position of the electrode array was closer to cochlear neural structures (central axis of the modiolus and osseous spiral lamina) than with cochleostomy, particularly in the basal region (Jiam et al., Citation2016). Two studies on human temporal bones addressed the questions on whether insertion depth is affected by surgical technique (Abdel Salam et al., Citation2013; Zhou et al., Citation2014): One found significantly greater angular insertion depth with cochleostomy compared to round window approach with electrode arrays from Cochlear Ltd (Zhou et al., Citation2014). Another study with MED-EL electrode arrays found that the cochleostomy approach resulted in a 0.7 mm (on average) deeper insertion than round window approach, however, this difference was not statistically significant (Abdel Salam et al., Citation2013). The preferred approach may also depend on whether the array is lateral wall or perimodiolar.
In this study, 3 ears were implanted using cochleostomy while the remaining 13 ears were implanted using the round window approach (). We tested whether surgical technique had an influence on slope in the present dataset by adding it as a fixed effect (Electrode + Surgical Technique Model). Including surgical technique did not improve the model significantly (data not shown), rendering the effect negligible for the conclusions on electrode position.
Discussion
Greater slope in the apex
The fact that the slope is greater in the apical region was already reported in the literature (Brill et al., Citation2009; Frijns et al., Citation2002; Nehmé et al., Citation2014; Polak et al., Citation2004; van de Heyning et al., Citation2016). Our results confirm these findings, especially for electrode contacts C01, C02, and C03. In contrast to the previous studies, recordings were made at all electrode contacts and have been observed over a long-time span (OP up to 6 months after initial activation). Additionally, we employed a definition of slope that is less dependent on the maximum stimulation amplitude used. We offer multiple explanations for why slopes in the apical region are steeper and we assume all may contribute to an overall effect:
More excitable structures (predominantly dendrites) might be present in the apical region (Lai and Dillier, Citation2000; Westen et al., Citation2011).
The scala tympani in the apical region of the cochlea is narrower compared to other regions (Erixon et al., Citation2009), and is therefore forcing the electrode closer to excitable structures.
Age-related hearing loss and some types of viral caused hearing loss typically affect high frequencies (Cohen et al., Citation2014; Patel and McKinnon, Citation2018), therefore the basal part of the cochlea. Possibly, this results in less neural degradation at the apex.
Due to the different anatomical structure in the apex, there might be a wider spread of the electric field and broader excitation for high stimulation amplitudes (Bai et al., Citation2019).
Current paths for apical electric stimulation might be different (Micco and Richter, Citation2006). Given the different anatomy of the apex (Ariyasu et al., Citation1989; Erixon et al., Citation2009; Kawano et al., Citation1996) and the spatial orientation of the excitable structures, the probability for neural excitation might be higher. The second spatial derivative of the potential along a neuron is important for excitability (Rattay, Citation1986).
Recording electrode contacts, whose location is also affecting the slope, might be located closer to the spiral ganglion cells in the apex (Frijns et al., Citation2002).
Multiple studies reported an effect of age on the steepness of slope: children generally have greater slopes than adults (Brown et al., Citation2010; Cafarelli Chiou, Citation2016; Dees et al., Citation2005; Kosaner et al., Citation2018). Participants of the present study included one pediatric and 13 adult CI users. Age-related effects fall under individual ear variation in our statistical analysis: a random effect for ear was used in the linear mixed model thereby allowing to study effects of electrode contact position and point in time, independent of ear variation. Thus, the results from the linear mixed model analysis (greater slopes in the apex) are valid for this study group. As an additional confirmation we reran the analysis excluding the two youngest participants aged 8 and 30 (at surgery) and found no substantial changes in the results and conclusions (data not shown). Our first hypothesis, greater slopes for apical electrode contacts, was therefore confirmed.
Stability over time
The model results () showed that the slope did not change between surgery and initial activation. The model revealed a mild increase of slope for time points III and VI compared to IA, although this effect was smaller compared to the effect of stimulation site. The greater slope could possibly result from differences in duration of stimulation exposure: While at OP and IA the cochlea has hardly been electrically stimulated, at III and VI, the ears had several weeks of exposure. The postoperative increase of slope over time was consistent with the findings of Nehmé et al. (Citation2014). By contrast, ECAP thresholds were significantly higher intraoperatively than postoperatively (Telmesani and Said, Citation2016; Wesarg et al., Citation2010). This is in line with the results on ECAP thresholds from the present study (data not shown). Intraoperative measurements are generally expected to be less stable, probably because of higher impedance or swelling. A stable slope value over time in non-pathological cases is necessary for considering the slope to be included in a clinical procedure for diagnostic purposes. Müller et al. showed that pathologic cochlear morphology, preoperatively identified using MRI or CT scan, affects ECAP measures (Müller et al., Citation2015) and that ECAPs change over time in cases with postoperative complications like neuritis of the acoustic nerve (Müller et al., Citation2016). It was already reported by Brown et al. (Citation2010) that ECAP thresholds and AGF slopes were relatively stable over time, which Telmesani and Said (Citation2016) also observed for ECAP thresholds after surgery. Christov et al. (Citation2016) demonstrated a decrease of ECAP thresholds over the first 6 months after surgery and after stable conditions were reached. It has been previously reported that ECAP characteristics in adults are relatively stable, whereas in children, increases in electrode impedance, ECAP threshold and ECAP slope were observed beyond 1–2 months after surgery (Hughes et al., Citation2001). Miller et al. (Citation2008) found relatively stable ECAP thresholds and slopes over time in 3–5-year-old children and suggested to use the ECAP characteristics over time to monitor the status of the auditory nerve. Similarly, Tanamati et al. (Citation2009) did not observe significant changes in ECAP characteristics in children during the first year of CI usage (except for an increase in the N1 amplitude). The work of Lai et al. (Citation2004) compared changes in ECAP characteristics with fitting characteristics over time but could not predict one from the other. The second hypothesis, stable slope over time, was therefore not fulfilled as the slope increases after IA; however, this effect is small compared to the effect of the site of stimulation.
Slope and neural density
presents the simple model (Cullington, Citation2003; Kim et al., Citation2010; Nehmé et al., Citation2014) predicting that the ECAP threshold is dependent on the distance between stimulation electrode and neurons whereas the ECAP slope corresponds to the neural density. Note that this model is overly simplified by neglecting a few important effects:
The region of possible excitation does not extend linearly with increasing stimulation amplitude but is determined by the cochlear geometry, anatomy and location of the stimulation reference electrode.
The likelihood of excitation depends on the orientation of the neural structures in relation to the electrical field (second spatial derivative along the neuron’s axis according to Rattay, Citation1986).
Even for one given neuron, different parts could be excited depending on the stimulation amplitude and orientation. Additionally, with increasing stimulation amplitude, different neural populations might get excited leading to a partial cancellation (Briaire and Frijns, Citation2005) and therefore even reduction in the ECAP amplitude.
The ECAP amplitude and therefore the slope also depend on the distance between the site of generation of the action potential(s) and the recording electrode. The spatial orientation of the recording electrodes relative to the extracellularly measured action potentials plays a role as well.
Given these considerations and the fact that the real neural density cannot be assessed in living humans to validate assumptions, the absolute slope value has to be interpreted with caution. The increased slope in the apex could in part potentially also result from a different angle of the dendrites in the apex. However, if assuming that the electrode does not move and therefore the geometrical situation is stable, longitudinal measurements per patient should be studied further to possibly establish a predictor of the cochlear health. Furthermore, a clear result from this study is that the apical region behaves differently, and this fact might have to be taken into consideration when developing audio processor stimulation strategies.
Conclusions
The three most apical electrode contacts show higher slopes of ECAP AGFs (first hypothesis fulfilled). ECAP slopes do not change between surgery and initial activation but increase after initial activation (second hypothesis not fulfilled although the effect is smaller compared to the electrode position effect). In the long run, we believe that the systematic longitudinal collection of electrophysiological responses like AGF slope over time might provide useful information about the status of the nerve fibers and, crucially, a change in status. To that end, the slope parameter could potentially have clinical diagnostic relevance in the future.
Disclaimer statements
Contributors None.
Funding None.
Conflict of interest None.
Ethics approval The study protocol was approved by the Ethics Committee of the University Medicine Greifswald (BB 049/17).
Acknowledgments
The authors would like to thank the participants of the study who agreed that their data could be used for analysis. We also would like to thank Marko Takanen for helpful discussions on statistical modelling, Philipp Spitzer for helpful discussions regarding the simplified neural model and both Kathrin Lauss and Philipp Spitzer for help with wording and proof-reading the manuscript. We thank the reviewers for helpful comments and suggestions based on those we were able to improve the analysis.
References
- Abdel Salam, S., Tayel, S., Mehanna, A., Eid, M., Afifi, W. 2013. Comparison of scalar location and insertion depth of cochlear implant electrode implanted through the round window versus cochleostomy approach. Journal of International Advanced Otology, 9(1): 30–37.
- Ariyasu, L., Galey, F.R., Hilsinger, R., Byl, F.M. 1989. Computer-generated three-dimensional reconstruction of the cochlea. Otolaryngology – Head and Neck Surgery, 100(2): 87–91. doi:10.1177/019459988910000201.
- Bai, S., Encke, J., Obando-Leitón, M., Weiß, R., Schäfer, F., Eberharter, J., et al. 2019. Electrical stimulation in the human cochlea: A computational study based on high-resolution micro-CT scans. Frontiers in Neuroscience, 13: 1312. doi:10.3389/fnins.2019.01312.
- Bates, D., Mächler, M., Bolker, B., Walker, S. 2015. Fitting linear mixed-effects models using lme4. Journal of Statistical Software, 67(1): 1–48. doi:10.18637/jss.v067.i01.
- Berger, K., Hocke, T., Hessel, H. 2017. Loudness optimized registration of compound action potential in cochlear implant recipients. Laryngo-Rhino-Otologie, 96(11): 780–786. doi:10.1055/s-0043-119292.
- Briaire, J.J., Frijns, J.H.M. 2005. Unraveling the electrically evoked compound action potential. Hearing Research, 205(1–2): 143–156. doi:10.1016/j.heares.2005.03.020.
- Brill, S., Müller, J., Hagen, R., Möltner, A., Brockmeier, S.-J., Stark, T., et al. 2009. Site of cochlear stimulation and its effect on electrically evoked compound action potentials using the MED-EL standard electrode array. BioMedical Engineering OnLine, 8. doi:10.1186/1475-925X-8-40.
- Brown, C.J., Abbas, P.J., Etler, C.P., O’Brien, S., Oleson, J.J. 2010. Effects of long-term use of a cochlear implant on the electrically evoked compound action potential. Journal of the American Academy of Audiology, 21(1): 5–15. doi:10.3766/jaaa.21.1.2.
- Chiou, L.-K. 2016. The effect that design of the nucleus intracochlear electrode array and age of onset of hearing loss have on electrically evoked compound action potential growth and spread of excitation functions [dissertation]. Iowa: University of Iowa. doi:10.17077/etd.gko4dc57 .
- Christov, F., Munder, P., Berg, L., Bagus, H., Lang, S., Arweiler-Harbeck, D. 2016. ECAP analysis in cochlear implant patients as a function of patient’s age and electrode-design. European Annals of Otorhinolaryngology, Head and Neck Diseases, 133(Suppl 1): S1–S3. doi:10.1016/j.anorl.2016.04.015.
- Cohen, B.E., Durstenfeld, A., Roehm, P.C. 2014. Viral causes of hearing loss: A review for hearing health professionals. Trends in Hearing, 18. doi:10.1177/2331216514541361.
- Cullington, H.E. (Ed.). 2003. Cochlear implants: Objective measures. London, Philadelphia: Whurr Publishers.
- Dees, C., Dillier, D., Lai, N., Wallenberg, W.K., von, E., van Dijk, B., et al. 2005. Normative findings of electrically evoked compound action potential measurements using the neural response telemetry of the nucleus CI24M cochlear implant system. Audiology and Neurotology, 10(2): 105–116. doi:10.1159/000083366.
- Dhanasingh, A., Jolly, C. 2017. An overview of cochlear implant electrode array designs. Hearing Research, 356: 93–103. doi:10.1016/j.heares.2017.10.005.
- Dhanasingh, A.E., Rajan, G., van de Heyning, P. 2020. Presence of the spiral ganglion cell bodies beyond the basal turn of the human cochlea. Cochlear Implants International, 21(3): 145–152. doi:10.1080/14670100.2019.1694226.
- Erixon, E., Högstorp, H., Wadin, K., Rask-Andersen, H. 2009. Variational anatomy of the human cochlea: Implications for cochlear implantation. Otology & Neurotology, 30(1): 14–22. doi:10.1097/MAO.0b013e31818a08e8.
- Frijns, J.H.M., Briaire, J.J., Laat, J.A.P.M. de, Grote, J.J. 2002. Initial evaluation of the Clarion CII cochlear implant: Speech perception and neural response imaging. Ear and Hearing, 23(3): 184–197. doi:10.1097/00003446-200206000-00003.
- Hall, R.D. 1990. Estimation of surviving spiral ganglion cells in the deaf rat using the electrically evoked auditory brainstem response. Hearing Research, 49(1-3): 155–168. doi:10.1016/0378-5955(90)90102-U.
- He, S., Shahsavarani, B.S., McFayden, T.C., Wang, H., Gill, K.E., Xu, L., et al. 2018. Responsiveness of the electrically stimulated cochlear nerve in children with cochlear nerve deficiency. Ear and Hearing, 39(2): 238–250. doi:10.1097/AUD.0000000000000467.
- Hochmair, I., Arnold, W., Nopp, P., Jolly, C., Muller, J., Roland, P. 2003. Deep electrode insertion in cochlear implants: Apical morphology, electrodes and speech perception results. Acta Oto-laryngologica, 123(5): 612–617. doi:10.1080/00016480310001844.
- Hothorn, T., Bretz, F., Westfall, P. 2008. Simultaneous inference in general parametric models. Biometrical Journal. Biometrische Zeitschrift, 50(3): 346–363. doi:10.1002/bimj.200810425.
- Hughes, M.L., Vander-Werff, K.R., Brown, C.J., Abbas, P.J., Kelsay, D.M., Teagle, H.F., Lowder, M.W. 2001. A longitudinal study of electrode impedance, the electrically evoked compound action potential, and behavioral measures in Nucleus 24 cochlear implant users. Ear and Hearing, 22(6): 471–486. doi:10.1097/00003446-200112000-00004.
- Jiam, N.T., Jiradejvong, P., Pearl, M.S., Limb, C.J. 2016. The effect of round window vs cochleostomy surgical approaches on cochlear implant electrode position: A flat-panel computed tomography study. JAMA Otolaryngology – Head & Neck Surgery, 142(9): 873–880. doi:10.1001/jamaoto.2016.1512.
- Jiam, N.T., Limb, C.J. 2016. The impact of round window vs cochleostomy surgical approaches on interscalar excursions in the cochlea: Preliminary results from a flat-panel computed tomography study. World Journal of Otorhinolaryngology – Head and Neck Surgery, 2(3): 142–147. doi:10.1016/j.wjorl.2016.07.001.
- Kawano, A., Seldon, H.L., Clark, G.M. 1996. Computer-aided three-dimensional reconstruction in human cochlear maps: Measurement of the lengths of organ of Corti, outer wall, inner wall, and Rosenthal’s canal. Annals of Otology, Rhinology & Laryngology, 105(9): 701–709. doi:10.1177/000348949610500906.
- Kim, J.-R., Abbas, P.J., Brown, C.J., Etler, C.P., O’Brien, S., Kim, L.-S. 2010. The relationship between electrically evoked compound action potential and speech perception: A study in cochlear implant users with short electrode array. Otology & Neurotology, 31(7): 1041–1048. doi:10.1097/MAO.0b013e3181ec1d92.
- Kosaner, J., Spitzer, P., Bayguzina, S., Gultekin, M., Behar, L.A. 2018. Comparing eSRT and eCAP measurements in pediatric MED-EL cochlear implant users. Cochlear Implants International, 19(3): 153–161. doi:10.1080/14670100.2017.1416759.
- Kuznetsova, A., Brockhoff, P.B., Christensen, R.H.B. 2017. lmerTest package: Tests in linear mixed effects models. Journal of Statistical Software, 82: 13. doi:10.18637/jss.v082.i13.
- Lai, W.K., Aksit, M., Akdas, F., Dillier, N. 2004. Longitudinal behaviour of neural response telemetry (NRT) data and clinical implications. International Journal of Audiology, 43(5): 252–263. doi:10.1080/14992020400050034.
- Lai, W.K., Dillier, N. 2000. A simple two-component model of the electrically evoked compound action potential in the human cochlea. Audiology and Neurotology, 5(6): 333–345. doi:10.1159/000013899.
- Liberman, M.C., Kujawa, S.G. 2017. Cochlear synaptopathy in acquired sensorineural hearing loss: Manifestations and mechanisms. Hearing Research, 349: 138–147. doi:10.1016/j.heares.2017.01.003.
- Micco, A.G., Richter, C.-P. 2006. Tissue resistivities determine the current flow in the cochlea. Current Opinion in Otolaryngology & Head and Neck Surgery, 14(5): 352–355. doi:10.1097/01.moo.0000244195.04926.a0.
- Miller, C.A., Brown, C.J., Abbas, P.J., Chi, S.-L. 2008. The clinical application of potentials evoked from the peripheral auditory system. Hearing Research, 242(1-2): 184–197. doi:10.1016/j.heares.2008.04.005.
- Müller, A., Feick, J., Dziemba, O.C., Mir-Salim, P. 2016. Objective diagnostics and therapy of hearing loss several years after cochlear implant. Laryngo-Rhino-Otologie, 95(9): 634–635. doi:10.1055/s-0042-107352.
- Müller, A., Hocke, T., Mir-Salim, P. 2015. Intraoperative findings on ECAP-measurement: Normal or special case? International Journal of Audiology, 54(4): 257–264. doi:10.3109/14992027.2014.969410.
- Nadol Jr., J.B. 1997. Patterns of neural degeneration in the human cochlea and auditory nerve: Implications for cochlear implantation. Otolaryngology – Head and Neck Surgery, 117(3): 220–228. doi:10.1016/S0194-5998(97)70178-5.
- Nehmé, A., El Zir, E., Moukarzel, N., Haidar, H., Vanpoucke, F., Arnold, L. 2014. Measures of the electrically evoked compound action potential threshold and slope in HiRes 90K™ users. Cochlear Implants International, 15(1): 53–60. doi:10.1179/1754762813Y.0000000039.
- Patel, R., McKinnon, B.J. 2018. Hearing loss in the elderly. Clinics in Geriatric Medicine, 34(2): 163–174. doi:10.1016/j.cger.2018.01.001.
- Pfingst, B.E., Colesa, D.J., Swiderski, D.L., Hughes, A.P., Strahl, S.B., Sinan, M., Raphael, Y. 2017. Neurotrophin gene therapy in deafened ears with cochlear implants: Long-term effects on nerve survival and functional measures. Journal of the Association for Research in Otolaryngology, 18(6): 731–750. doi:10.1007/s10162-017-0633-9.
- Pfingst, B.E., Hughes, A.P., Colesa, D.J., Watts, M.M., Strahl, S.B., Raphael, Y. 2015. Insertion trauma and recovery of function after cochlear implantation: Evidence from objective functional measures. Hearing Research, 330: 98–105. doi:10.1016/j.heares.2015.07.010.
- Polak, M., Hodges, A.V., King, J.E., Balkany, T.J., Polak, M., King, J.E., Balkany, T.J. 2004. Further prospective findings with compound action potentials from Nucleus 24 cochlear implants. Hearing Research, 188(1-2): 104–116. doi:10.1016/S0378-5955(03)00309-5.
- Rader, T., Döge, J., Adel, Y., Weissgerber, T., Baumann, U. 2016. Place dependent stimulation rates improve pitch perception in cochlear implantees with single-sided deafness. Hearing Research, 339: 94–103. doi:10.1016/j.heares.2016.06.013.
- Ramekers, D., Versnel, H., Strahl, S.B., Smeets, E.M., Klis, S.F.L., Grolman, W. 2014. Auditory-nerve responses to varied inter-phase gap and phase duration of the electric pulse stimulus as predictors for neuronal degeneration. Journal of the Association for Research in Otolaryngology, 15(2): 187–202. doi:10.1007/s10162-013-0440-x.
- Rattay, F. 1986. Analysis of models for external stimulation of axons. IEEE Transactions on Biomedical Engineering, 33(10): 974–977. doi:10.1109/TBME.1986.325670.
- R Core Team. 2018. R: A language and environment for statistical computing. Vienna, Austria. Available from: https://www.R-project.org/.
- Schvartz-Leyzac, K.C., Pfingst, B.E. 2016. Across-site patterns of electrically evoked compound action potential amplitude-growth functions in multichannel cochlear implant recipients and the effects of the interphase gap. Hearing Research, 341: 50–65. doi:10.1016/j.heares.2016.08.002.
- Stakhovskaya, O., Sridhar, D., Bonham, B.H., Leake, P.A. 2007. Frequency map for the human cochlear spiral ganglion: Implications for cochlear implants. Journal of the Association for Research in Otolaryngology, 8(2): 220–233. doi:10.1007/s10162-007-0076-9.
- Tanamati, L.F., Bevilacqua, M.C., Costa, O.A. 2009. Longitudinal study of the ecap measured in children with cochlear implants. Brazilian Journal of Otorhinolaryngology, 75(1): 90–96. doi:10.1016/S1808-8694(15)30837-5.
- Telmesani, L.M., Said, N.M. 2016. Electrically evoked compound action potential (ECAP) in cochlear implant children: Changes in auditory nerve response in first year of cochlear implant use. International Journal of Pediatric Otorhinolaryngology, 82: 28–33. doi:10.1016/j.ijporl.2015.12.027.
- van de Heyning, P., Arauz, S.L., Atlas, M., Baumgartner, W.-D., Caversaccio, M., Chester-Browne, R., et al. 2016. Electrically evoked compound action potentials are different depending on the site of cochlear stimulation. Cochlear Implants International, 17(6): 251–262. doi:10.1080/14670100.2016.1240427.
- van Eijl, R.H.M., Buitenhuis, P.J., Stegeman, I., Klis, S.F.L., Grolman, W. 2017. Systematic review of compound action potentials as predictors for cochlear implant performance. The Laryngoscope, 127(2): 476–487. doi:10.1002/lary.26154.
- Wanna, G.B., Noble, J.H., Carlson, M.L., Gifford, R.H., Dietrich, M.S., Haynes, D.S., et al. 2014. Impact of electrode design and surgical approach on scalar location and cochlear implant outcomes. The Laryngoscope, 124(Suppl 6): S1–S7. doi:10.1002/lary.24728.
- Wanna, G.B., Noble, J.H., Gifford, R.H., Dietrich, M.S., Sweeney, A.D., Zhang, D., et al. 2015. Impact of intrascalar electrode location, electrode type, and angular insertion depth on residual hearing in cochlear implant patients: Preliminary results. Otology & Neurotology, 36(8): 1343–1348. doi:10.1097/MAO.0000000000000829.
- Wesarg, T., Battmer, R.-D., Garrido, L.C., Dillier, N., Garcia-Ibáñez, L., Hey, M., et al. 2010. Effect of changing pulse rate on profile parameters of perceptual thresholds and loudness comfort levels and relation to ECAP thresholds in recipients of the Nucleus CI24RE device. International Journal of Audiology, 49(10): 775–787. doi:10.3109/14992027.2010.492401.
- Westen, A.A., Dekker, D.M.T., Briaire, J.J., Frijns, J.H.M. 2011. Stimulus level effects on neural excitation and eCAP amplitude. Hearing Research, 280(1–2): 166–176. doi:10.1016/j.heares.2011.05.014.
- Zhou, L., Friedmann, D.R., Treaba, C., Peng, R., Roland, J.T. 2014. Does cochleostomy location influence electrode trajectory and intracochlear trauma? Cochlear Implants International, 15(Suppl 1): S8–S10. doi:10.1179/1467010014Z.000000000160.