
 ?Mathematical formulae have been encoded as MathML and are displayed in this HTML version using MathJax in order to improve their display. Uncheck the box to turn MathJax off. This feature requires Javascript. Click on a formula to zoom.
ABSTRACT
Recently, a massive magnetocaloric effect near the liquefaction temperature of hydrogen has been reported in the ferromagnetic material HoB2. Here we investigate the effects of Dy substitution in the magnetocaloric properties of Ho1-xDyxB2 alloys (x = 0, 0.3, 0.5, 0.7, 1.0). We find that the Curie temperature (TC) gradually increases upon Dy substitution, while the magnitude of the magnetic entropy change |ΔSM| and adiabatic temperature change ΔTad showed a gradual decrease. On the other hand, due to the presence of successive transitions in these alloys, the peak height of the above magnetocaloric properties tends to be kept in a wide temperature range, leading to a relatively robust figure of merit in a wide temperature span. These alloys could be interesting candidates for magnetic refrigeration in the temperature range of 10–60 K.
Graphical abstract

1. Introduction
Magnetic refrigeration is an emerging environmentally friendly technology for refrigeration applications, as it does not require to use of greenhouse gases and does not depend on conventional gas compression cycles [Citation1–3] while having possible higher cycle efficiency [Citation1,Citation4]. It is based on the magnetocaloric effect (MCE), which consists of the adiabatic temperature change (ΔTad) a magnetic material will undergo when a magnetic field is applied/removed adiabatically, but it can also be evaluated in terms of the magnetic entropy change (ΔSM) this magnetic material will undergo for the same field change, where ΔSM usually peaks at the magnetic transition temperature (Tmag).
Recently, our group has unveiled a giant magnetocaloric effect of |ΔSMMAX| = 0.35 J cm−3 K−1 (40.1 J kg−1 K−1) in the vicinity of a ferromagnetic transition at the Curie temperature (TC) of 15 K for a field change of μ0ΔH = 5 T in HoB2 [Citation5]. Due to the closeness of its TC to the liquefaction point of hydrogen (20.3 K), this material became an attractive candidate for use in low-temperature magnetic refrigeration applications focused on the liquefaction stage of hydrogen. Hydrogen is considered to be one of the most promising replacements for hydrocarbon fuels as a clean energy source [Citation6,Citation7] and in particular liquid hydrogen is widely needed in the space industry [Citation8] and its liquid form is one the suitable way for transportation and storage [Citation9]. In this context, the discovery of magnetic materials with a high MCE effect at low temperatures is imperative for the development of such refrigerators working at cryogenic temperatures. Since the magnetocaloric effect peaks at Tmag, tuning the TC of HoB2 to a higher temperature is of extreme interest to examine HoB2-based materials as possible candidates for refrigeration before the liquefaction stage, especially below temperatures of 77 K.
DyB2 orders ferromagnetically at TC = 50 K [Citation10,Citation11] and exhibits a |ΔSM| of 0.16 J cm−3 K−1 (17.1 J kg−1 K−1) for μ0ΔH = 5 T [Citation12]; 9 therefore a partial substitution of Ho by Dy is expected to shift TC to higher values in the expense of a probable reduction of |ΔSM|. Also, since both materials exhibit two consecutive transitions, it is interesting to investigate the effect of alloying in the MCE properties of this system. In this work, we study the magnetocaloric properties of Ho1-xDyxB2 alloys (x = 0, 0.3, 0.5, 0.7, 1.0) and compare with other well-known materials working at the same temperature span.
All the magnetocaloric properties of the samples are reported in volumetric units (J cm−3 K−1) as this is the adequate unit when comparing materials for application purposes as there is a volume limit when constructing real applications [Citation13,Citation14]. Therefore, herein all comparisons with other materials is done in this unit by converting it using the ideal density of each material when not provided.
2. Experimental section
2.1. Sample synthesis
Polycrystalline samples of Ho1-xDyxB2 were prepared by an arc-melting process in a water-cooled copper hearth arc furnace under Ar atmosphere. Stoichiometric amounts of Ho (99.9% purity), Dy (99.9% purity), and B (99.5% purity) were weighted and then arc melted several times. During the synthesis trials, we found out that annealing under different conditions did not change the X-ray diffraction patterns of the obtained samples, therefore no annealing was carried out in this work.
2.2. Characterization
Powder X-ray diffraction (XRD) patterns of the arc-melted samples were investigated using a MiniFlex 600 (Rigaku, Japan) with Cu Kα radiation. The lattice parameters, the volume of the unit cell, and density were obtained by refining the XRD patterns using the FULLPROF [Citation15] software.
2.3. Magnetization measurements
Magnetization measurements were carried out by a superconducting quantum interference device magnetometer contained in the Magnetic Property Measurement System XL (Quantum Design, US). Zero-field cooling (ZFC) and field cooling (FC) measurement at low fields were taken to evaluate the evolution of TC as a function of Dy content. For the evaluation of |ΔSM| the magnetization measurements of the sample under various applied fields ranging from 0.01 to 5 T were performed in ZFC process.
3. Results and discussion
3.1. Crystal structure
shows the XRD patterns for the obtained arc melted samples. The main phase peaks can be indexed into a hexagonal P6/mmm AlB2 type crystal structure as shown by the red fitting curves. The remaining peaks are assigned as REB4, unreacted RE or RE2O3 (RE = Ho, Dy) impurity peaks marked by a black square (■), a black star (★), or a black diamond (♦) respectively. The obtained lattice parameters, the volume of the unit cell, and density are summarized in .
Table 1. Lattice parameters obtained from XRD patterns for Ho1-xDyxB2.
Figure 1. Powder XRD patterns and lattice constant evolution for Ho1-xDyxB2 alloys. (a) XRD patterns of the obtained alloys. The red lines show the calculated patterns from Rietveld refinement for the REB2 main phase. The black square (■) marks an REB4 impurity phase, while the black star (★) marks a RE impurity peak and the black diamond (♦) marks a RE2O3 impurity peak (RE = Ho, Dy). (b) The lattice parameters normalized by the value at x = 0, as a function of x. The black dashed line shows a guide based on Vegard’s law, given by where (a,c)0,1 is the lattice constants at x = 0 or 1
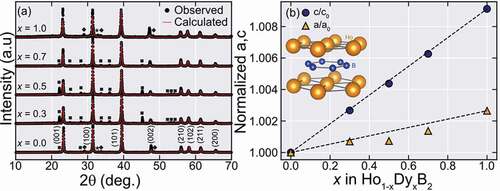
As shown in , Dy substitution in the Ho site seems to strongly affect the c-axis length while the a-axis length weakly changes, illustrated in where we plot the normalized lattice parameters (a/a0 and c/c0) by the value of x = 0. Both c/c0 and a/a0 increase with x, roughly following the so-called Vegard’s law (marked by the dashed black line), but with different rates. The observed changes in the lattice constants in Ho1-xDyxB2 suggest that the substitution of Ho by Dy in the REB2 main phase was successful, and these partially substituted samples can be in the form of a random alloy. We note that in the case of HoB2-xSix solid solutions [Citation10] where B site is partially substituted, it has been reported that the expansion rate of a-axis length and c-axis length are comparable to each other. This difference in the change of lattice constants between Ho1-xDyxB2 and HoB2-xSix implies that the a-axis and c-axis lengths in HoB2-based compounds might be closely related to the bonds along axes. Namely, c-axis length seems to be depending on Ho-B bonds and be sensitive to both rare-earth and B-site atoms, while the a-axis length might be more dependent on the B site atom.
3.2. Magnetic properties
The ZFC-FC isofield magnetization (M-T) curves for an applied field of µoH = 0.01 T and isothermal magnetization (M-H) curves measured at T = 5 K are shown in for each obtained sample, respectively. For the Dy containing samples, the divergence between the ZFC and FC M-T curves becomes more pronounced and a small magnetic hysteresis in the M-H curves is observed, including the end-material DyB2.
Figure 2. Isofield (M-T) ZFC-FC, Normalized temperature-dependent derivatives of the ZFC curves, and Isothermal (M-H) magnetization curves of Ho1-xDyxB2 alloys. (a-e) ZFC and FC curves for all synthesized alloys for an applied field of µ0H = 0.01 T. The lower panels show the derivatives of the ZFC curves normalized by the minimum of the derivative value. The two magnetic transitions TC and T*, are marked by the arrows. (f-g) Isothermal magnetization at T = 5 K
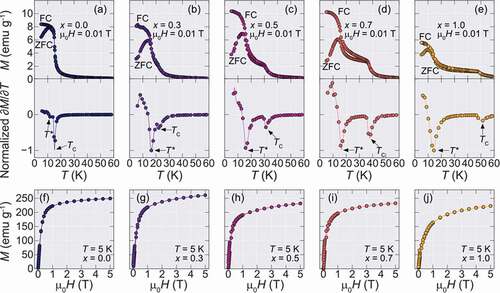
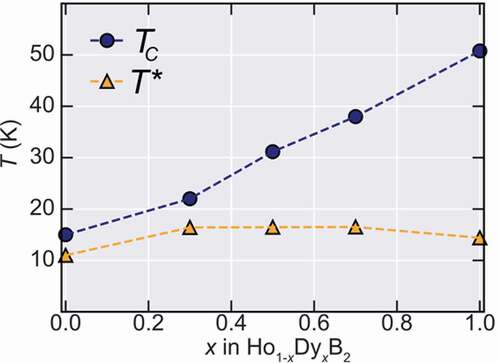
To evaluate the magnetic transition temperatures in this system, the temperature-dependent derivative of the ZFC curves was taken and are shown in the lower panels of . The Curie temperatures that are defined by the peak position in ∂M/∂T curves, are marked by the TC arrows, showing a systematic increase with Dy content. On the other hand, a second magnetic transition marked by T* that is observed at lower temperatures, which is also observed at HoB2 at T* = 11 K [Citation5] and DyB2 at T* = 15 K [Citation12], seems to be almost unchanged by partial substitution of Dy. The origin of T* was attributed to a possible spin-reorientation mechanism [Citation12], however, the nature of this transition is still unknown and its investigation is outside the scope of this work. The Dy doping dependence of both transitions is summarized in showing the monotonic increase of TC until 50 K, while T* remains almost constant.
Figure 3. Phase diagram between ordering temperature and doping amount (x) for Ho1-xDyxB2. The blue filled circles show the evolution of TC while the orange triangles show T*. While TC increases monotonically with x, T* remains almost constant
3.3. Magnetocaloric properties
For evaluating the magnetocaloric effect of the obtained samples, M-T curves in a wide range of applied magnetic fields were measured for all samples, shown in , and |ΔSM| was calculated using the Maxwell relation:
Figure 4. M-T curves at a vast range of applied fields and obtained magnetic entropy change for Ho1-xDyxB2 alloys. (a-e) The obtained M-T curves measured by ZFC process from µ0H = 5 T to 0.01 T. (f-j) Magnetic entropy changes for Ho1-xDyxB2 alloys for µ0ΔH ranging from 1 to 5 T obtained from the M-T curves of (a-e). (k)-(o) Estimated adiabatic temperature change for Ho1-xDyxB2 alloys for µ0ΔH ranging from 1 to 5 T [Citation21]. With the increase of Dy content, the maximum value of |ΔSM| decreases from 0.35 J cm−3 K−1 (x = 0) to 0.16 J cm−3 K−1 (x = 1.0)
![Figure 4. M-T curves at a vast range of applied fields and obtained magnetic entropy change for Ho1-xDyxB2 alloys. (a-e) The obtained M-T curves measured by ZFC process from µ0H = 5 T to 0.01 T. (f-j) Magnetic entropy changes for Ho1-xDyxB2 alloys for µ0ΔH ranging from 1 to 5 T obtained from the M-T curves of (a-e). (k)-(o) Estimated adiabatic temperature change for Ho1-xDyxB2 alloys for µ0ΔH ranging from 1 to 5 T [Citation21]. With the increase of Dy content, the maximum value of |ΔSM| decreases from 0.35 J cm−3 K−1 (x = 0) to 0.16 J cm−3 K−1 (x = 1.0)](/cms/asset/2b515fba-b322-42e8-9803-4da4288f71e1/tsta_a_1856629_f0004_oc.jpg)
The obtained |ΔSM| for fields up to 5 T is shown in .
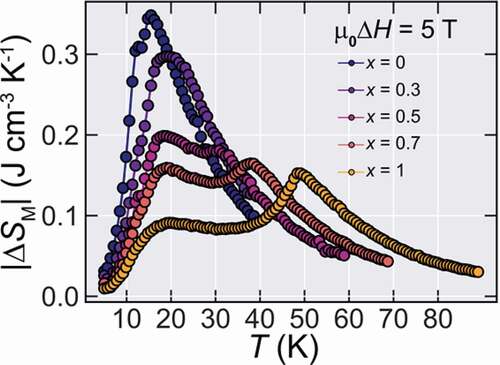
Due to the presence of the two transitions at T* and TC, two peaks appear at |ΔSM|. Therefore, here we will define and compare the maximum entropy change |ΔSMMAX| as |ΔSM(T = TC)|, since T* remains almost unchanged during the whole doping range and is always lower than 15 K while we are interested in the |ΔSM| peak shifted toward higher temperature by Dy doping. In this way, the obtained values of |ΔSMMAX| for µ0ΔH = 5 T were 0.35, 0.3, 0.18, 0.16 and 0.15 J cm−3 K−1 for x = 0, 0.3, 0.5, 0.7 and 1.0, respectively.
In addition to the change in the magnitude of |ΔSMMAX|, an interesting characteristic appears in the |ΔSM| curves of Ho1-xDyxB2. That is, since there are multiple transitions in this series of alloys, even though there is a net loss at |ΔSMMAX|, the entropy change curve shows an increase of δTFWHM, defined as the region in the entropy curve where |ΔSM| ≥ |ΔSMMAX|/2, leading to a gain in maximum entropy change for higher temperature spans. Such a widening of the |ΔSM| curves due to multiple transitions has been commonly observed in materials that show more than one magnetic transition [Citation16–18] and it tends to lead to a high figure of merits. The |ΔSM| for all samples for a field change of μ0ΔH = 5 T is shown in .
Figure 5. |ΔSM| at µ0ΔH = 5 T for Ho1-xDyxB2 alloys
Another important property in the magnetocaloric performance of materials is the adiabatic temperature change ΔTad. Here, we estimated the S(T, H) (shown in Figure S1.) curves by first calculating the zero-field entropy from specific heat data (not shown here) and then we obtain the field-dependent entropy by subtracting the values of |ΔSM| to the zero-field entropy, in the same manner as Refs. [Citation5,Citation19]. For the x = 0, we used the previously reported data of Ref [Citation5]., and for the x = 1 sample, we used the previously reported zero-field specific heat data of Ref [Citation20]. Then, the ΔTads is estimated by taking the horizontal difference between the entropy curves under zero field and final field [Citation21] and the results are shown in . Interestingly, the two-peak structure of |ΔSM| is also reflected in ΔTad and thus these alloys tend to show high ΔTad in relatively wide temperature range, that is an important characteristic for practical applications [Citation22]. Here we estimated ΔTadMAX in the same way as |ΔSMMAX|, that is, ΔTadMAX = ΔTad (T = TC). The obtained ΔTadMAX is 12 K, 11.5 K, 8.6 K, 8.0 K and 7.2 K for x = 0, 0.3, 0.5, 0.7 and 1.0, respectively for µ0ΔH = 5 T.
Let us compare the magnetocaloric properties in Ho1-xDyxB2 with those of representative materials that often show prominent magnetocaloric effect with transition temperatures ranging up to 77 K, based on Figure S5 of Ref [Citation5]. Here we consider ΔSM, ΔTad, and Temperature averaged Entropy Curve (TEC) as a practical figure of merit proposed earlier [Citation23]. The last value is defined as:
Where Tmid is chosen to maximize the value of TEC in a given working temperature range of a material (ΔTlift) (Conventional figure of merits such as refrigerant capacity and relative cooling power are also tabulated in supplementary information).
For this purpose, the values of entropy change of the materials for comparison are converted into volumetric units by using the density contained in the AtomWork [Citation24] database, unless otherwise provided by the authors. Also, the values of TEC (10) and TEC (20) are estimated from the reported entropy curves within the contained references when not reported by the authors. We show the obtained values for |ΔSMMAX|, |ΔTadMAX|, TEC (10), and TEC (20) in . Also, the ΔTlift-dependence of TEC in selected materials is shown in .
Figure 6. Maximum entropy and adiabatic temperature change and TEC values for Ho1-xDyxB2 alloys and diverse compounds for µ0ΔH = 5 T. (a) |ΔSMMAX| and (b) |ΔTadMAX| as a function of the magnetic ordering temperature Tmag. (c) Values of TEC for ΔTlift = 10 K and (d) for ΔTlift = 20 K. (e) TEC as a function of ΔTlift for few representative materials with high TEC 10 values. The normal and dashed lines guide for the eyes. The TEC values were obtained by using the reported entropy curves within each material reference
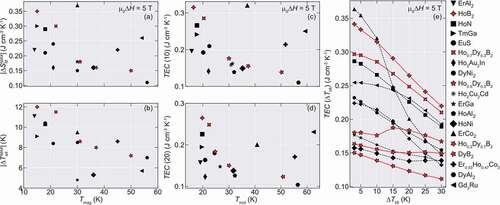
In the temperature range of 15–20 K, HoB2 and Ho0.7Dy0.3B2 show superior |ΔSMMAX| and ΔTadMAX for µ0ΔH = 5 T, when compared to compounds with similar Tmag such as ErAl2 [Citation25], TmGa [Citation26], EuS [Citation27], HoN [Citation28,Citation29], DyNi2 [Citation25] and Ho2Au2In [Citation30]. For the materials with transition temperatures around 30 K, even though Ho0.5Dy0.5B2 shows similar |ΔSMMAX| to Ho2Cu2Cd [Citation18] and ErGa [Citation31], it has a comparable |ΔTadMAX| to HoAl2 [Citation32] and ErCo2 [Citation33]. Similarly, Ho0.3Dy0.7B2 has almost the same |ΔSMMAX| as HoNi [Citation34,Citation35], however with a much larger |ΔTadMAX|. In the case of DyB2, even though it shows almost half of |ΔSM| compared to Gd3Ru [Citation36], its |ΔTadMAX| is higher and comparable to DyAl2 [Citation37], although both of them are lower than Er0.53Ho0.47Co2 [Citation38,Citation39]. Furthermore, the TEC in Ho1-xDyxB2 alloys tends to be relatively robust for a higher value of ΔTlift, due to the multiple transition nature in these materials. This suggests that Ho1-xDyxB2 alloys could support a wide temperature span while keeping the figure of merit and indicate that Ho1-xDyxB2 alloys might be an option for use in magnetic refrigeration ranging from 10 to 60 K as similar materials with Tmag within this range.
4. Conclusions
In this work, we have systematically evaluated the effects of Dy substitution on the giant magnetocaloric effect of HoB2. Even if there is a net loss in the peak value of the |ΔSM|, the observed two-peak structure in both the magnetic entropy and adiabatic temperature change might indicate these materials could possibly sustain a large working temperature range based on the figure of merit analysis. Therefore, these alloys could be an option to work as magnetic refrigerants in the temperature range from 10 to 60 K.
tsta_a_1856629_sm1810.pdf
Download PDF (192.4 KB)Acknowledgments
We acknowledge fruitful discussions with Mohammed Elmassalami and Akiko T. Saito. This work was partly supported by the JST-Mirai Program “Development of advanced hydrogen liquefaction system by using magnetic refrigeration technology”, the JSPS KAKENHI, and the JST-CREST. P.B. Castro acknowledges the scholarship support from the Ministry of Education, Culture, Sports, Science and Technology (MEXT), Japan.
Disclosure statement
The authors declare no conflict of interest.
Supplemental Material
Supplemental data for this article can be accessed here
Additional information
Funding
References
- Gschneidner KA, Pecharsky VK. Magnetocaloric Materials. Annu Rev Mater Sci. 2000;30:387–429.
- Franco V, Blázquez JS, Ipus JJ, et al. Magnetocaloric effect: from materials research to refrigeration devices. Prog Mater Sci. 2018;93:112–232.
- Tegus O, Brück E, Buschow KHJ, et al. Transition-metal-based magnetic refrigerants for room-temperature applications. Nature. 2002;415:150–152.
- Numazawa T, Kamiya K, Utaki T, et al. Magnetic refrigerator for hydrogen liquefaction. Cryogenics (Guildf). 2014;62:185–192.
- de Castro PB, Terashima K, Yamamoto TD, et al. Machine-learning-guided discovery of the gigantic magnetocaloric effect in HoB2 near the hydrogen liquefaction temperature. NPG Asia Mater. 2020;12:35.
- Johnston B, Mayo MC, Khare A. Hydrogen: the energy source for the 21st century. Technovation. 2005;25:569–585.
- Jones LW. Liquid hydrogen as a fuel for the future. Science. 1971;174:367–370.
- Shirron PJ. Applications of the magnetocaloric effect in single-stage, multi-stage and continuous adiabatic demagnetization refrigerators. Cryogenics (Guildf). 2014;62:130–139.
- Sherif SA, Zeytinoglu N, Veziroǧlu TN. Liquid hydrogen: potential, problems, and a proposed research program. Int J Hydrogen Energy. 1997;22:683–688.
- Roger J, Babizhetskyy V, Guizouarn T, et al. The ternary RE-Si-B systems (RE = Dy, Ho, Er and Y) at 1270 K: solid state phase equilibria and magnetic properties of the solid solution REB2-xSix (RE = Dy and Ho). J Alloys Compd. 2006;417:72–84.
- Novikov VV, Matovnikov AV, Volkova OS, et al. Synthesis, thermal and magnetic properties of RE-diborides. J Magn Magn Mater. 2017;428:239–245.
- Meng H, Li B, Han Z, et al. Reversible magnetocaloric effect and refrigeration capacity enhanced by two successive magnetic transitions in DyB2. Sci China Technol Sci. 2012;55:501–504.
- Gschneidner A, Pecharsky VK, Tsokol AO. Recent developments in magnetocaloric materials. Reports Prog Phys. 2005;68:1479–1539.
- Gottschall T, Skokov KP, Fries M, et al. Making a cool choice: the materials library of magnetic refrigeration. Adv Energy Mater. 2019;9:1901322.
- Carvajal J, FULLPROF: A Program for rietveld refinement and pattern matching analysis. Abstr. Satell. Meet. Powder Diffr. XV Congr. IUCr. 1990. p. 127. Toulouse, France.
- Zheng XQ, Chen J, Shen J, et al. Large refrigerant capacity of RGa (R = Tb and Dy) compounds. J Appl Phys. 2012;111:07A917.
- Zhang Y, Xu X, Yang Y, et al. Study of the magnetic phase transitions and magnetocaloric effect in Dy2Cu2In compound. J Alloys Compd. 2016;667:130–133.
- Yi Y, Li L, Su K, et al. Large magnetocaloric effect in a wide temperature range induced by two successive magnetic phase transitions in Ho2Cu2Cd compound. Intermetallics. 2017;80:22–25.
- Tan X, Chai P, Thompson CM, et al. Magnetocaloric effect in AlFe2B2: toward magnetic refrigerants from earth-abundant elements. J Am Chem Soc. 2013;135:9553–9557.
- Novikov VV, Matovnikov AV. Low-temperature heat capacity of dysprosium diboride. J Therm Anal Calorim. 2007;88:597–599.
- Note that here an assumption that the adiabatic route tracks the horizontal line in S(H,T) is made, and that might not be valid in the case of crossing two successive transitions.
- Engelbrecht K, Bahl CRH. Evaluating the effect of magnetocaloric properties on magnetic refrigeration performance. J Appl Phys. 2010;108:123918.
- Griffith LD, Mudryk Y, Slaughter J, et al. Material-based figure of merit for caloric materials. J Appl Phys. 2018. American Institute of Physics Inc. DOI: https://doi.org/10.1063/1.5004173.
- Xu Y, Yamazaki M, Villars P. Inorganic materials database for exploring the nature of material. Jpn J Appl Phys. 2011;50:11RH02.
- von Ranke PJ, Pecharsky VK, Gschneidner KA. Influence of the crystalline electrical field on the magnetocaloric effect of DyAl2, ErAl2 and DyNi2. Phys Rev B. 1998;58:12110–12116.
- Mo Z-J, Shen J, Yan L-Q, et al. Low field induced giant magnetocaloric effect in TmGa compound. Appl Phys Lett. 2013;103:52409.
- Li DX, Yamamura T, Nimori S, et al. Large reversible magnetocaloric effect in ferromagnetic semiconductor EuS. Solid State Commun. 2014;193:6–10.
- Yamamoto TA, Nakagawa T, Sako K, et al. Magnetoca-loric effect of rare earth mono-nitrides, TbN and HoN. J Alloys Compd. 2004;376:17–22.
- Nishio S, Nakagawa T, Arakawa T, et al. Specific heat and thermal conductivity of HoN and ErN at cryogenic temperatures. J Appl Phys. 2006;99:08K901.
- Li L, Yi Y, Su K, et al. Magnetic properties and large magnetocaloric effect in Ho2Cu2 In and Ho2Au2 In compounds. J Mater Sci. 2016;51:5421–5426.
- Chen J, Shen BG, Dong QY, et al. Large reversible magnetocaloric effect caused by two successive magnetic transitions in ErGa compound. Appl Phys Lett. 2009;95:132504.
- Gil LA, Campoy JCP, Plaza EJR, et al. Conventional and anisotropic magnetic entropy change in HoAl2 ferromagnetic compound. J Magn Magn Mater. 2016;409:45–49.
- Wada H, Tanabe Y, Shiga M, et al. Magnetocaloric effects of laves phase Er(Co1−xNix)2 compounds. J Alloys Compd. 2001;316:245–249.
- Zheng XQ, Zhang B, Wu H, et al. Large magnetocaloric effect of HoxEr1-x Ni (0 ≤ x ≤ 1) compounds. J Appl Phys. 2016;120:163907.
- Kinami N, Wakiya K, Uehara M, et al. Magneto-caloric effect in single-crystal HoNi with a canted magnetic structure. Jpn J Appl Phys. 2018;57:103001.
- Monteiro JCB, Dos Reis RD, Gandra FG. The physical properties of Gd3Ru: A real candidate for a practical cryogenic refrigerator. Appl Phys Lett. 2015;106:194106.
- Hashimoto T, Matsumoto K, Kurihara T, et al. Investigations on the possibility of the RAl 2 system as a refrigerant in an ericsson type magnetic refrigerator. Boston, MA: Springer US; 1986. p. 279–286. Adv. Cryog. Eng. Mater.
- Matsumoto K, Numazawa T. Magnetic refrigerator for hydrogen liquefaction. TEION KOGAKU (J Cryog Supercond Soc Japan). 2015;50:66–71.
- Zhu Y, Asamoto K, Nishimura Y, et al. Magnetocaloric effect of (ErxR1-x)Co2 (R = Ho, Dy) for magnetic refrigeration between 20 and 80 K. Cryogenics (Guildf). 2011;51:494–498.