
ABSTRACT
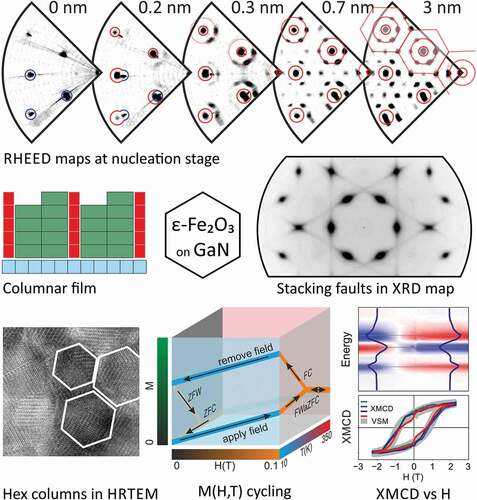
In the present paper we discuss correlations between crystal structure and magnetic properties of epitaxial ε-Fe2O3 films grown on GaN. The large magnetocrystalline anisotropy and room temperature multiferroic properties of this exotic iron oxide polymorph, make it a perspective material for the development of low power consumption magnetic media storage devices. Extending our recent progress in PLD growth of ε-Fe2O3 on the surface of technologically important nitride semiconductors, we apply reciprocal space tomography by electron and x-ray diffraction to investigate the break of crystallographic symmetry occurring at the oxide-nitride interface resulting in the appearance of anisotropic crystallographic disorder in the sub-100 nm ε-Fe2O3 films. The orthorhombic-on-hexagonal nucleation scenario is shown responsible for the development of a peculiar columnar structure observed in ε-Fe2O3 by means of HRTEM and AFM. The complementary information on the direct and reciprocal space structure of the columnar ε-Fe2O3 films is obtained by various techniques and correlated to their magnetic properties. The peculiar temperature dependence of magnetization studied by the small-field magnetization derivative method and by neutron diffraction reveals the existence of a magnetic softening below 150 K, similar to the one observed earlier solely in nanoparticles. The magnetization reversal in ε-Fe2O3 films probed by X-ray magnetic circular dichroism is found different from the behavior of the bulk averaged magnetization measured by conventional magnetometry. The presented results fill the gap between the numerous studies performed on randomly oriented ε-Fe2O3 nanoparticles and much less frequent investigations of epitaxial epsilon ferrite films with lattice orientation fixed by the substrate.
Graphical abstract
1. Introduction
Integration of semiconducting and magnetic materials into a single heterostructure is expected to provide opportunities for designing novel functional spintronic devices. The iron oxides form a vast family of magnetic materials exhibiting a rich variety of outstanding physical properties. Among these the metastable ε-Fe2O3 is the most intriguing phase not existing in the bulk form. The ε-Fe2O3 phase is ferrimagnetic with a huge magnetocrystalline anisotropy responsible for the coercivity values usually exceeding 2 T in the nanocrystalline (NC) form [Citation1] and 1 T in epitaxial films [Citation2–4]. In the nanocrystalline form ε-Fe2O3 exhibits a still not fully explained low-temperature phase transition between 100 and 200 K accompanied by a small decrease of magnetization and a large decrease in the coercivity [Citation5]. High coercive field values, room temperature ferroelectric and magnetoelectric properties [Citation6] makes ε-Fe2O3 a perspective material to be used in the future low power consumption magnetic media storage devices [Citation7]. The majority of the early works related to ε-Fe2O3 were dedicated to randomly oriented nanoparticles [Citation7–9]. Fabrication of ε-Fe2O3 epitaxial layers on STO, Al2O3 and YSZ [Citation2,Citation6,Citation10,Citation11] was later demonstrated. Quite recently it has been shown [Citation3] that the epitaxial layers of ε-Fe2O3 (along with various other iron oxide polymorphs) can be controllably grown by pulsed laser deposition on GaN(0001). Coupling a multiferroic material to the semiconducting nitride is supposed to be technologically important for potential extension of the capabilities of the modern AIII-BV based microelectronic devices such as bright LEDs, HEMT transistors for high-power, high-frequency, high-temperature and high radiation resistant applications. Placing a room temperature multiferroic layer with controllable magnetization/polarization in contact with a semiconductor adds the functionality of controlling optical, electronic, and magnetic properties of the heterostructure by applied voltage [Citation12–15]. In our previous papers we have demonstrated by using RHEED and XRD that ε-Fe2O3 films grow on GaN with the [001] polarization axis perpendicular to the surface and the [100] easy magnetization axis lying in plane [Citation3]. The films of ε-Fe2O3 were shown to grow on GaN in the same epitaxial process as α-Fe2O3 and γ-Fe2O3 polymorphs. Thus a carefully control of the growth parameters (growth temperature above 800°C and oxygen pressure of about 0.2 mbar) is required to drive the growth towards formation of the epsilon ferrite. The ε-Fe2O3 epitaxial films on GaN were shown to exhibit magnetization reversal loops with a coercive field of up to 2 T and saturation of above 100 emu/cm3. An additional soft magnetic component appearing in MH loops can be ascribed to the interface magnetism as followed from the polarized neutron reflectometry studies carried out for ε-Fe2O3/GaN [Citation4] and ε-Fe2O3/MgO/GaN [Citation16] films.
The present paper describes a detailed investigation into the growth, crystal structure and magnetic properties of the multiferroic-on-semiconductor epitaxial films of ε-Fe2O3/GaN. Highlighted are the issues related to the nucleation of the ε-Fe2O3/GaN interface and the anisotropic disorder appearing at the nucleation stage. The nucleation of this disorder at the oxide-nitride interface and its development into the columnar structure of the thicker epsilon ferrite film is studied by a combination of reciprocal and direct space techniques such as 3D reciprocal space mapping by electron and X-ray diffraction and high-resolution transmission electron microscopy. The relation of the film columnar structure to the magnetic properties of the ε-Fe2O3 films including the temperature dependence of magnetization is studied by means of bulk averaging vibrating sample magnetometry and iron coordination sensitive X-ray magnetic circular dichroism. For the first time an epitaxial ε-Fe2O3 film was studied by neutron diffraction in the range of temperatures between 20 K and 300 K. The obtained results are supposed to fill the gap between the numerous studies performed on ε-Fe2O3 nanoparticles and much less frequent investigations of epsilon ferrite films with lattice orientation fixed by the substrate.
2. Materials and methods
The epsilon ferrite films were grown by means of pulsed laser deposition (PLD setup produced by SURFACE, Germany) on the Ga terminated surface of the 3 mkm GaN (0001)/Al2O3 template fabricated by means of metalorganic vapour-phase epitaxy. The iron oxide was grown from a Fe2O3 stoichiometric target ablated by CompexPro 201 (Coherent, USA) KrF excimer laser. The growth was performed in oxygen at a pressure of 0.2 mbar with the substrate temperature in the range of 750–850°C. The crystallinity, epitaxial relations and defect structure of the grown layers was monitored by in-situ high energy electron diffraction (RHEED) reciprocal space 3D mapping. Being a substantial improvement over the conventional RHEED [Citation17,Citation18] the reciprocal space tomography deals with a sequence of diffraction patterns taken during the fine-step azimuthal rotation of the sample. The 3D intensity maps built from a series of Ewald spherical sections can be demonstrated in the easily interpreted form of planar cuts or projections along a specific crystallographic axis. The X-ray diffraction studies were carried out on a four-circle diffractometer at BL3A beamline of Photon Factory synchrotron (Tsukuba, Japan). The large volume 3D reciprocal space maps were obtained with a 2D Pilatus 100 K detector in the same way and using the same processing software as described above for RHEED. The in-plane and cross-section transmission electron microscopy studies were carried out at Jeol JEM-2100F (JEOL, Japan) microscope operated in the conventional bright-field and high-resolution imaging modes. The surface morphology was studied using the NTEGRA (NT_MDT, Russia) atomic force microscope operated in the semi-contact mode. Magnetization loops and temperature dependence curves were measured on a PPMS (Quantum Design, USA) vibrational sample magnetometer (VSM) in the temperature range between 10 K and 300 K. The x-ray absorption spectroscopy (XAS) and x-ray magnetic circular dichroism (XMCD) studies have been carried out at RT and 10 K at ID32 beamline of ESRF synchrotron (Grenoble, France) and BL16 beamline of KEK PF synchrotron (Tsukuba, Japan). The measurements were performed in total electron yield (TEY) mode with the magnetic field applied in-plane and the circular polarized photons incident at 30 deg. The neutron diffraction measurements were carried out at the D10 single crystal four-circle diffractometer (ILL, France) [Citation19]. The incoming neutron beam with a wavelength of λ = 2.36 Å was provided by the vertically focusing pyrolytic graphite monochromator. The analyzer option was used to improve the signal over background ratio.
3. Results and discussion
3.1. Reciprocal lattice evolution at the nucleation stage studied by RHEED
The evolution of the crystal structure at the ε-Fe2O3/GaN interface during the nucleation stage was studied in situ by RHEED 3D mapping (reciprocal space tomography). This technique is highly relevant for the study of lateral periodicity as it gives access to the intensity distribution in the reciprocal space plane both perpendicular (out-of-plane diffraction) and parallel to the surface (in-plane diffraction). shows the step-by-step evolution of the reciprocal space structure observed during the growth of a 10 nm thick ε-Fe2O3 film. Shown are side-view reciprocal space cuts perpendicular to ε-Fe2O3 [100] and plan-view reciprocal space projections along the ε-Fe2O3 [001] surface normal. The growth starts on the atomically smooth GaN (0001) surface, the corresponding reciprocal lattice consisting of a hexagonal array of intensity modulated rods stretching perpendicular to the surface (). Upon Fe2O3 deposition the hexagonal array of GaN rods gets gradually replaced by a similar (though laterally expanded) hexagonal array of the iron oxide rods. Both arrays can be observed simultaneously at the coverage of 0.2 nm (). The 7.5% lateral expansion of the layer pattern corresponds to the in-plane reduction of the anion-to-anion bond lengths from 3.19 Å (N-N) in GaN to 2.91–2.95 Å (O-O) in the 3+ iron oxide [Citation3]. Showing a weak intensity modulation along the rod, the observed pattern corresponds to a flat layer with a 1 × 1 lateral periodicity of about 2.9 Å that only exists in FeO within (111) plane but not in any 3+ iron oxide where the surface cell is considerably larger. E.g. in ε-Fe2O3 (001) the surface cell is 3 × √3 (5.09 Å × 8.78 Å) as shown schematically in . Taking into account the geometrical similarity of the anion planes in GaN and Fe2O3 [Citation3], it is reasonable to assume that ε-Fe2O3 nucleates in register with GaN. However because of the lower surface symmetry and larger unit cell, the iron oxide islands nucleate out of phase with each other. The only long range order these islands have in common is that of the underlying GaN surface. Therefore the only observed reciprocal space nodes are the nodes that lie close to the nodes of GaN (shown with red circles in ).
Figure 1. Evolution of reciprocal space structure upon deposition of ε-Fe2O3 layer on GaN(0001) surface studied by RHEED reciprocal space mapping. Step by step evolution of the in-plane order, showing gradual development of the epsilon ferrite periodicity around the FeO-like rods (a). The in-plane (b) and out-of-plane (c) reciprocal space maps of initial GaN surface (left) and 10 nm thick ε-Fe2O3 film (right). The in-plane lattice matching between ε-Fe2O3 (001) and GaN (0001) is schematically shown (d). Part of Fig. 1 is reproduced by permission from [https://doi.org/10.1103/PhysRevMaterials.2.073403], copyright [2018, APS]
![Figure 1. Evolution of reciprocal space structure upon deposition of ε-Fe2O3 layer on GaN(0001) surface studied by RHEED reciprocal space mapping. Step by step evolution of the in-plane order, showing gradual development of the epsilon ferrite periodicity around the FeO-like rods (a). The in-plane (b) and out-of-plane (c) reciprocal space maps of initial GaN surface (left) and 10 nm thick ε-Fe2O3 film (right). The in-plane lattice matching between ε-Fe2O3 (001) and GaN (0001) is schematically shown (d). Part of Fig. 1 is reproduced by permission from [https://doi.org/10.1103/PhysRevMaterials.2.073403], copyright [2018, APS]](/cms/asset/f65a6aac-77c4-4ae9-8663-be02d895d798/tsta_a_1870870_f0001_oc.jpg)
The described 1 × 1 hexagonal structure persists until the iron oxide coverage reaches about 0.3 nm. At this coverage the long range order typical of ε-Fe2O3 starts to gradually develop as evidenced by the appearance of a circle of 6 neighbor rods around each rod of the fundamental 1 × 1 array ( 0.3 nm). The neighbor rods appear at exactly where they are expected in ε-Fe2O3. As more material is deposited, the defects in the underlying atomic layers get healed and the size of crystallographically coherent domains increases. The brightness of the first circle of neighbor rods grows with coverage. Additional rods appear on the circle of a twice larger radius at a coverage of 0.7 nm (). At the increased coverage the fully developed ε-Fe2O3 diffraction pattern appears in both the side and plan views () in full agreement with the model (shown with circles). On the [100] zone axis side-view reciprocal space maps the development of the long range order looks as appearing of reflection rows at ±1/6 positions around the 1 × 1 rods (marked with red triangles), and then later at ±2/6 and ±1/2 positions. The observed diffraction patterns are spotty rather than streaky corresponding to the surface consisting of islands, which are in phase with the GaN substrate but not obligatory with each other. The ε-Fe2O3 [100] axis lies parallel to the one of three equivalent GaN<1-10> directions.
3.2. Anisotropic disorder in ε-Fe2O3 films studied by XRD reciprocal space mapping
While RHEED is indispensible for the in situ studies of the crystal structure at the film surface, the bulk-averaged data is more reliably obtained by X-ray diffraction. The results of XRD reciprocal space mapping studies carried out for a 80 nm thick ε-Fe2O3 film are presented in . The wide area reciprocal space cut in shows a series of ε-Fe2O3 00(2 n), Al2O3 000(6 n) and GaN 000(2 n) specular reflections along with a row of the off-specular ε-Fe2O3 (0, 1, 2 n + 1) reflections. The intensity profiles drawn along 00 L and 01 L are shown in . Absence of the intensity maximums corresponding to the other iron oxide polymorphs such as γ-Fe2O3 [Citation16] or α-Fe2O3 [Citation3] confirms the crystallographic purity of the grown epsilon ferrite and allows estimation of the lattice parameters as follows: a = 5.09 Å, b = 8.78 Å, c = 9.44 Å.
Figure 2. The reciprocal space structure of 80 nm (a-d) and 5 nm (e-f) ε-Fe2O3 films measured by XRD mapping. Intensity profiles measured along ε-Fe2O3 [00 L] and [01 L] axes (a). The side-view reciprocal space cut with ε-Fe2O3 [100] zone axis (b). The plan-view reciprocal space cuts ([001] zone axis) at L = 2 (c) and L = 3 (d) showing the peculiar star-like shape of ε-Fe2O3 reflections. Reciprocal space cuts in the vicinity of the GaN rods (e, f) show that only reflections with GaN-like in-plane periodicity are present in the thin iron oxide film
![Figure 2. The reciprocal space structure of 80 nm (a-d) and 5 nm (e-f) ε-Fe2O3 films measured by XRD mapping. Intensity profiles measured along ε-Fe2O3 [00 L] and [01 L] axes (a). The side-view reciprocal space cut with ε-Fe2O3 [100] zone axis (b). The plan-view reciprocal space cuts ([001] zone axis) at L = 2 (c) and L = 3 (d) showing the peculiar star-like shape of ε-Fe2O3 reflections. Reciprocal space cuts in the vicinity of the GaN rods (e, f) show that only reflections with GaN-like in-plane periodicity are present in the thin iron oxide film](/cms/asset/3515cc89-1332-4f01-a4b6-9fb5ea97fdb3/tsta_a_1870870_f0002_oc.jpg)
Remarkably the off-specular reflections in thick ε-Fe2O3 films exhibit a peculiar star-like shape as seen on the L = 2 () and L = 3 () reciprocal space cuts carried out parallel to the film surface. The number of streaks in the star-like reflection depends on how many crystallographic domains contribute to it. This follows from the epitaxial relations observed in the orthorhombic-on-hexagonal ε-Fe2O3/GaN system [Citation3]: GaN[1–10] || ε-Fe2O3 [100] or [−1-10] or [−110]. With this three-fold ambiguity there exist three equivalent ε-Fe2O3 crystallographic domains rotated around the c-axis by 120 deg with respect to each other. With b lattice parameter in ε-Fe2O3 being √3 times larger than a, a great deal of reciprocal space nodes coincide upon ±120 deg lattice rotation around the surface normal. The nodes coincident for all three domains produce 3-streak stars while the 2-streak stars appear around the nodes belonging to just two domains. The single domain nodes showing a single streak are the most informative as they allow identification of the elongation direction as ε-Fe2O3 [100], which is by coincidence the easy magnetization axis in ε-Fe2O3.
Thus we conclude that the observed complex diffraction pattern in ε-Fe2O3/GaN films is a combination of three equivalent patterns at 120 deg to each other with reflections in each pattern being elongated uniaxially. Such uniaxial elongation can be often attributed to the break of the long range order in the streak direction, e.g. perpendicular to a twin or an antiphase boundary [Citation18,Citation20] or more generally to the lack of a well-defined periodicity in the particular direction [Citation21]. Interestingly the triple-coincident reflections located close to the GaN rods are laterally narrow, have round shape and show no streaks (see the 002 reflection in and the row of 13 L off-specular reflections in ). The fact that the GaN-like periodicity is not disturbed by the defects is in agreement with the RHEED data showing that the earliest and the best developed long range order in a thin ε-Fe2O3/GaN film is related to the periodicity of the host gallium nitride surface. The early development of the GaN-like order is also evident from the XRD maps () measured in a 2 nm ε-Fe2O3 film. The bright ε-Fe2O3-like reflections are only present in the vicinity of GaN 11–2 L and 10–1 L reciprocal space rods and missing elsewhere. Interestingly, very similar XRD maps were observed at the early stage of the iron oxide films growth at lower temperature of 600°C and oxygen pressure of 0.02 mbar. Though these growth conditions are known [Citation3] to result in development of α-Fe2O3 phase, we conclude that the few nm thick transition layer at the interface in these films has an epsilon-like rather than alpha-like crystal structure. The same reciprocal space structure was also observed in the few nm Fe2O3 film grown at a much lower temperature of 400°C and then annealed to 800°C.
To summarize the previous sections, a specific anisotropic disorder (which is a variable range order dependent on the reciprocal space vector length and direction) was observed in ε-Fe2O3/GaN system by RHEED and XRD reciprocal space tomography techniques. The disorder presumably appears at the early iron oxide growth stage in a wide range of growth conditions and is due to the symmetry break at the nitride-oxide interface. The disorder then propagates into thicker ε-Fe2O3 films as more material is deposited. In the next section this phenomenon will be discussed from the point of view of transmission electron microscopy – the method operating in direct rather than reciprocal space.
3.3. The columnar structure of thick ε-Fe2O3 films studied by TEM
The cross-section TEM image of a 60 nm ε-Fe2O3 film presented in suggests that the film has a columnar structure, consisting of vertical flat topped columns of approximately 15–25 nm in diameter. As mentioned in out earlier studies [Citation4], TEM is able to recognize the few nm thick transition layer at the Fe2O3/GaN interface due to its lower density and inferior crystallographic order as compared to the main iron oxide film. The transition layer looks rich of defects that accommodate the lattice difference between the film and the substrate. The lack of a well-defined crystal structure is in agreement with the early stage RHEED maps showing no features of the orthorhombic ε-Fe2O3 lattice.
Figure 3. Schematic presentation of the columnar film structure (a) in agreement with the AFM image (b). Cross section TEM image (c) showing the main film and the transition layer. Typical in plane TEM (d) and HRTEM (e) images showing the columnar structure of the ε-Fe2O3/GaN film. The insets show a magnified view of the atomic structure within columns and the corresponding Fourier transforms. The stacking faults and twin boundaries seen in some columns are responsible for the reciprocal space node elongation in the [100] direction
![Figure 3. Schematic presentation of the columnar film structure (a) in agreement with the AFM image (b). Cross section TEM image (c) showing the main film and the transition layer. Typical in plane TEM (d) and HRTEM (e) images showing the columnar structure of the ε-Fe2O3/GaN film. The insets show a magnified view of the atomic structure within columns and the corresponding Fourier transforms. The stacking faults and twin boundaries seen in some columns are responsible for the reciprocal space node elongation in the [100] direction](/cms/asset/889f8fe8-b101-4d3b-8e2b-80d093a57148/tsta_a_1870870_f0003_oc.jpg)
The in-plane morphology studies of the thick ε-Fe2O3 films have been performed by AFM and TEM. The AFM image () shows a dense array of mounds of approximately 30 nm in diameter. A better resolved TEM image () reveals that these mounds have hexagonal shape presumably corresponding to the tightly packed flat topped ε-Fe2O3 columns. The high resolution in-plane TEM image presented in shows in more detail the atomic structure within each ε-Fe2O3 column. In agreement with the RHEED and XRD data presented above, the atomic rows are oriented in the three possible directions at 120 deg to each other. The observed unit cell has an approximate size of 5 Å × 8.7 Å which corresponds well to the a-b dimensions of the orthorhombic ε-Fe2O3 unit cell. The Fourier transforms shown alongside the zoomed regions are in agreement with the ε-Fe2O3 reciprocal lattice viewed along the [001] axis. For the different iron oxides such as α-Fe2O3 and γ-Fe2O3 the reciprocal lattice nodes viewed from this direction would form a regular hexagonal lattice. Remarkably, the same hexagonal lattice results if the Fourier transform is applied to the large area TEM image or if the large area electron diffraction pattern is measured ().
The boundaries between the columns contain complex defects appearing upon coalescence of the adjacent nucleation grains. It must be noted that there is a great number of equivalent ways of placing the large surface cell of ε-Fe2O3 (001) over the short period surface of GaN (). Therefore the defects between the columns are more complex than just being the ABCCBA stacking faults. The adjacent columns are practically incoherent to each other. The Fourier transform of the area containing multiple columns looks as a simple superposition of the reciprocal space nodes of each domain. More regular defects like twin boundaries and stacking faults are observed within the same hexagonal column. These can be caused by the growth perturbations. In contrary, the regions on both sides of the antiphase or twin boundary within the same column are highly coherent, which results in the reciprocal space node elongation in the [100] direction. These elongations are apparently of the same nature as the XRD streaks described earlier (). The observed HRTEM images resemble those presented in Ref [Citation22]. where a 200 nm Ga2O3 film was grown by means of MOVPE onto the Al2O3 substrate. Similar to our study the Ga2O3 crystal structure was identified as orthorhombic Pna21 with the c-axis perpendicular to the surface. It was claimed by the authors that only the ABAC stacking in the cation sublattice is subject to twinning while the slightly distorted close packed lattice of oxygen atoms remains unchanged.
3.4. Magnetization reversal in ε-Fe2O3 films of different thickness
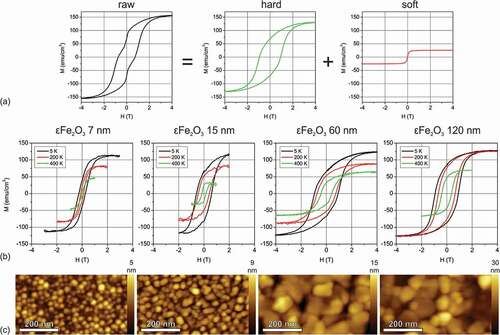
The field and temperature dependence of magnetization in ε-Fe2O3/GaN films have been studied in the present work using the conventional vibrating sample magnetometer (VSM) and in more detail by a synchrotron method of X-ray magnetic circular dichroism (XMCD). shows a typical MH curve observed in a 60 nm thick ε-Fe2O3 film at T = 5 K. As was noticed in the earlier works [Citation2–4,Citation6-11] the magnetization loops in ε-Fe2O3 usually show a characteristic wasp-waist shape with an abrupt magnetization jump at H = 0, corresponding to the coexistence of magnetically hard and soft components. The wasp-waist magnetization loop in can be qualitatively decomposed into the hard and soft magnetic components by subtracting a temperature independent phenomenological arctangent M = 2⋅Msoft/π⋅arctan(H/Hsoft) with the parameters of Msoft = 10–30 emu/cm3 and Hsoft = 65–75 mT chosen to eliminate the magnetization jump at H = 0. The magnetic properties of the ε-Fe2O3 films depend drastically on the film thickness as presented in showing the magnetization curves measured at T = 5 K, 200 K and 400 K in 7–120 nm thick ε-Fe2O3 films. For easier comparison the temperature independent soft magnetic component contribution has been subtracted. The value of the low temperature Ms is mostly the same for different thickness and is slightly above 100 emu/cm3 being a reasonable value for ε-Fe2O3 [Citation7,Citation23,Citation24]. A drastic decrease of saturation magnetization Ms with temperature was observed in all the films. Remarkably the coercive field is shown to increase with the film thickness. A similar size dependence of the coercivity was observed earlier in the ε-Fe2O3 nanoparticles [Citation7] and was attributed to the superparamagnetic behavior of the small particles (size threshold estimated as 7.5 nm). The coercivity increase was observed up to the particle diameter of about 20–30 nm. Unlike the samples with randomly oriented nanoparticles, the ε-Fe2O3/GaN films consist of crystallographically oriented columns as shown by TEM. As seen from the series of AFM images shown in , the column diameter exhibits a synchronous increase with the film thickness which can naturally lead to the increase of coercivity following the same reasons as described for the nanoparticles.
Figure 4. The decomposition of the typical wasp-waist MH loop in ε-Fe2O3 into hard and soft magnetic components (a). Magnetization curves measured in ε-Fe2O3 films of different thickness at 5 K, 200 K and 400 K by VSM (b). The temperature independent soft magnetic component is subtracted for easier comparison. The columnar morphology of the same series of films measured by AFM (c)
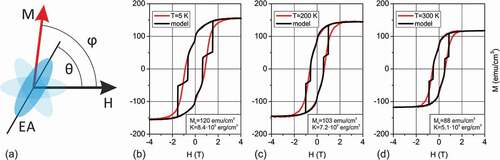
The shape of the in-plane VSM magnetization curves has been described in the present work following the Stoner Wolhfarth (SW) approach [Citation25] of weakly interacting magnetic particles, which is the simplest way to describe magnetization reversal in the systems consisting of nanoscale objects that are small enough to contain single magnetic domains [Citation26,Citation27]. The columns in ε-Fe2O3 film can be considered as such weakly interacting objects as they are crystallographically non-coherent to the neighbors, have differently oriented easy magnetization axes at 120 deg to each other and are small enough to be single domain. To fit the experimentally observed in-plane magnetization curves, the SW model was applied to model the hard magnetic component while the soft magnetic component (giving the characteristic wasp-waist look to the MH loop) was phenomenologically modeled as a temperature independent M0⋅tanh(H/H0) with M0 = 10 emu/cm3 and H0 = 0.07 T. The results of modeling are shown in for a 80 nm thick ε-Fe2O3 film. A reasonably good fitting was obtained for the MH loop regions in which magnetization decreases from saturation (H = +4 T) to zero (H = -Hc). This branch of the loop corresponds to the reversible rotation of M vectors in all three 120 deg domains. At the point where magnetization gets close to zero, the SW model predicts sudden flips of the M vector resulting in abrupt magnetization jumps. The much smoother magnetization reversal observed in the experiment may be due to the collective magnetic behavior of the columns, pinning to the defects or to the size distribution that results in widening of the magnetization flip region. It must be noted that the non-rectangular shape of the magnetization loop with a decreased Hc follows from the fact that the three domains are magnetized at the same time. Only one easy axis is aligned parallel to the field while the other two are oriented at 120 deg to the each other and the field. From this point of view, fabricating a film with the true single axis anisotropy is a challenge that might lead to a better understanding of the magnetization dynamics in this material.
Figure 5. Tentative modeling of the in-plane M(H) curves in a columnar ε-Fe2O3 film carried out using the Stoner-Walfharth model. Schematic representation explaining the mutual orientation of the magnetic field and the easy axis (a). Magnetization curves measured at 5 K (b), 200 K (c) and 300 K (d) for a 80 nm ε-Fe2O3 film and the corresponding modeling
3.5. Magnetic softening in in ε-Fe2O3 at 100-150 K
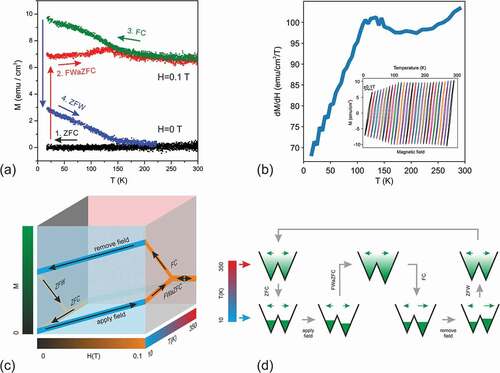
More information on the properties of the nano-scale magnetic materials can be extracted from the temperature behavior of the magnetization measured along the field-cooling-zero-field-cooling (FC-ZFC) scenario [Citation28–30] consisting of consecutive warming/cooling of the initially demagnetized sample in a small magnetic field. In the present work the classic FC-ZFC scenario has been expanded to a full MT cycle consisting of two constant-field temperature dependences intermediated with the two constant temperature field dependencies (see schematic representation in ). The result of such measurements performed in a 120 nm ε-Fe2O3/GaN film are shown in . The initially demagnetized sample (equal number of magnetic moments along both directions of the easy axis) was first zero field cooled (ZFC) to T = 10 K. A small field of 0.1 T was then applied to reversibly magnetize the sample. At this point the number of parallel/antiparallel magnetic moments is still the same, the non-zero net magnetic moment achieved through reversible rotation. During the subsequent field-warming-after-ZFC (FWaZFC) branch the sample temperature was brought to 300 K. The observed gradual increase of magnetization along this branch is usually explained by the onset of the non-reversible magnetization switching assisted with the thermal motion of magnetic moments (and magnetic softening of ε-Fe2O3 as will be shown later). On the subsequent field cooling (FC) branch (cooling to T = 10 K) the magnetization followed the same path down to about T = 150 K at which point the FWaZFC and FC curves split drastically apart visualizing the accumulation of the net magnetic moment being most intensive between 50 K and 150 K. The amount of magnetization accumulated during the FWaZFC-FC cycling can be estimated once the field at 10 K is switched off and the magnetization returns to M = 4.5 emu/cm3 instead of zero. To complete the field-temperature cycle, the sample was zero-field-warmed (ZFW) up to T = 300 K and then zero-field-cooled (ZFC) back to T = 10 K. The ZFW-ZFC branches run below and almost parallel to the FWaZFC-FC branches described above () returning the magnetization back to zero. It may be concluded that the magnetization in ε-Fe2O3 being brought out of equilibrium by applying field to a non-magnetized sample (or removing field from a magnetized sample) may be effectively brought to the equilibrium by cycling temperature between 10 K and 150 K (similar to a more traditional field cycling).
Figure 6. Temperature dependence of magnetization in a 80 nm ε-Fe2O3 film measured along the ZFC-FWaZFC-FC-ZFW cycle (a). The field-temperature cycle is shown schematically in panel (c). The redistribution of magnetic moments parallel and antiparallel to the field that occur during cycling is shown in panel (d). The small-field dM/dH derivative temperature dependence shows mild magnetic softening in ε-Fe2O3 in the range of 100–150 K (b). Inset in panel (d) shows MH loops used to calculate the dM/dH derivative. The loops measured in a ± 0.1 T field range are displayed shifted horizontally for better visibility
In works dealing with magnetic nanoparticles, the M(T) curve splitting is often ascribed to the superparamagnetism [Citation7,Citation28–30]. The superparamagnetic limit for the randomly oriented ε-Fe2O3 nanoparticles was estimated as 7.5 nm in Ref [Citation7]. This is considerably smaller than the column size in the studied ε-Fe2O3/GaN films. With magnetocrystalline anisotropy in ε-Fe2O3 of K = 5–8⋅ 105 erg/cm3 (estimated in the previous section) and the column volume of V = 2⋅104 nm3 (from AFM, TEM studies), the blocking temperature would be above TB = K⋅V/25 kB = 2900 K, far above the splitting temperature of 150 K observed in M(T) experiment. This rules out the simple superparamagnetic explanation of the observed M(T) curve behavior. To make possible the FWaZFC-FC curve splitting through temperature assisted magnetization switching at 150 K, the magnetocrystalline anisotropy should drop by about one order of magnitude in the vicinity of the splitting temperature. Such a drop was indeed reported to occur in ε-Fe2O3 nanoparticles [Citation1,Citation5,Citation31] where a large decrease in the coercivity (from 2.25 to 0.08 T) was observed between 100 and 200 K. Surprisingly the same effect has been never explicitly observed in the epsilon ferrite epitaxial films [Citation3,Citation4] including those grown on GaN [Citation3,Citation16].
In the present work we have succeeded in detecting the similar magnetic softening in ε-Fe2O3 films by using an alternative way to probe the temperature dependence of the magnetic susceptibility. The small field dM/dH derivative has been measured in a demagnetized ε-Fe2O3 sample by measuring a sequence of small-span M(H) loops during the warming 10–300 K and cooling 300–10 K branches (see inset in where the loops are shown with a horizontal offset for better visibility). The field span of 0.1 T was chosen sufficiently small to make the loops fully reversible (magnetization rotation with no switching). The temperature dependence of the loop amplitude plotted in reflects the behavior of the magnetic susceptibility. A noticeable peak in dM/dH at around 110 K fits well to the idea of magnetic softening of ε-Fe2O3 at around this temperature. The coercivity quenching in the ε-Fe2O3 epitaxial films might be not as temperature-sharp as in the nanoparticles due to a wider size distribution of the columns inside the films. During the temperature ramp, the ‘magnetic softening’ (and the corresponding speed up of the thermo activated switching) proceeds column-by-column being spread across a wider temperature range. The M(T) curves presented in were acquired at the temperature ramp rate of about 6 K/min. For the few times lower ramp rates the branches above 150 K tended to separate. This looks reasonable as the switching rate is higher when the temperature is ramped slower. The suggested derivative method allows distinguishing the temperature behavior of susceptibility (reversible) from the temperature activated switching (irreversible). Indeed there is a drastic difference between the FWaZFC-FC pair and the ZFW-ZFC pair. The first one is taken at H = 0.1 T and reflects both temperature changes in dM/dH (see the bump at 110 K) and the switching rate. The latter is taken at zero field and shows no bump at 110 K reflecting just the switching rate.
3.6. Neutron diffraction
The neutron diffraction measurements were carried out in ε-Fe2O3/GaN film to investigate peculiarities of magnetic structure in epsilon ferrite. Several specular and off-specular ε-Fe2O3 reflections could be measured despite the quite low diffraction intensity observed in a 120 nm thick film with an area of 10 × 10 mm2. shows the comparison between our results and those observed earlier [Citation5] by neutron powder diffraction in ε-Fe2O3 nanoparticles with the average size of 19 nm. Despite the same symmetries (space group #230 Pna21) and lattice constant values, the intensities of the peaks differ significantly, presumably, due to the difference in the oxygen atomic positions in the unit cell. The statistics and the number of the measured peaks did not allow a refinement of the crystal and magnetic structures. Despite the low signal over background ratio it was possible to track down the temperature-dependence of the most intense ε-Fe2O3 (002) peak (). The (002) peak area determined from the Gaussian fit of the (00 l) scans shows non-monotonous temperature dependence with a maximum at T ≈ 150 K (), being in correlation with the magnetization trends measured in similar films by VSM. The neutron diffraction experiment thus directly shows that the M(T) trend is intrinsically related to the magnetic structure of ε-Fe2O3 and not to the other iron oxide polymorphs or impurities that might be present in the film. In contrast to the εFe2O3 nanoparticles [Citation5], no signature of the incommensurate magnetic satellites is observed in the film. The intensity change of the (002) peak with temperature can be ascribed to the re-orientation of the magnetic moment from the (ab)-plane towards the c-axis, or an antiferromagnetic canting of the spins in the (ab)-plane. Assuming the strong shape anisotropy in the epsilon ferrite film, the second scenario is more plausible. A more detailed investigation is required to draw a conclusion. Such study will be possible with thicker ε-Fe2O3 films allowing the measurement of the less intense peaks.
Figure 7. Neutron diffraction reflection intensities observed in a 120 nm ε-Fe2O3/GaN film compared to the neutron powder diffraction experiment on ε-Fe2O3 nanoparticles [Citation5] (a). The (002) diffraction peak measured in ε-Fe2O3 film at 300 K, 150 K and 20 K. Solid lines correspond to Gaussian fits. (b) The temperature dependence of the (002) peak area extracted from the fit (c)
![Figure 7. Neutron diffraction reflection intensities observed in a 120 nm ε-Fe2O3/GaN film compared to the neutron powder diffraction experiment on ε-Fe2O3 nanoparticles [Citation5] (a). The (002) diffraction peak measured in ε-Fe2O3 film at 300 K, 150 K and 20 K. Solid lines correspond to Gaussian fits. (b) The temperature dependence of the (002) peak area extracted from the fit (c)](/cms/asset/903a7d7e-1452-4dcf-aaa5-fd9497c60adb/tsta_a_1870870_f0007_oc.jpg)
3.7. X-ray absorption and magnetic circular dichroism studies
X-ray absorption spectroscopy (XAS) and X-ray magnetic circular dichroism (XMCD) have been applied in this work to study chemical environment and magnetic state of the iron atoms in Fe2O3/GaN films of different thickness. A typical Fe L23 absorption spectrum of ε-Fe2O3 shown in (and in more detail in is shaped very similar to that of γ-Fe2O3 [Citation3] as Fe3+ ions in both polymorphs reside in octahedral and tetrahedral coordination. For iron in pure octahedral coordination (like in thick α-Fe2O3/GaN [Citation3]) the absorption looks quite different [Citation31–33] showing a deep intensity depression at 708.5 eV (). Interestingly this depression is missing in the few nm transition layer preceding the nucleation of α-Fe2O on GaN [Citation3], the corresponding Fe L3 edge shape being more ε-Fe2O3–like rather than α-Fe2O3–like (). A similar trend is observed in the XAS spectra measured at the K-edge of oxygen (). The absorption observed in a thin pre-α-Fe2O3 film looks very similar to ε-Fe2O3 (a broad peak at 533 eV) and different from the typical absorption of bulk-like α-Fe2O3 (two split peaks at 532.7 eV and 534.1 eV) [Citation34,Citation35]. The XAS data is in good agreement with the XRD results presented above, confirming that the iron oxide transition layer tends to nucleate in epsilon-like orthorhombic structure even when the growth conditions are not optimized for it.
Figure 8. XAS and XMCD spectra of thick ε-Fe2O3 film measured at Fe L23 edge (a). XAS spectra at Fe L23 (c) and O K (e) edges in ε-Fe2O3 compared to those measured in thin and thick α-Fe2O3 layers. XMCD shape evolution during magnetization reversal along forward (b) and backward (f) field span. Comparison of magnetization curve shapes measured by XMCD at various energies and by VSM (d). The VSM curve is shown as measured (red) and with magnetically soft component subtracted (gray). The loops are normalized vertically for easier shape comparison
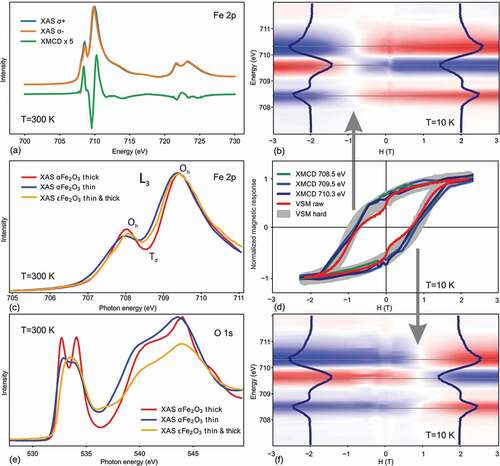
The X-ray magnetic circular dichroism at L23 edge of the transition elements measured in TEY mode is known to provide valuable information about the near-surface nanoscale magnetism [Citation31,Citation36,Citation37]. A typical XMCD spectrum of ε-Fe2O3/GaN film measured in saturation (H = 3 T) is presented in . The dichroic signal is relatively weak due to a rather small magnetic moment of about 100 emu/cm3 in ε-Fe2O3. Like in the other iron oxides, the XMCD spectrum features three peaks [Citation31,Citation32] of which the two negative peaks correspond to the Fe in Oh coordination (M parallel to H) and the positive peak corresponds to the Fe in Td coordination (M antiparallel to H) [Citation38–43]. To track the magnetic response of individual iron sublattices we have measured XMCD spectra across the iron L3 edge spanning the magnetic field back and forth between −4 T and +4 T. The measurements were performed at T = 10 K to maximize magnetic response of epsilon ferrite. The typical field-energy maps obtained in a 60 nm ε-Fe2O3 film are shown in . Because of the magnetic hysteresis, the forward scan map in exhibits an about 2 T offset with respect to the backward scan map in . The constant energy cross-sections through the maps provide energy dependent magnetization curves. Most informative are the cross-sections through the peaks located at E = 708.5 eV, 709.5 eV and 710.3 eV. Representing contributions from differently oriented magnetic moments residing at one Td and three Oh sublattices, the corresponding XMCD-vs-field loops show different amplitudes and signs. To facilitate shape comparison, the loops shown in have been normalized to same intensity span. Within experimental accuracy, the shown XMCD loops do not show the characteristic kink at H = 0 that is always present in VSM data. With the kink in the form of a phenomenological arctangent being subtracted from the VSM curve, all the loops become of almost identical shape when normalized vertically (). The absence of the kink in the surface sensitive XMCD makes us conclude that the magnetically soft component responsible for the kink is located deep below the surface at Fe2O3/GaN interface [Citation4] where it can be only sensed by the bulk averaging VSM method. Upon careful analysis we conclude that the shapes of the normalized XMCD field curves measured at different energies are very similar to each other. This confirms that as the external magnetic field is changed, the four Fe sublattices in ε-Fe2O3 behave synchronously although with different strength and sign. This is at least true in the near surface region of the film probed by TEY. To investigate deeper regions (e.g. the most interesting region at the ε-Fe2O3/GaN interface), a more depth sensitive technique such as X-ray magnetic resonance reflectometry is supposed to be helpful [Citation44].
4. Conclusions
To summarize, we present a detailed investigation into the growth, crystal structure and magnetic properties of the multiferroic-on-semiconductor epitaxial films of ε-Fe2O3/GaN. The reciprocal space mapping techniques utilizing diffraction of electrons and X-rays were used in this paper to reveal a peculiar anisotropic disorder developed during the nucleation of the orthorhombic ε-Fe2O3 on the hexagonal GaN. The observed anisotropic disorder is characterized by variable range order dependent on the reciprocal space vector length and direction. The fingerprint of the anisotropic disorder is present in the reciprocal space maps in the form of the star-like reflection widening with the number of star streaks dependent on the reflection multiplicity. This effect is observed in a wide range of growth conditions and is due to the symmetry break at the nitride-oxide interface. The lattice order and periodicity inherited from the underlying GaN surface is found to be unaffected as the independently nucleated iron oxide islands grow in phase with the substrate. The propagation of the anisotropic disorder into the growing ε-Fe2O3 film results in the development of a columnar structure clearly visible in TEM and AFM images. The internal crystal structure obtained from the high resolution in-plane TEM images is in agreement with the existence of the three equivalent epitaxial relations in the ε-Fe2O3/GaN system. The FFT analysis confirms that the star-like reflection shape is related to the twin and antiphase boundaries existent inside the ε-Fe2O3 columns.
The field and temperature dependence of magnetization in ε-Fe2O3/GaN films have been studied in the present work by using vibrating sample magnetometer and in more detail by X-ray magnetic circular dichroism. The shape of magnetization loops is modeled using the Stoner-Wohlfarth approach of weakly interacting magnetic columns. By performing conventional M(H), full cycle M(T) and small field derivative dM/dH(T) measurements it has been demonstrated that the coercivity in ε-Fe2O3/GaN films depends drastically on the film thickness. A mild magnetic softening has been revealed to occur between 100 and 150 K similar to the one reported previously solely for epsilon ferrite nanoparticles. For the first time neutron diffraction was measured in epitaxial ε-Fe2O3 film revealing a drastic difference with previous neutron diffraction studies performed in nanoparticles and showing the presence of a distinct intensity change at 150 K. The iron coordination sensitive X-ray absorption techniques in conjunction with electron and X-ray diffraction have been used to demonstrate that the transition layer between GaN and Fe2O3 tends to have orthorhombic epsilon-like structure in a wide range of growth conditions even not optimized for ε-Fe2O3 growth. The magnetic circular dichroism measurements show that the four iron sublattices in ε-Fe2O3 response synchronously to magnetic field although with different strength and sign, at least in the surface area probed by TEY. The obtained results are supposed to shed more light onto the growth mechanisms driving the nucleation and formation of the epsilon ferrite films on GaN filling the gap between the studies of nanoparticles and epitaxial films of this exotic iron oxide polymorph.
Acknowledgments
S. M. Suturin and N.S. Sokolov acknowledge support from Nagoya University for conducting synchrotron x-ray diffraction experiments performed at KEK Photon Factory as a part of the Proposal No. 2018G688. The part of the study related to epitaxial growth, VSM, AFM, XAS studies was supported by Russian Foundation for Basic Research Grant No. 18-02-00789. TEM studies have been performed on the equipment of “Material science and characterization in advanced technology” Federal Joint Research Center supported by the Ministry of Education and Science of the Russian Federation (id RFMEFI62119X0021). The XAS and XMCD studies were performed along proposal HC-3323 on ID32 beamline at the European Synchrotron Radiation Facility (ESRF), Grenoble, France. We are grateful to Nicholas Brookes and Kurt Kummer for providing assistance in using beamline ID32. Additional X-ray absorption studies were carried out at KEK Photon Factory along proposal 2014G725. The authors wish to acknowledge the beamline staff at BL3A and BL16A beamlines at PF KEK for valuable cooperation and V. V. Lundin for providing GaN/Al2O3 wafers. The authors wish to acknowledge Bachir Ouladdiaf and Ketty Beauvois (Institut Laue-Langevin, 71 avenue des Martyrs, CS 20156, 38042 Grenoble Cedex 9, France) for valuable help during preparation and conduction of experiment at D10 carried out along proposal 5-41-990 [19]. The authors thank J. S. White for fruitful discussions. The part of the study related to neutron diffraction was supported by Sinergia CRSII5-171003 Nano Skyrmionics.
Disclosure statement
The authors declare no conflict of interest.
Additional information
Funding
References
- Gich M, Roig A, Frontera C, et al. Large coercivity and low-temperature magnetic reorientation in ε‐Fe2O3 nanoparticles. J Appl Phys. 2005;98(4):044307.
- Gich M, Gazquez J, Roig A, et al. Epitaxial stabilization of ε-Fe2O3 (00l) thin films on SrTiO3 (111). Appl Phys Lett. 2010;96(11):112508.
- Suturin SM, Korovin AM, Gastev SV, et al. Tunable polymorphism of epitaxial iron oxides in the four-in-one ferroic-on-GaN system with magnetically ordered α-, γ-, ɛ− Fe2O3 and Fe3O4 layers. Phys Rev Mater. 2018;2:073403.
- Ukleev V, Suturin S, Nakajima T, et al. Unveiling structural, chemical and magnetic interfacial peculiarities in ε-Fe2O3/GaN (0001) epitaxial films. Sci Rep. 2018;8(1):8741.
- Gich M, Frontera C, Roig A, et al. High- and low-temperature crystal and magnetic structures of ε-Fe 2 O 3 and their correlation to its magnetic properties. Chem Mater. 2006;18:3889–3897.
- Gich M, Fina I, Morelli A, et al. Multiferroic iron oxide thin films at room temperature. Adv Mater. 2014;26(27):4645–4652.
- Ohkoshi S-I, Namai A, Imoto K, et al. Nanometer-size hard magnetic ferrite exhibiting high optical-transparency and nonlinear optical-magnetoelectric effect. Sci Rep. 2015;5(1):14414.
- López-Sánchez J, Serrano A, Del Campo A, et al. Sol–gel synthesis and micro-raman characterization of ε-Fe2O3 micro- and nanoparticles. Chem Mater. 2016;28:511–518.
- Namai A, Yoshikiyo M, Yamada K, et al. Hard magnetic ferrite with a gigantic coercivity and high frequency millimetre wave rotation. Nat Commun. 2012;3(1):1035.
- Thai TMN, Nguyen DT, Lee N-S, et al. Stabilization of metastable ɛ-Fe2O3 thin films using a GaFeO 3 buffer. J Appl Phys. 2016;120:185304.
- Corbellini L, Lacroix C, Harnagea C, et al. Epitaxially stabilized thin films of ε-Fe2O3 (001) grown on YSZ (100). Sci Rep. 2017;7(1):3712.
- Scott JF. Multiferroic memories. Nat Mater. 2007;6(4):256–257.
- Gajek M, Bibes M, Fusil S, et al. Tunnel junctions with multiferroic barriers. Nat Mater. 2007;6(4):296–302.
- Ortega N, Kumar A, Scott JF, et al. Multifunctional magnetoelectric materials for device applications. J Phys Condens Matter. 2015;27(50):504002.
- Hu J-M, Duan C-G, Nan C-W, et al. Understanding and designing magnetoelectric heterostructures guided by computation: progresses, remaining questions, and perspectives. NPJ Comput Mater. 2017;3:18.
- Ukleev V, Volkov M, Korovin A, et al. Stabilization of e-Fe2O3 epitaxial layer on MgO(111)/GaN via an intermediate γ-phase. Phys Rev Mater. 2019;3:094401.
- Suturin SM, Korovin AM, Fedorov VV, et al. An advanced three-dimensional RHEED mapping approach to the diffraction study of Co/MnF2/CaF2/Si(001) epitaxial heterostructures. J Appl Crystallogr. 2016;49:1532–1543.
- Suturin SM, Fedorov VV, Korovin AM, et al. A look inside epitaxial cobalt-on-fluorite nanoparticles with three-dimensional reciprocal space mapping using GIXD, RHEED and GISAXS. J Appl Crystallogr. 2013;46(4):874–881.
- Ukleev V, Beauvois K, Ouladdiaf B, et al. Magnetic structure of epsilon-Fe2O3 films. Inst Laue-Langevin. 2019. DOI:https://doi.org/10.5291/ILL-DATA.5-41-990.
- Suturin SM, Fedorov VV, Korovin AM, et al. Epitaxial Ni nanoparticles on CaF 2 (001), (110) and (111) surfaces studied by three-dimensional RHEED, GIXD and GISAXS reciprocal-space mapping techniques. J Appl Crystallogr. 2017;50:830–839.
- Suturin SM, Sokolov NS, Roy J, et al. STM and LEED studies of CaF2 submonolayer coverage on Si(001). Surf Sci. 2011;605(1–2):153–157.
- Cora I, Mezzadri F, Boschi F, et al. The real structure of ε-Ga2O3 and its relation to κ-phase. CrystEngComm. 2017;19(11):1509–1516.
- Lopez-Sanchez J, Muñoz-Noval A, Muñoz-Noval A, et al. Growth, structure and magnetism of ε-Fe2O3 in nanoparticle form. RSC Adv. 2016;6(52):46380–46387.
- Dmitriev AI, Koplak OV, Namai A, et al. Spin-reorientation transition in ɛ-In0.24Fe1.76O3 nanowires. Phys Solid State. 2014;56(9):1795–1798.
- Stoner EC, Wohlfarth EP. A mechanism of magnetic hysteresis in heterogeneous alloys. IEEE Trans Magn. 1991;27(4):3475–3518.
- Jamet M, Wernsdorfer W, Thirion C, et al. Magnetic anisotropy of a single cobalt nanocluster. Phys Rev Lett. 2001;86(20):4676–4679.
- Cuñado JLF, Bollero A, Pérez-Castañeda T, et al. Emergence of the Stoner-Wohlfarth astroid in thin films at dynamic regime. Sci Rep. 2017;7(1):13474.
- Venugopal R, Sundaravel B, Cheung WY, et al. Magnetic properties of nanoclusters formed by implantation of Fe into Ge using a metal-vapor vacuum arc ion source. Phys Rev B. 2001;98(1):014418.
- Hyeon T, Chung Y, Park J, et al. Synthesis of highly crystalline and monodisperse cobalt ferrite nanocrystals. J Phys Chem B. 2002;96(27):6831–6833.
- Li X-H, Xu C-L, Han X-H, et al. Synthesis and magnetic properties of nearly monodisperse CoFe2O4 nanoparticles through a simple hydrothermal condition. Nanoscale Res Lett. 2010;5(6):1039–1044.
- Tseng Y-C, Souza-Neto NM, Haskel D, et al. Nonzero orbital moment in high coercivity eFe2O3 and low-temperature collapse of the magnetocrystalli. Phys Rev B. 2009;79:094404.
- Kim DH, Lee HJ, Kim G, et al. Interface electronic structures of BaTiO3@X nanoparticles (X=g-Fe2O3,Fe3O4, a-Fe2O3, and Fe) investigated by XAS and XMCD. Phys Rev B. 2009;79:033402.
- Kuepper K, Balasz I, Hesse H, et al. Electronic and magnetic properties of highly ordered Sr2FeMoO6. Phys Status Solidi. 2004;201(15):3252–3256.
- Ozkendir OM. Electronic and crystal structure analysis of the FeCrO3 oxide. J Electron Spectros Relat Phenomena. 2013;191:54–59.
- Lebrun R, Ross A, Gomonay O, et al. Anisotropies and magnetic phase transitions in insulating antiferromagnets determined by a Spin-Hall magnetoresistance probe. Commun Phys. 2019;2(1):1–7.
- Suturin SM, Fedorov VV, Banshchikov AG, et al. Proximity effects and exchange bias in Co/MnF 2 (111) heterostructures studied by x-ray magnetic circular dichroism. J Phys Condens Matter. 2013;25:046002.
- Kaveev AK, Sokolov NS, Suturin SM, et al. Crystalline structure and magnetic properties of structurally ordered cobalt–iron alloys grown on Bi-containing topological insulators and systems with giant Rashba splitting. CrystEngComm. 2018;20(24):3419–3427.
- Regan TJ, Ohldag H, Stamm C, et al. Chemical effects at metal/oxide interfaces studied by x-ray-absorption spectroscopy. Phys Rev B. 2001;64(21):214422.
- Chen J, Huang DJ, Tanaka A, et al. Magnetic circular dichroism in Fe 2p resonant photoemission of magnetite. Phys Rev B. 2004;69:085107.
- Peak D, Regier T. Direct observation of tetrahedrally coordinated Fe(III) in ferrihydrite. Environ Sci Technol. 2012;46(6):3163–3168.
- Liu WQ, Xu YB, Wong PKJ, et al. Spin and orbital moments of nanoscale Fe 3 O 4 epitaxial thin film on MgO/GaAs(100). Appl Phys Lett. 2014;104:142407.
- Huang DJ, Chang CF, Jeng H-T, et al. Spin and orbital magnetic moments of Fe3O4. Phys Rev Lett. 2004;93(7):077204.
- Signorini L, Pasquini L, Boscherini F, et al. Local magnetism in granular iron/iron oxide nanostructures by phase- and site-selective x-ray magnetic circular dichroism. Phys Rev B. 2006;74(1):014426.
- Valvidares SM, Huijben M, Yu P, et al. Native SrTiO3 (001) surface layer from resonant Ti L 2,3 reflectance spectroscopy. Phys Rev B - Condens Matter Mater Phys. 2010;82:1–12.