
ABSTRACT
The 2015 Paris Agreement represents a historic deal in the form of a strong international response to address climate change. This outcome came as a surprise for some, as several controversial issues had been postponed from previous conferences, and were expected to complicate the talks in Paris. One related to the Warsaw International Mechanism on Loss and Damage (L&D), and potential legal remedies for L&D in the form of compensation payments. This issue had been particularly contentious with some developing countries advocating ideas for climate damage liability, which developed countries were unwilling to include in an agreement. Although the negotiations on L&D secured many positive outcomes, Decision 1/CP.21 adopting the Paris Agreement notes that there is no possibility of claiming liability and financial compensation for developing countries. This article, however, argues that, rather than triggering endless compensation claims disputes, a liability mechanism could actually serve as a commitment and reciprocity device, ultimately increasing global policy ambition. In this regard, this article reports the results of two experiments testing the effects of liability rules on the climate policy investment decisions of two players that differ in wealth and vulnerability. Results show that liability rules imposing a responsibility for precaution on both parties increase cooperation significantly, consequentially minimizing risk of L&D occurrence in the first place. Liability rules could thus not only help to address future losses, but also to drive global mitigation and adaptation ambition.
POLICY RELEVANCE
The research results presented in this paper suggest that policymakers would be well advised to further intensify negotiations on a climate-related compensation mechanism beyond that already committed to in the Paris Agreement. Our findings show that a compensation mechanism that implements a rather simple negligence rule makes climate cooperation more attractive and rewarding, potentially leading rich and poor nations to boost their investments in mitigation and adaptation for climate protection. Thus, far from opening up a Pandora’s box of endless compensation claims towards industrialized countries, a liability mechanism could make global climate cooperation more effective, and in the longer run also less costly.
1. Introduction
Striking a climate treaty that commits countries to cutting emissions is very difficult. Nevertheless, the Paris Agreement adopted in December 2015 represents welcome progress in the struggle to achieve the necessary emission reductions aiming to keep global temperature increase ‘well below 2° Celsius’.Footnote1 While the Paris Agreement provides real advancements, given the long-lasting deadlock on the issue and current emission trajectories (Rogelj et al., Citation2016), substantial losses and irreversible impacts from climate change over the coming century will be inevitable (IPCC, Citation2007, Citation2012).
Although global damage projections vary widely (e.g. Nordhaus & Boyer, Citation2000; Tol, Citation2005), all estimates agree that such impacts will disproportionately fall on low-income countries, which could face average damages equalling a quarter of their gross domestic product (GDP) (Tol, Citation2009). In order to deal with these outsized damages, developing countries have successfully anchored Loss and Damage (L&D) in the United Nations Framework Convention on Climate Change (UNFCCC) agenda with the establishment of the Warsaw International Mechanism (Huq, Roberts, & Fenton, Citation2013; UNFCCC, Citation2013). The mechanism intends ‘to address loss and damage associated with impacts of climate change, including extreme events and slow onset events, in developing countries that are particularly vulnerable to the adverse effects of climate change’ (UNFCCC, Citation2013, p. 6). Proponents usually emphasize the aim of restoring climate justice based on historical responsibility (Botzen, Gowdy, & van den Bergh, Citation2008; Bouwer & Aerts, Citation2006; Tol & Verheyen, Citation2004). Countries responsible for most historical emissions, having been at the same time their major economic beneficiaries, should compensate likely victim countries that contributed little to the problem (Hayward, Citation2012).
In the run-up to the 2015 Paris Conference, the main contention around L&D focused on liability and actual financial compensation for climate damages. Vulnerable developing countries pushed strongly to recognize some form of compensation, while developed countries generally refused any notion of legal responsibility as this would require mandatory payments to compensate losses suffered by vulnerable countries. The final outcome of the negotiations includes a full article devoted to L&D (Article 8) recognizing a permanent role for the Warsaw International Mechanism also beyond 2016. Yet, the Article provides no basis for any legal liability, as established in paragraph 51 of the accompanying decision 1/CP.21. Although its stated purpose therefore presently excludes any notion of financial compensation, this article argues that, if carefully designed, liability for climate change-related L&D could induce more ambitious mitigation commitments by all nations and encourage adaptation activities by developing countries. This would yield mutual benefits while reducing the likelihood of damages – and thus compensation claims – arising.
Liability law has been shown not only to serve for settling damages (e.g. after a traffic accident), but also to effectively deter potentially damage-prone behaviour (e.g. reckless driving), by changing expected material payoffs of behavioural alternatives (e.g. Angelova, Armantier, Attanasi, & Hiriart, Citation2014; Galbiati & Vertova, Citation2014; Schwartz, Citation1994). This means that if countries expect to be held liable for damages from climate change, they have an incentive to decrease emissions to reduce the likelihood of damage. This incentive could be strengthened by including a ‘negligence’ rule that limits liability to cases where perpetrators have not taken due care to prevent damages (Posner, Citation1972). If countries can eliminate liability risk by preventive mitigation (for which statutory minimum levels would have to be defined), their incentive to mitigate is even greater. Applying this principle as ‘contributory negligence’ to likely victim countries would also incentivize their ambitions, by entitling them to compensation only if they also have taken precautions to prevent damages (e.g. statutory minimum adaptation).
To test those arguments, we use a series of prisoner dilemma games where two players simultaneously decide in a one-shot interaction whether to invest in climate policy or not, and where we vary the level of liability. In our set-up, players differ in their initial endowments. Only the poor player is vulnerable to a catastrophic climate event that potentially occurs after investment decisions have been made, destroying a fraction of her endowment. Investing reduces this catastrophe probability. The rich player’s investment option is larger and has a greater reduction effect.Footnote2 Probabilities, endowments, and investment options are known to both. Investment in climate policy is thus costly, while at the same time it reduces the probability of the negative impacts of climate change. Mutual investment is collectively most efficient, as it maximizes social welfare, yet mutual defection is the pure Nash equilibrium. A typical social dilemma situation arises where individual players have an incentive to hitch a free-ride and abstain from investment, with cooperation predicted to fail. We introduce liability in the form of compensation obligations in the case of losses from climate change. The liability rules are analogous to common tort liabilities including (1) strict liability, i.e. the rich player always has to compensate the poor in cases where s/he suffers damages; (2) negligence, i.e. the rich player has to compensate the poor only if s/he (the rich) has not taken due care (that is, not invested in climate policy); and (3) contributory negligence, i.e. the poor player is only awarded compensation if s/he has invested in climate policy.
We acknowledge that our design abstracts from several aspects of a liability mechanism, the most important being how the rule is established in the first place. We further do not take into account the issue of how causal responsibility for damages is attributed to countries, and how the amount of compensation relates to damages suffered.Footnote3 Although these are important questions that need to be addressed, we focus here mainly on the effects of established liability rules on cooperation, as the behavioural implications of different liability rules themselves are still unknown at present.Footnote4
In this article we (i) provide empirical evidence for how liability rules per se affect cooperative behaviour (study 1) and (ii) check the robustness of our primary findings with participants from diverse countries reflecting modelled wealth and vulnerability differences (study 2). For this purpose, we ran two identical experiments with distinct samples to compare results between these two settings.Footnote5
The remainder of the article is structured as follows: Section 2 describes the experimental design. Section 3 presents and discusses the experimental results. Section 4 concludes.
2. Experiment
2.1. Basic game and treatment description
We chose a two-person social dilemma gameFootnote6 as the basic decision model in which participants in the experiment are randomly matched into pairs and equipped with either a high (280 points; rich player) or a low (200 points; poor player) starting capital. They can then decide to invest or not in order to reduce the probability (set at 75%) that the poor player will lose most of his initial endowment (180 points) mirroring potential economic losses from a climate disaster. The level of investment is pre-determined and amount to 100 points for the rich player and 20 points for the poor player. In fact, if only the rich player invests, the probability of a loss reduces to 25%; if only the poor player invests, the probability reduces to just 65%; if both decide to invest, the probability reduces to 5%. Expected payoffs are stated in points with an exchange rate of 2 points for US$ 0.10 and are chosen such that each player prefers to not invest, i.e. free-ride (pure Nash equilibrium), yet the social optimum, defined as the sum of expected payoffs of players, is realized if both invest, i.e. cooperate. We refer to this set up as the baseline game (BL). The payoff matrix (displaying expected payoffs) for the baseline game is show in (a). Note that we assume that each player aims to maximize his or her own expected payoff within an expected utility framework which provides not only a first logical approach, but also remains the dominant one for studying decision making under risk.Footnote7
Figure 1. Payoff matrix (in points) of baseline social dilemma (SD) game (a), strict liability (SL) game (b), negligence liability (N) game (d), and contributory negligence (CN) game (d). PNE = Pure Nash Equilibrium; SO = Social Optimum; C = Cooperate; D = Defect.
Note: Under initial payoffs in the BL game and modified payoffs in the SL game, the pure Nash equilibrium is mutual defection (social optimum is mutual cooperation), while in the NL and CN game the Nash equilibrium equals the Social optimum if both cooperate.
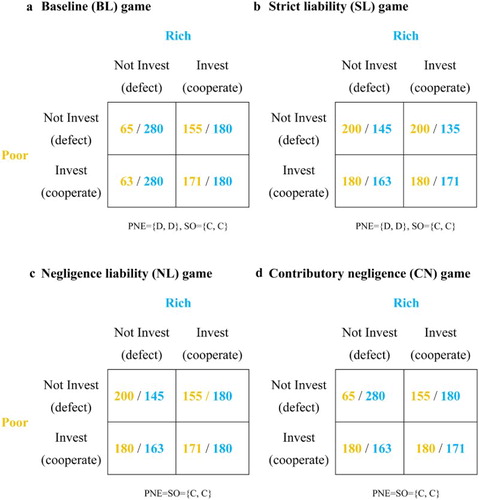
The modification in the treatments consists of imposing a liability rule setting responsibilities for expected damages, which is based on three levels: strict liability (SL), negligence (N), and contributory negligence (CN). Under the legal rule of ‘strict liability’ implying only a small modification of the payoff structure (see (b)), the liability of possible losses to the poor player was entirely shifted to the rich player. Here the poor player has no investment incentive as she is always compensated irrespective of her behaviour. The rich player’s payoff-maximizing strategy is not to invest either. Note that this liability rule is set as such that the pure Nash equilibrium was still to free-ride.
Under the legal rule of ‘negligence’ the rich player could only be held liable for losses in the case that she abstained from investment. This gives the rich player an incentive to invest to insure herself against compensation claims. A payoff-maximizing poor player should reciprocate the rich player’s effort by investing in climate policy too. Note that the modified payoff structure means that the social dilemma disappears. In fact, in this game the Nash equilibrium is socially optimal if both invest, i.e. cooperate.
Under the legal rule of ‘contributory negligence’ the rich player will be held liable for possible losses only if the poor player abstained from any investment and precautionary measures. The poor’s investment incentive here is strong. The rich player should realize this and also invest to further reduce catastrophe and thus compensation probability. Here, the Nash equilibrium is equal to the social optimum in the case of mutual cooperation. Again, this set-up constitutes a no dilemma situation. provides a summary of all treatments and shows all payoff matrices.
Table 1. Treatment conditions.
2.2. Experimental procedures
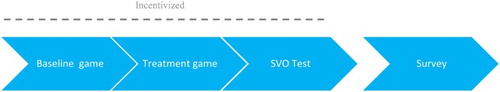
Before the experiment started, participants were informed that the experiment consist of various incentivized parts while only one part of the experiment would be randomly selected and paid to them in the form of a bonus (i.e. on top of their show-up fee of US$ 1.20). Payment depended on points earned in the respective part, with an exchange rate of 2 points for US$ 0.10. An experimental session proceeded then as follows. After all participants played the baseline game (part one), they were randomly assigned to one of the treatment games (part two). There was no feedback given after the baseline part (nor after the treatment game) and thus decision in later parts could not have been influenced. Furthermore, there was no framing with respect to concepts of climate change and compensation payments. Besides asking for their investment decisions, we also elicit participants’ expectations or beliefs about their matched partner’s preference, aiming to assess the degree of optimism about the behaviour of others (e.g. Fischbacher & Gächter, Citation2010).
In part three, participants completed a social value orientation test (SVO) using an online version of the SVO slider measure which is commonly used in research on social preferences (Murphy, Ackermann, & Handgraaf, Citation2011).Footnote8 This test was administered in order to control for the positive effect of social preferences on cooperation (e.g. Murphy & Ackermann, Citation2012). Finally, all participants filled in a short survey on socio-demographic characteristics and other attitudes including loss aversion and generalized trust.Footnote9 The latter is an important prerequisite for cooperation between strangers (e.g. Gächter, Herrmann, & Thöni, Citation2004; Thöni, Tyran, & Wengström, Citation2012). No feedback was given during the entire experiment and actual payoffs were determined through ex-post matching as is common with behavioural experiments on Amazon Mechanical Turk (AMT). provides a summary of the experimental timeline.
Figure 2. Experimental flow.
2.3. Experimental logistics
We implemented an incentivized online experiment and recruited participants using AMT, an online crowd-sourcing platform increasingly used to run behavioural experiments (e.g. Paolacci, Chandler, & Ipeirotis, Citation2010; Rand, Citation2012). Note that results from economic experiments using data collected at AMT have been shown to be quantitatively similar with behaviour of generic student samples conducted in typical laboratory settings (e.g. Suri & Watts, Citation2011), while at the same time AMT allows for a quick and efficient recruitment of a more demographically diverse set of subjects than standard internet and college student samples (e.g. Buhrmester, Kwang, & Gosling, Citation2011).
In total, we recruited 1240 participants through AMT, from which we obtained informed consent before the start of the experiment. The online experiment lasted on average eight minutes and participants earned between US$ 1.20 and 2.65 (including the show-up fee). The latter amounts are in line with standard wages paid for such online studies. For our analysis, we screened participants based on the time they needed for completion of the online experiment and excluded all participants who finished two times faster than the median completion time. The final sample includes 1131 subjects (N = 758 for study 1; N = 373 for study 2). In study 1 (N = 758) each participant was randomly assigned to either a ‘rich’ or ‘poor’ player profile. In study 2 (N = 373) all US participants were assigned the role of a ‘rich’ player and all Indian participants the one of a ‘poor’ player, and this assignment was common knowledge.Footnote10 In both studies, role assignment remained fixed throughout the experiment.
3. Results and discussion
We concentrate on analysing individual investment or cooperation decisions. Our main dependent variable is thus cooperation/investment, which has the value of 1 (if the participant cooperates/invests) or 0 (if the participant defects/does not invest). reports summary statistics of individual cooperation, expectations and socio-demographic information as well as preference data (social preference angle from SVO test, generalized trust and loss aversion score). also reports the percentage of players failing comprehension questions which were asked before starting the decision-making phase.
Table 2. Summary statistics.
3.1. Results of study 1
(a) shows cooperation rates across all treatments. As expected, we find that the proportion of participants that cooperate, i.e. invest, is much higher in N (82%) and CN (80%) than in the baseline (60%; p = 0.000, χ2-test). This finding shows the strong effect of payoff incentives on the likelihood of cooperation: in N and CN, investing maximizes the expected payoff for at least one player. Contrary to game theory prediction, however, cooperation occurs significantly more often also in SL than in the baseline (70%, p = 0.009). Poors’ cooperative behaviour in SL might be motivated by altruistic reciprocity: more poor are not tempted to exploit the rich under SL, in contrast to BL ((b)). Looking at investment rates across rich and poor players ((c)), we find the rich far more sensitive to payoff incentives than the poor. In N and CN, 85% and 71% cooperated respectively, while only 43% did so in the baseline (p = 0.000, p = 0.000, χ2-test).
Figure 3. Cooperation rates across treatments and player types in study 1. (a) Average cooperation across treatments. (b) Cooperation rates across rich and poor player in all treatments. (c) Cooperation and average expectations (light coloured bars) of the cooperative behaviour of the counterpart by player type and treatment. Error bars indicate standard errors of the mean.
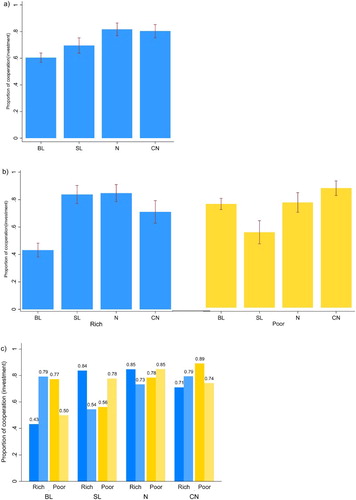
In the next step, we explore the behavioural channels through which liability may affect behaviour, by investigating in detail (i) participants’ expectations or beliefs about the investment behaviour of others and (ii) if participants’ social preferences are predictive of investment decisions. Comparing participants’ beliefs with actual behaviour reveals interesting insights ((b)). In N and CN, beliefs regarding cooperation matches actual cooperation rates fairly closely. Participants seem to anticipate the modified incentive’s impact on their partner’s willingness to cooperate. In CN only is the richs’ expectation is 10 percentage points lower than the poors’ actual cooperation rates. This pessimistic expectation corresponds to richs’ lower cooperation (71%) in this treatment compared to the relatively similar N treatment (85%, p = 0.009, χ2-test). These results suggest that not only rich players’ own willingness to cooperate, but also their expectation of poors’ cooperation depends on liability allocation being dependent on their own decisions. If that is not the case, as in CN, both richs’ cooperation and their beliefs in poors’ cooperation are lower. Regression analysis with the likelihood to cooperate (invest) as a dependent variable (see .1 in Supplementary File S2 for the combined sample) confirms all our findings.
Next, to explore if behaviour might differ depending on the participant’s degree of social preference, we analyse the social preference scoreFootnote11 which resulted from the six-item SVO slider measure. Similarly to expectations, we find that social preferences are clearly predictive of cooperation (see Table 2.1 in Supplementary File S2). This is in line with research showing that social preferences predict cooperation in social dilemmas (for a review, see Balliet, Parks, & Joireman, Citation2009). We further examine whether there is a difference in the results of the SVO angle between cooperators and non-cooperators in our treatments. In all treatments, BL (16.21° of cooperators vs 27.44° from non-cooperators, p = 0.00; t-test), SL (18.76° of cooperators vs 26.03° from non-cooperators, p = 0.00), N (14.51° of cooperators vs 25.38° from non-cooperators, p = 0.00), and CN (15.39° of cooperators vs 23.33° angle from non-cooperators, p = 0.00) cooperators consistently have higher SVO scores. This indicates that the overwhelming positive effect of social preferences on a participant’s cooperation (or investment) is not contingent on the liability treatment. This means that social preferences support cooperation irrespective of which liability regime is in place.
3.2. Results of study 2
For study 2, US participants were assigned the role of rich, and Indian participants the role of poor players. Participants knew the nationality of their counterparts. Similar to study 1, we find that average cooperation rates are significantly higher in all treatments than in BL (63%) and highest in CN (80%, χ2-test p = 0.001). Interestingly, purposefully assigning Americans to the rich and Indians to the poor role changes the likelihood of individual investment in some treatments compared to study 1 (see ). In SL, more Indian players invest (72% compared to 56% in study 1, χ2-test p = 0.034), whereas fewer US players do so (75% vs 84% in study 1, p = 0.136) as compared to poor and rich players in study 1, respectively. This suggests that in a more realistic setting significantly fewer poor players are willing to exploit unconditional compensation entitlement, even if negligence is not sanctioned. At the same time, however, more rich players seem to fear being exploited as the lower investment level suggests they expect catastrophe to be more likely and do not want to reduce their payoff further by investing unsuccessfully. Table 2.1 in the Supplementary File reports results of a probit regression including an interaction between player type and study. It confirms the significant interaction between nationality and investment behaviour in SL (p = 0.002).
Figure 4. Cooperation rates across treatments and player types in study 1 (left) and 2 (right).
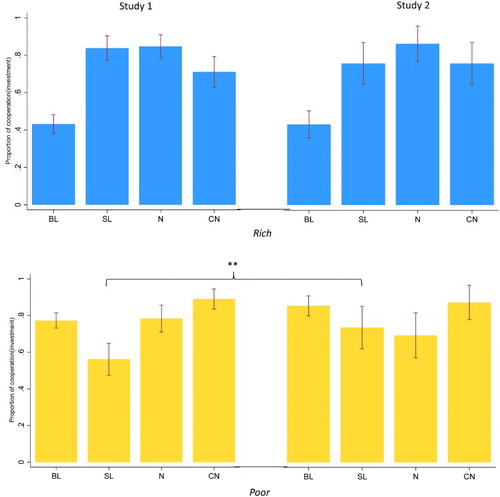
Next, we address the effect of behavioural issues (beliefs and social preferences) on cooperation as in study 1. We identify a notable difference between expectations in BL between study 1 and study 2. While rich and poor players expect 79% and 50% of their partners to cooperate respectively in study 1, US (i.e. rich) show higher (87%, p = 0.829, χ2-test) and Indian (i.e. poor) players in study 2 show significantly higher (74%, p = 0.002) expectations. Note that overall cooperation in this treatment is broadly the same between the two studies (study 1: 60%, study 2: 63%). This means that even if participants in study 2 expect others to cooperate, this does not affect their preference for reciprocity, i.e. they cooperate if they expect others to do so. Furthermore, in all treatments apart from N (non-significant) and CN (only borderline significant), the average social preference score of cooperators is significantly higher than non-cooperators (BL: 14.24° of cooperators vs 21.88° angle from non-cooperators, p = 0.00; t-test; SL: 13.00° vs 20.41°, p = 0.02; N: 16.50° vs 19.13°, p = 0.45; CN: 15.81° vs 21.36°, p = 0.08).Footnote12 In summary, in contrast to study 1, in study 2 we find evidence of the positive effects of social preferences being different across liability regimes.
4. Conclusions
We have examined the effect of liability rules on investments in climate policy among a more homogenous (US only, study 1) and heterogeneous (US and India, study 2) population. Our experiment tests the argument that institutionalizing a form of liability for climate damages can increase global climate policy ambition, potentially facilitating an effective climate agreement. We show that liability rules aligning individual and group incentives (N and CN treatment) significantly increase willingness to invest and cooperate. One reason for successful mutual investments is that liability coupled with negligence provisions increases investment incentives while at the same time alleviating fear of being exploited (or temptation to exploit the other). Beliefs about the latter represent a significant barrier to a successful negotiation outcome between richer and poorer nations. We show that, far from impairing the global bargaining process, institutionalizing rules for loss and damage could thus aid in breaking the negotiation deadlock.
Our experimental results are in line with other studies showing that eliminating fear increases cooperation in social dilemmas, most notably among those characterized by low generalized trust in others (Parks & Hulbert, Citation1995). This result holds across study samples (study 1 and 2). We show that making economic and vulnerability differenced more explicit by promoting nationality has no effect on cooperation under negligence and contributory negligence (study 2), yet it affects cooperation under strict liability, when the fear of being exploited or the temptation to exploit others is greatest. In a setting of limited liability including negligence provisions arguably more realistic to be institutionalized than strict liability fewer poor actors try to exploit compensation entitlements. This finding should assuage the fears of developed countries regarding potentially unlimited compensation claims.
Based on our findings, one can also speculate that besides working as an incentive-based commitment device, a liability mechanism could set in motion a spiral of reciprocal ambition raising. Concessions in international negotiations are highly contingent on the preparedness of counter-parties to follow up or move first, as the rhetorical brinkmanship of governments like China’s and the United States’ in the UNFCCC shows (Shum, Citation2014). If developed countries acknowledge their historical responsibility by accepting establishment of an international liability mechanism, developing countries might reciprocate by adopting binding mitigation commitments yielding global benefits, in addition to increased adaptation efforts. If developed countries anticipate this reciprocal behaviour they have a reason to agree to a liability mechanism in the first place, and might now be willing to further cut their own emissions, and so on. Carefully designed liability rules could thus facilitate the emergence of mutually reinforcing reciprocal behaviour in global climate governance.
Acknowledgements
We benefited considerably from earlier discussions with Joschka Gerigk, Julia Blasch, Markus Ohndorf, and Brilé Anderson, and thank Timo Goeschl, Vally Koubi, Till Requate, and Israel Waichman for helpful comments on a draft version of this article. Author contributions: E.G., R.G., E.B. and A.M.D. designed the experiment. E.G., R.G., and A.M.D. performed the pilot experiment and E.G. and R.G. the online experiment. E.G. and R.G. jointly analysed the data and wrote the paper.
Disclosure statement
No potential conflict of interest was reported by the authors.
Additional information
Funding
Notes
1. See Decision 1/CP.21 available online: http://unfccc.int/resource/docs/2015/cop21/eng/10a01.pdf
2. Our design thus assumes rich players to be responsible for climate damages and poor players to be vulnerable. While these relationships do not follow automatically, they tend to hold in approximation empirically (e.g. Füssel, Citation2010).
3. There is some quantitative research addressing causal responsibilities and assigning compensation shares (expressed in USD$ or as fraction of GDP) to individual countries (e.g. Dellink et al., Citation2009; Tol & Verheyen, Citation2004). Furthermore, Lees (Citation2017) discusses the allocation of responsibility in the light of the new Paris Agreement.
4. We are only aware of one experiment testing the effect of liability on cooperation in a public good setting, i.e. liability aiming to deter free-riding to prevent damage (e.g. pollution). Eisenberg and Engel (Citation2014) find that if redress is certain, tort liability is a deterrent in the sense that in a repeated dilemma, it is able to stop the downward trend of cooperation.
5. Whereas for study 1 we use participants with a homogenous background (US only), for study 2, we focus on a comparison of samples from the US and India.
6. This presents a simple pairwise interaction between two nations allowing us to concentrate on the effectiveness of liability. A pairwise approach can be easily extended (Barrett, Citation2016) to a multi-player public goods game more commonly used in the context of climate negotiations (e.g. Barrett & Dannenberg, Citation2012; Brick & Visser, Citation2010, Citation2015; Burton-Chellew, May, & West, Citation2013; Milinski, Sommerfeld, Krambeck, Reed, & Marotzke, Citation2008; Tavoni, Dannenberg, Kallis, & Loschel, Citation2011).
7. Nevertheless, empirically many people do not make decisions as expected utility maximizers (Camerer, Citation1998). Better descriptive models include, for example, prospect theory (Kahneman & Tversky, Citation1979) which allows modelling individual attitudes to risk with a value function. In particular, some argue that catastrophic risk patterns intrinsic to climate change such as small-probability and high-impact scenarios are better captured by prospect theory. For a review, see Heal and Millner (Citation201Citation4) who survey various alternative models of non-expected utility that more accurately describes decision making under climate uncertainty and climate change.
8. Supplementary File S1 provides an example choice item and detailed social preference data.
9. Supplementary File S3 provides full information on the post-experiment survey.
10. It should be acknowledged that, at the time we conducted the study, the online platform AMT only allowed the recruitment of participants from the US and India. We believe that both countries serve as a good choice representing our ‘poor’ and ‘rich’ nations divide, as modelled in the experiment. In doing so, however, we recognize that the terms ‘poor’ and ‘rich’ are complex, and can in no way be used to characterize these countries or their populations in any general sense.
11. Note, a higher score indicating stronger social preferences.
12. When comparing the average angle between US (21.51°) and Indian players (16.06°) in study 2 we find that participants from those two different backgrounds differ in their social value orientation (p = 0.00, Kruskal-Wallis Test, N = 373). In fact, while cooperators and non-cooperators significantly differ in the degree of social preference in the US population (14.38° vs 26.22°, p = 0.00, t-test), Indian players do not (14.76° vs 17.01°, p = 0.23).
References
- Angelova, V., Armantier, O., Attanasi, G., & Hiriart, Y. (2014). Relative performance of liability rules: Experimental evidence. Theory and Decision, 77(4), 531–556. doi: 10.1007/s11238-013-9405-0
- Balliet, D., Parks, C., & Joireman, J. (2009). Social value orientation and cooperation in social dilemmas: A meta-analysis. Group Processes & Intergroup Relations, 12(4), 533–547.
- Barrett, S. (2016). Coordination vs. voluntarism and enforcement in sustaining international environmental cooperation. Proceedings of the National Academy of Sciences, 113(51), 14515–14522.
- Barrett, S., & Dannenberg, A. (2012). Climate negotiations under scientific uncertainty. Proceedings of the National Academy of Sciences, 109(43), 17372–17376. doi: 10.1073/pnas.1208417109
- Botzen, W. J. W., Gowdy, J. M., & van den Bergh, J. C. J. M. (2008). Cumulative CO2 emissions: Shifting international responsibilities for climate debt. Climate Policy, 8(6), 569–576. doi: 10.3763/cpol.2008.0539
- Bouwer, L. M., & Aerts, J. C. J. H. (2006). Financing climate change adaptation. Disasters, 30(1), 49–63. doi: 10.1111/j.1467-9523.2006.00306.x
- Brick, K., & Visser, M. (2010). What is fair? Meeting a national emission reduction target in an experimental setting. Climate Policy, 10(5), 543–559. doi: 10.3763/cpol.2010.0106
- Brick, K., & Visser, M. (2015). What is fair? An experimental guide to climate negotiations. European Economic Review, 74, 79–95. doi: 10.1016/j.euroecorev.2014.11.010
- Buhrmester, M. D., Kwang, T., & Gosling, S. D. (2011). Amazon’s mechanical Turk: A new Source of Inexpensive, yet High-Quality, Data? Perspectives on Psychological Science, 6, 3–5. doi: 10.1177/1745691610393980
- Burton-Chellew, M. N., May, R. M., & West, S. A. (2013). Combined inequality in wealth and risk leads to disaster in the climate change game. Climatic Change, 120(4), 815–830. doi: 10.1007/s10584-013-0856-7
- Camerer, C. (1998). Bounded rationality in individual decision making. Experimental Economics, 1(2), 163–183. doi: 10.1023/A:1009944326196
- Dellink, R., Elzen, M., Aiking, H., Bergsma, E., Berkhout, F., Dekker, T., & Gupta, J. (2009). Sharing the burden of financing adaptation to climate change. Global Environmental Change, 19, 411–421. doi: 10.1016/j.gloenvcha.2009.07.009
- Eisenberg, T., & Engel, C. (2014). Assuring civil damages adequately deter: A public good experiment. Journal of Empirical Legal Studies, 11(2), 301–349. doi: 10.1111/jels.12042
- Fischbacher, U., & Gächter, S. (2010). Social preferences, beliefs and the dynamics of free riding in public goods experiments. American Economic Review, 100(1), 541–556. doi: 10.1257/aer.100.1.541
- Füssel, H. M. (2010). How inequitable is the global distribution of responsibility, capability, and vulnerability to climate change: A comprehensive indicator-based assessment. Global Environmental Change, 20(4), 597–611. doi: 10.1016/j.gloenvcha.2010.07.009
- Gächter, S., Herrmann, B., & Thöni, C. (2004). Trust, voluntary cooperation, and socio-economic background: Survey and experimental evidence. Journal of Economic Behavior & Organization, 55(4), 505–531. doi: 10.1016/j.jebo.2003.11.006
- Galbiati, R., & Vertova, P. (2014). How laws affect behavior: Obligations, incentives and cooperative behavior. International Review of Law and Economics, 38, 48–57. doi: 10.1016/j.irle.2014.03.001
- Hayward, T. (2012). Climate change and ethics. Nature Climate Change, 2(12), 843–848. doi: 10.1038/nclimate1615
- Heal, G., & Millner, A. (2014). Reflections: Uncertainty and decision making in climate change economics. Review of Environmental Economics and Policy, 8(1), 120–137. doi: 10.1093/reep/ret023
- Huq, H., Roberts, E., & Fenton, A. (2013). Loss and damage. Nature Climate Change, 3, 947–949. doi: 10.1038/nclimate2026
- IPCC. (2007). The fourth assessment report of the intergovernmental panel on climate change. Cambridge: Cambridge University Press.
- IPCC. (2012). Special report on managing the risks of extreme events and disasters to advance climate change adaptation. Geneva: Author.
- Kahneman, D., & Tversky, A. (1979). Prospect theory: An analysis of decision under risk. Econometrica, 47(2), 263–291. doi: 10.2307/1914185
- Lees, E. (2017). Responsibility and liability for climate loss and damage after Paris. Climate Policy, 17(1), 59–70. doi: 10.1080/14693062.2016.1197095
- Milinski, M., Sommerfeld, R. D., Krambeck, H.-J., Reed, F. A., & Marotzke, J. (2008). The collective-risk social dilemma and the prevention of simulated dangerous climate change. Proceedings of the National Academy of Sciences, 105(7), 2291–2294. doi: 10.1073/pnas.0709546105
- Murphy, R., & Ackermann, K. (2012). Explaining behavior in public goods games: How preferences and beliefs affect contribution levels. Available online at SSRN.
- Murphy, R. O., Ackermann, K. A., & Handgraaf, M. J. J. (2011). Measuring social value orientation. Judgment and Decision Making, 6(8), 771–781.
- Nordhaus, W. D., & Boyer, J. (2000). Warming the world: Economic models of global warming. Cambridge: MIT Press.
- Paolacci, G., Chandler, J., & Ipeirotis, P. G. (2010). Running experiments on Amazon mechanical Turk. Judgment and Decision Making, 5, 411–419.
- Parks, C. D., & Hulbert, L. G. (1995). High and low trusters’ responses to fear in a payoff matrix. Journal of Conflict Resolution, 39, 718–730. doi: 10.1177/0022002795039004006
- Posner, R. (1972). A theory of negligence. Journal of Legal Studies, 1, 29–96. doi: 10.1086/467478
- Rand, D. G. (2012). The promise of mechanical Turk: How online labor markets can help theorists run behavioral experiments. Journal of Theoretical Biology, 299, 172–179. doi: 10.1016/j.jtbi.2011.03.004
- Rogelj, J., den Elzen, M., Höhne, N., Fransen, T., Fekete, H., Winkler, H., … Meinshausen, M. (2016). Paris agreement climate proposals need a boost to keep warming well below 2°C. Nature, 534, 631–639. doi: 10.1038/nature18307
- Schwartz, G. (1994). Reality in the economics of tort law. Does tort law really deter? UCLA Law Review, 42, 377–444.
- Shum, R. (2014). China, the United States, bargaining, and climate change. International Environmental Agreements: Politics, Law and Economics, 14(1), 83–100. doi: 10.1007/s10784-013-9231-4
- Suri, S., & Watts, D. J. (2011). Cooperation and contagion in web-based, networked public goods experiments. PloS one, 6(3), e16836. doi: 10.1371/journal.pone.0016836
- Tavoni, A., Dannenberg, A., Kallis, G., & Loschel, A. (2011). Inequality, communication, and the avoidance of disastrous climate change in a public goods game. Proceedings of the National Academy of Sciences, 108(29), 11825–11829. doi: 10.1073/pnas.1102493108
- Thöni, C., Tyran, J.-R., & Wengström, E. (2012). Microfoundations of social capital. Journal of Public Economics, 96(7), 635–643. doi: 10.1016/j.jpubeco.2012.04.003
- Tol, R. (2005). The marginal damage costs of carbon dioxide emissions: An assessment of the uncertainties’. Energy Policy, 33(16), 2064–2074. doi: 10.1016/j.enpol.2004.04.002
- Tol, R. (2009). The economic effects of climate change. Journal of Economic Perspectives, 23(2), 29–51. doi: 10.1257/jep.23.2.29
- Tol, R., & Verheyen, R. (2004). State responsibility and compensation for climate change damages – A legal and economic assessment. Energy Policy, 32, 1109–1130. doi: 10.1016/S0301-4215(03)00075-2
- UNFCCC. (2013). Decision 2/CP.19: Warsaw International Mechanism for Loss and Damage Associated with Climate Change Impacts FCCC/CP/2013/10/.