
ABSTRACT
The expectancy disconfirmation model (EDM) posits that disconfirmation (the difference between expectations and perceived performance) affects citizen satisfaction. Van Ryzin experimentally manipulated expectations and performance and found a direct effect of performance, but no disconfirmation. We performed: an exact replication; a conceptual replication with extreme manipulations; a conceptual replication that reversed the order of a performance and expectations manipulation. Study 1 and 2 reproduced original findings. In contrast, study 3 indicates that expectation cues are retrospectively used to anchor prior experiences of performance. As the rational assumptions underlying the EDM are increasingly challenged, we need a better understanding of how cognitive biases shape citizen satisfaction.
Introduction
The expectancy disconfirmation model (EDM) has emerged as the predominant model of explaining citizen satisfaction in the public sector (e.g. Van Ryzin Citation2004, Citation2006; James Citation2009; Morgeson Citation2012). The model posits that citizen satisfaction is not only the result of the objective performance of a government service, but also depends on the implicit prior performance expectation of that service. For instance, if the perceived performance of a service positively exceeds prior expectations this results in positive disconfirmation, which in turn will lead to more satisfied citizens. Therefore, varying expectations of the performance of a public service are said to play a critical role in explaining differences in citizens’ satisfaction.
So far, most empirical tests of the EDM have been based on cross-sectional research (e.g. Van Ryzin Citation2004, Citation2006; Roch and Poister Citation2006; Morgeson Citation2012). Although this survey research has largely confirmed the relationships central to EDM, these studies have been unable to disentangle the causal relationships in the model due to the simultaneity of key variables in the model. In an attempt to address some of this causal ambiguity, James (Citation2011) employed field and laboratory experiments and demonstrated that performance cues can indeed influence citizen satisfaction. However, while James’ findings were meaningful, they did not test all the relations of the EDM.
In a more recent study, Van Ryzin (Citation2013) experimentally tested the full EDM to test the causality of key relations in the model. This experiment, however, yielded mixed results and was unable to confirm some of the core relationships in the model. Specifically, Van Ryzin’s experiment only confirmed one part of the model, which is the positive effect of performance on satisfaction. However, there was no evidence of a direct effect of expectations on satisfaction, which has been said to directly influence satisfaction in some cases (e.g. James Citation2009). More remarkably, Van Ryzin found no effects attributable to the core mediating variable in the model: disconfirmation. Hence, although the EDM has been confirmed in cross-sectional research, experimental evidence has been unable to confirm some of the basic premises of the model.
The inability to confirm central features of the EDM using experiments has led scholars to question some of the very basic assumptions that underlie the EDM. Among these assumptions, as Andersen and Hjortskov explain (Citation2016), is that of a citizen who deliberately and rationally reflects on government performance and expectations. Indeed, as a wealth of literature from the field of psychology demonstrates, most of human thinking is not deliberate and reflective, but intuitive and fast (e.g. Tversky and Kahneman Citation1974). Working from this premise, Andersen and Hjortskov carried out a field and a survey experiment and found indications that more associative ways of thinking affect citizen satisfaction. For instance, they found that presenting participants with a frame of either budget cuts or a frame with no budget cuts does not change their expectations about performance. This finding contradicts the EDM because, according to the EDM, citizens are amenable to new information and take it into consideration in the process of determining expectations and, subsequently, their levels of satisfaction. This finding would mean that citizens behave less rationally in determining their satisfaction than assumed by the EDM.
However, it may be too soon to reach such conclusion since there has been so little experimental evidence on the EDM in public management research. Our goal is to provide a more rigorous experimental evaluation of the EDM. To do so, we carry out three replications of this popular model in order to assess different reasons why Van Ryzin’s original experiment was unable to provide evidence of disconfirmation. To this end, we carry out three replications:
An exact replication to see if the basic findings are reproduced using a different sample. In other words, we explore the possibility that disconfirmation was not found due to idiosyncrasies of the sample that was used.
A conceptual replication in which we consider the possibility that disconfirmation was not uncovered in Van Ryzin’s study because the manipulations were too subtle. Therefore, we will carry out a replication with more extreme manipulations, in order to understand whether disconfirmation might arise when the differences between expectations and performance are more extreme.
A conceptual replication considering the possibility that the assumption expectations must always precede performance is wrong. Rather, as we explain in greater detail later in the paper, it is also possible for perceptions of performance to precede performance expectations and, in turn, give rise to disconfirmation. Therefore, in this third replication we will reverse the order of the performance and expectations manipulations.
Through our assessment of the EDM, we contribute to understanding of the determinants of citizen satisfaction, as our experimental tests will help to flesh out the debated causal relations of the EDM more convincingly. Alternatively, if our replications fail to confirm the EDM, this may indicate that other explanations of citizen satisfaction must be explored further. In the next section, we will provide an explanation of the EDM and the original experiment by Van Ryzin (Citation2013).
The expectancy disconfirmation model
Expectancy disconfirmation theory was developed as a way to explain customer decision-making (Oliver Citation1997, Citation1980) but the theory has been applied and confirmed in public management. The model is depicted in .
Figure 1. Expectancy disconfirmation model (Van Ryzin Citation2004, Citation2013).
The EDM is premised upon three core relationships, which are illustrated in . The first focal relationship is the direct effect of perceptions of performance on citizen satisfaction. This is a fairly intuitive effect and probably the least contested in the model. Prior studies have consistently confirmed this direct link, which is independent of expectations and disconfirmation (Van Ryzin Citation2004, Citation2006; James Citation2009; Morgeson Citation2012). This link is also supported by experimental evidence from Van Ryzin’s experiment (Citation2013).
The second link predicts a direct effect of expectations on satisfaction. This link is less apparent and requires some explanation. Expectations could have a positive direct effect on satisfaction for the reason that people may use their expectations as baseline to form a judgment about a government service (Van Ryzin Citation2013). These expectations could ‘colour’ the satisfaction judgment independently. However, evidence on the direct link between expectations and satisfaction is mixed. Poister and Thomas (Citation2011) found a negative direct effect. Other studies find a positive direct effect of expectations (Oliver and DeSarbo Citation1988; Van Ryzin Citation2004; Morgeson and Petrescu Citation2011).
The third relationship in the model is the very heart of the EDM: disconfirmation. The idea is that higher performance will increase chances of positive disconfirmation, whereas higher expectations decrease the chance of positive disconfirmation, but increase the chance of negative disconfirmation. Subsequently, positive disconfirmation leads to higher satisfaction and negative disconfirmation leads to lower satisfaction. In other words, if performance is high this is more likely to exceed expectations and lead to higher satisfaction. Higher expectations, on the other hand, are less likely to be exceeded even if performance is high. Therefore, higher expectations can lead to negative disconfirmation and less satisfaction. This link has been empirically established by various studies (Van Ryzin Citation2004, Citation2006; Roch and Poister Citation2006; Morgeson Citation2012). However, most empirical evidence on this point is based on observational survey data, which makes it impossible to distinguish the causality of expectations and satisfaction, because satisfaction could also drive expectations instead of the other way around.
Two experimental studies by James (Citation2011) and Van Ryzin (Citation2013) are exceptions to this body of research. The study by James presents two experiments in a field setting investigating the effect of excellent and poor performance statements on normative expectations (i.e. what the level of performance of a service should be) and whether expectations have a direct effect on satisfaction. He finds that there is a slight negative effect of expectations on satisfaction. In other words, people with very high expectations tend to be less satisfied.
The second experimental study in the area of expectancy disconfirmation, by Van Ryzin (Citation2013), is the only experiment designed to test the expectancy disconfirmation fully. Although a traditional regression analysis confirms the linkages in the model, the experimental analyses do not seem to confirm two core assumptions: the effect of disconfirmation and the effect of expectations on satisfaction. The next section will provide more detail about the experiment.
The original experiment by Van Ryzin
Van Ryzin’s (Citation2013) experiment manipulated two core variables in the EDM: expectations and performance. Expectations were manipulated by presenting two vignettes about a hypothetical city government. In the low expectations version (presented as a press release), citizens’ expectations of street cleanliness were manipulated by stating that due to budget cuts ‘The streets may not be as clean as you expect, potholes may not be fixed as fast as they should be, and many other city services will no longer meet our usual high standards’ (Van Ryzin Citation2013, 604). In the high expectations manipulation, the press release stated that ‘the city will find a way to make sure that the streets stay as clean as you expect them to be, that potholes continue to be fixed as fast as they should be, and that all city services will be maintained at our usual high standards’ (p. 604). A manipulation check indeed showed that participants in the low expectations statement had significantly lower expectations (3.75 on a 7-point scale) than the high expectations group (4.61 on a 7-point scale).
Next, participants were presented with a performance cue, which was a photograph of ‘a typical city street in Hometown’. The high performance picture showed an almost clean street, whereas the low performance picture showed a street that was slightly littered. Van Ryzin deliberately chose subtle manipulations to enhance ecological validity of the experiment. The subsequent manipulation check again demonstrated that the manipulation ‘worked’ – low performance participants perceived the city government performance lower (2.77) than the high performance participants (4.06, both on a 7-point scale).
The analysis of the results shows that the most intuitive link in the model – the direct link between performance and satisfaction – is confirmed. No direct effect of expectations on satisfaction was found, which is less surprising given the mixed results of past studies assessing this relationship (e.g. James Citation2011; Van Ryzin Citation2006). The most remarkable result in this model, however, is that the experiment seems not to confirm the heart of the EDM: the effect of disconfirmation on citizen satisfaction.
Yet, it is also important to draw attention to a key caveat: disconfirmation was not directly manipulated in the experiment using a single variable. This is because, deriving an effective means of manipulating disconfirmation is very challenging. Therefore, in this study disconfirmation, as a mediating variable in the EDM, suffers from the same issues as other cross-sectional research when it is regressed on citizen satisfaction.
However, we argue that although disconfirmation may not be manipulated using a single variable, implications of its existence can be tested using a factorial design – as Van Ryzin did. If disconfirmation is to predict satisfaction, one would expect that the interaction between expectations and performance would affect satisfaction too. For instance, we would assume levels of satisfaction would differ across the high and low expectations groups, holding performance constant. To this end, for example, participants assigned to a treatment group with low expectations and high performance will experience positive disconfirmation and thus possess greater satisfaction. In other words, although disconfirmation may not be manipulated directly in an experiment, we argue that it is possible to draw upon indirect manipulations of disconfirmation through the use of an interaction term in experimental manipulations.
Van Ryzin did not find evidence of a significant interaction effect and thus the causal evidence seems to fail the core of the EDM: that an implicit comparison of actual performance to prior expectations is a determinant of citizen satisfaction. In this paper, we will present three studies to replicate the Van Ryzin experiment. First, we designed an experiment that was a close replication of the original experiment, with a different type of sample. This was done to assess the external validity of the original experiment (Morton and Williams Citation2010). Second, we carried out two additional replications with slight alterations to the original to see if disconfirmation occurs using slightly different experimental designs. The design of each study is explained in the next section.
Design of the three studies
Study 1: exact replication
Study 1 closely follows the method and procedure presented in the Van Ryzin experiment, which was outlined above. The experimental design was a 2 × 2 factorial, in which participants are randomly assigned to a low or high expectations manipulation and a low or high performance manipulation. Vignettes were used to prime the expectations – the vignettes used in this study are exactly the same as those used in the original experiment. The vignettes present a press release with a statement by the mayor of a hypothetical city government, stating that either performance is expected to drop (low expectations) or to be maintained (high expectations).
Study 1 was intentionally kept very similar to the original experiment. In addition to using the same expectation cues, we also created highly similar performance cues. Van Ryzin used two pictures of a street in New York City (NYC) to depict street cleanliness, as a cue for performance. These two pictures were no longer available online. Therefore, we purchased a similar, rights-free, stock photo and used Adobe Photoshop to manipulate the cleanliness of the streets. To determine how clean or dirty the street should look, we used the pictures from the original experiment as a guideline, in combination with the NYC street cleanliness scorecard (Van Ryzin, Immarwahr, and Altman Citation2008). Following these guidelines, we created two pictures that differ very slightly from those used in the original experiment, but fit with the level of cleanliness as depicted by Van Ryzin (see Appendix ‘Experimental materials’).
Study 2: conceptual replication with extreme manipulations
One possible reason that no disconfirmation was found experimentally may be that the manipulations in the original experiment were not strong enough. Van Ryzin deliberately chose rather subtle manipulations (Van Ryzin Citation2013, 610), to ensure the ecological validity of his experiment. Yet this might be one of the reasons that no disconfirmation was found. For instance, it may be that, only when very low expectations are disconfirmed by very high expectations, or when very high expectations are disconfirmed by very low performance is the cognitive-rational thinking process needed for disconfirmation (Andersen and Hjortskov Citation2016) triggered.
To test this possibility, we devised a conceptual replication of the original Van Ryzin experiment. We altered the expectations statements in order to elicit more extreme expectations (low and high). In the very low expectations statement, we added language that emphasized that declines in public services will be ‘highly noticeable’ and that ‘the streets will definitely become less clean’ and that the quality of life would decline ‘drastically’. All manipulation materials can be found in the Materials Appendix.
The performance manipulation was adjusted by again taking the NYC balanced scorecard as a guideline. However, in contrast with the original experiment we did not choose two cleanliness scores rather close to each other but two more extreme scores (see Appendix).
Study 3: conceptual replication with reversed manipulations
A third possibility is that disconfirmation does not occur due to the ordering of the expectations and performance variables. For example, it may be that the performance cue overrides expectations, thereby explaining the absence of disconfirmation. Alternatively, it is also possible that the assumption that expectations must precede performance in order for disconfirmation to occur is wrong. Instead, perhaps disconfirmation only arises when perceptions of performance precede expectations. This might explain why disconfirmation is detected by studies drawing upon cross-sectional survey data, but does not appear in experiments, which are able to clearly order participants exposure to these variables.
One way to test this possibility is to reverse the order of experimental manipulations. In the third experiment, we will first present the performance cue to the participants and then the expectations statement. The following statement will preface the expectations statement; ‘the city released the following statement 2 months earlier’.
Furthermore, expectations of performance may not always precede perceptions of performance. Instead, the two constructs can also vary simultaneously in the minds of citizens. For example, they may read something about street cleanliness on a government website and instantly compare what they read to their experiences with their own street. Moreover, citizens could experience a certain level of performance and then adjust their expectations based upon the levels of performance they have perceived. For example, they may observe a very clean street, which in turn serves to enhance their expectations of street cleanliness.
Method
Data and participants
We used Amazon’s Mechanical Turk (MTurk) to the collect data used in our experiments. MTurk is an online labour market platform where respondents are paid to carry out small tasks, such as participation in surveys and online experiments. An advantage of using MTurk is that it allows for more diverse samples in terms of demographic variables, especially compared with other ‘convenience’ samples such as students.
There are three main concerns when using MTurk to recruit participants. The first concern is whether MTurk samples are biased, because participants often complete multiple surveys in a single day. However, research that has compared findings drawn from studies based on MTurk samples to those drawn from non-MTurk samples shows that the results are comparable (Berinsky, Huber, and Lenz Citation2012), indicating that bias using MTurk samples is not of great concern. A second concern is whether the use of MTurk samples is ethical, mostly because generally the payment for participants is very low: the average payment for a survey translates to an hourly wage about $2 an hour for workers in the United States (Ross et al. Citation2010). To account for this, in line with suggestions by Williamson (Citation2016), we paid an hourly wage, which was greater than the federal minimum hourly wage ($7.25), of approximately $10 per hour.
Third, MTurk samples are sometimes criticized because ‘workers’ (those who receive payment for completing tasks on Mturk) typically complete many surveys regularly. This may make them unsuitable for experiments because they arguably respond differently to questions and stimuli. Also, workers may want complete surveys as fast as possible to earn money without taking the question and manipulations seriously. To account for this risk, we built in various procedures as per below (see, for instance, Mason and Suri Citation2012; Oppenheimer, Meyvis, and Davidenko Citation2009)Footnote1:
A control question about the manipulation asking what the expectations statement was about. This was used to filter wrong answers and remove these participants from the data.
Remove participants who completed the survey in less than 1 minute.
Remove participants who completed the survey in more than three standard deviations above the mean completion time.
Remove double entries based on IP addresses.
Based on a pilot study (N = 40) we used GPower 3.1 (Faul et al. Citation2007, Citation2009) to calculate our sample size (f = 0.216, α = 0.05, n = 372). We allowed 400 MTurk workers to complete the experiment and, after removal of bad data (see points 2–4 above), 309 participants remained in the data set. In the end, this sample size was sufficient to analyse our data and find meaningful results. Because the effect size was larger than anticipated based on the pilot study, a smaller sample size was estimated (f = 0.362, α = 0.05, n = 136). In study 2 and 3, we allowed 200 MTurkers to complete our experiment. After removal of bad data, 173 participants remained in study 2 and 165 in study 3.
The following sample characteristics were obtained for each study (see for details).
Table 1. Sample characteristics.
The original experiment reports that 64 per cent were females, the median age was 44, 28 per cent had a 4-year college degree, 33 per cent identified as liberals, 41 per cent as moderates, and 26 per cent as conservatives (Van Ryzin Citation2013). Our MTurk samples are clearly different: more liberal/democrat leaning, more males, and more highly educated. Using a very different sample has the advantage of testing the external validity of experimental findings, in other words we can assert if the original findings hold under different sample compositions (Morton and Williams Citation2010).
Measures
We used the same measures as in the original experiment.
Expectations manipulation check: ‘Based on what you have read about Hometown, how would you rate your expectations for the city government’s performance?’ (1 = very low expectations to 7 = very high expectations).Footnote2
Performance manipulation check: ‘How would you rate the cleanliness of city streets in Hometown?’ (1 = poor to 7 = excellent).Footnote3
Satisfaction measure: ‘Based on the cleanliness of Hometown, how satisfied would you be with the city government’s performance?’ (1 = very dissatisfied to 7 = very satisfied).
Materials
Materials were already discussed in the ‘Design’ section. All materials can be found in the Appendix. The underlined text in the Appendix highlights the language we changed to make them fit the ‘very low’ and ‘very high’ expectations for study 2. Study 1 and 3 use the same materials but in reversed order.
Procedure
All participants ran through the following steps in the experiment:
Introductory text describing the study (HIT) on MTurk.Footnote4
Reading consent form.
Reading introductory language: ‘Hometown is a medium-size US city with a growing population. Recently, Hometown’s city administrator made the following public statement about the current economic situation and the city’s budget difficulties’.
Read page with expectations cue (see Appendix).
Manipulation check of expectations.
Read page with performance cue (see Appendix).
Manipulation check of performance.
Satisfaction question.
Control questions.
Debriefing.
Step 4/5 and 6/7 were reversed in Study 3.
Results
Study 1: exact replication
The overall effect of the experimental manipulation was significant (F(3,305) = 14.68, p = .000, eta-squared = .126). A post hoc group comparison was carried out to highlight which of the experimental groups specifically differ from each other.
indicates that the level of performance seems to be a strong determining factor in citizen satisfaction judgments. Group 1 did not differ significantly from group 3 (both low performance), and participants in group 2 did not significantly from group 4 (both high performance). However, the low performance groups (1 and 3) were significantly different from the high performance groups (2 and 4).
Table 2. Post hoc group comparison for study 1.
A subsequent two-way factorial ANOVA, using expectations and performance as separate factors, indeed showed that performance had a strong and significant effect on citizen satisfaction (F(1,305) = 39.93, p = .000, eta-squared = .116). A much weaker, though significant independent effect was found for expectations (F(1,305) = 4.25, p = .04, eta-squared = .014). This means that although performance clearly has the strongest effect on citizen satisfaction, expectations also have a slight positive effect independent from performance.
The two-way factorial ANOVA also assessed if the two independent factors (expectations*performance) interacted with each other. This interaction analysis was used to test the presence of disconfirmation. In the theory section, we argued that in case of disconfirmation – being an implicit comparison between performance and expectations – an interaction effect between expectations and performance should occur. However, we found no such effect (F(1,305) = 0.07, p = .788, eta-squared = .000). visualizes our findings.
Figure 2. Citizen satisfaction for study 1 (close replication).
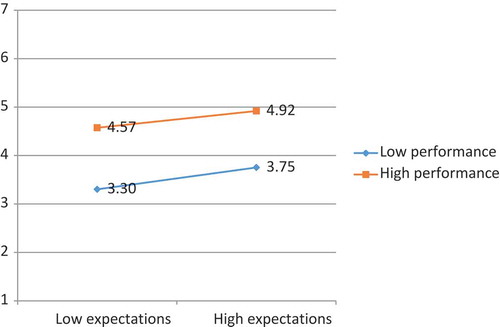
How do our figures compare with Van Ryzin (Citation2013)? First, the overall mean scores in our experiment are higher. However, this is expected given the different sample composition. The patterns and differences between groups in our study’s findings mirror those from the original experiment too: a strong main effect of performance. Another difference is that we found a main effect of expectations on satisfaction, whereas no such effect was present in the original experiment.
Study 2: conceptual replication with extreme manipulations
In study 2, we varied both manipulations by making them more extreme. The expectations cue primed participants for either extremely low or extremely high expectations, the performance cue (a picture) either showed a perfectly clean versus a highly littered street. The overall effect of the experimental manipulation was significant (F(3,169) = 122.62, p = .000, eta-squared = .685).
shows the same patterns as in Study 1: the level of performance seems to be the determining factor in citizen satisfaction judgments. Groups 1 and 3 did not differ significantly from each other, Groups 2 and 4 did not differ either. However, the low performance groups (1 and 3) were significantly different from the high performance groups (2 and 4).
Table 3. Post hoc group comparison for study 2.
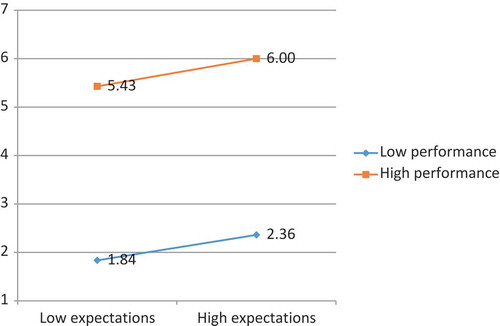
A subsequent two-way factorial ANOVA, using expectations and performance as separate factors, showed that performance had a highly significant effect on citizen satisfaction (F(1,169) = 362.19, p = .000, eta-squared = .682). A weaker effect was found for expectations (F(1,169) = 8.32, p = .004, eta-squared = .047). The interaction between the two factors again was not significant (F(1,169) = 0.015, p = .902, eta-squared = .000).
shows that the differences between the experimental groups were very large, as we might expect because the materials were changed to mimic a more extreme performance and expectations treatment. In contrast to what we expected, the extreme replication failed to provide evidence of a disconfirmation effect. This is because, if disconfirmation were to have occurred, we would have expected to find, for instance, that participants in the low expectations–high performance group are more satisfied than in those in the high expectations–high performance group. Or we would expect to see that participants in the high expectations group become extremely dissatisfied when they see what the streets actually look like. However, our research provides no evidence of such relationships. In contrast, it seems that expectations somehow give a small boost to satisfaction, regardless of performance, given the independent main effect of expectations.
Figure 3. Citizen satisfaction for study 2 (extreme replication).
Study 3: conceptual replication with reversed manipulations
In study 3, we reversed the order of the performance cues: first participants were shown the performance photograph and following this the expectations statement was provided. The expectations statement was presented in order to appear as if it was ‘released 2 months ago’. This replication was carried out to understand whether disconfirmation might occur if the order of expectations and perceptions of performance was reversed. The overall univariate effect was significant (F(3,163) = 20.92, p = .000, eta-squared = .278).
shows a somewhat different pattern compared to the previous two experiments. No longer does the performance cue seem to be the main predictor of satisfaction. For instance, group 1 (low expectations, low performance) does not differ significantly from group 2 (low expectations, high performance). Furthermore, group 2 does not differ from group 3 (high expectations, low performance). Remarkably, group 4 (high expectations, high performance) stands out and has a mean score that is 1.79 points above the second highest scoring group.
Table 4. Post hoc group comparison for study 3.
The two-way factorial ANOVA showed that performance nevertheless did have a significant effect on citizen satisfaction (F(1,163) = 32.54, p = .000, eta-squared = .166). A similar effect size was found for expectations (F(1,163) = 28.49, p = .000, eta-squared = .149). However, a key point of distinction in this experiment, interestingly, is that the interaction between the two factors was significant (F(1,163) = 4.60, p = .035, eta-squared = .027).
Various interesting observations can be drawn from . The first and most remarkable is that participants who saw the exact same performance photograph of street cleanliness rated their satisfaction very differently, with their responses contingent upon whether they were exposed to the high or low expectations prompt. Under low expectations, the same photograph led to a much lower level of satisfaction (3.83) when compared with the high expectations prompt (5.71).
Figure 4. Citizen satisfaction for study 3 (reverse replication).
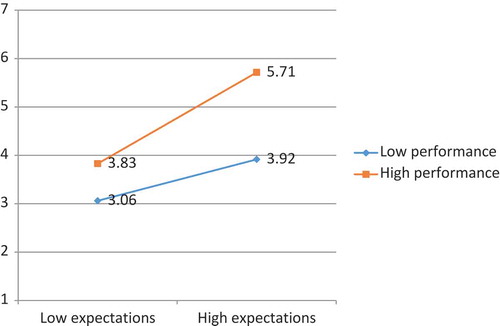
Second, the slopes in do not run parallel as in the previous figures, which is indeed an indication of an interaction effect. In other words, the ‘gap’ between average citizen satisfaction scores increases when expectations are higher. Satisfaction increases greatly with a combination of high expectations and high performance.
Third, within the context of low expectations the differences between citizen satisfaction for the low and high performance conditions are not significant (see also ). This means that even if respondents were exposed to a high performance cue (i.e. clean street), which disconfirms the expectations statement, they give almost the same satisfaction rating as those who were exposed to the low performance cue (confirming expectations).
Table 5. Comparing expectations and performance ratings.
Comparing results across studies
Did participants adjust their levels of satisfaction according to the expectations statement and not the performance manipulation? To shed some light on this question, presents the subjective performance and expectations ratings for this experiment and the close replication (study 1).
Table 6. Comparing satisfaction ratings across studies.
We will now compare the patterns between studies 1 and 3, because they had the same manipulations but in reversed order. Regarding the performance ratings, these patterns are fairly similar. As expected, across the two experiments, groups 1 and 3 are not significantly different, and groups 2 and 4 are not different from each other. This follows the expected pattern meaning that studies 1 and 3 do not differ substantially with respect to patterns of relationships.
With regard to subjective expectations, study 1 follows the expected pattern: the low expectations groups (1 and 2) differ significantly from high expectations groups (3 and 4). However, study 3 shows a different pattern in terms of expectations ratings. The two low expectations groups (1 and 2) differ very slightly from one another, yet they differ substantially from the two high expectations groups. Interestingly, groups 3 and 4 – the high performance groups – differ significantly from each other as well.
Therefore, while the expectations statements were the same in both groups, the participants rated their expectations differently. Hence, this seems to indicate that people indeed adjust their expectations not only based on the information provided, but also based on the performance they have experienced – expectations are not static.
provides an overview of the satisfaction ratings across the three experiments.
shows that study 1 and 2 have a similar pattern, although study 2 evokes more extreme satisfaction ratings, as expected. Both studies failed to provide evidence for an interaction effect. Comparing study 1 with study 3 (the reverse-order replication) we again see evidence that people tend to align expectations and satisfaction, particularly in the case of high performance. For this purpose, let us compare groups 2 and 4 in study 1 and 3. Satisfaction ratings in study 3 are relatively low when expectations are low but performance is high (3.83 in S3 and 4.57 in S1). Satisfaction ratings in study 3 are relatively high when expectations are high and performance is high (5.71 in S3 and 4.92 in S1). Because performance ratings (see ) were similar in both studies, this seems to provide further evidence for our suspicion that people adjust their satisfaction rating to create consonance in their views. This finding will be further discussed in the next section.
Discussion of findings
Study 1 (close replication) by and large reproduced the results of Van Ryzin’s experiment: a direct effect of performance on satisfaction, but no interaction effect of performance with expectations, thereby ruling out disconfirmation. One subtle deviation, however, from Van Ryzin’s results in the exact replication is that we found a small but significant direct effect of expectations on citizen satisfaction – high expectations had a positive impact on satisfaction.
Study 2 led to similar but more pronounced findings. We found a very strong effect of performance on citizen satisfaction with a very high explained variance. Furthermore, the expectations manipulation also had a modest significant direct effect. Our expectation that the thought process needed for disconfirmation to occur is only elicited when expectations and performance are extremely different was not supported by our results. In contrast, they showed even stronger direct effects of performance and expectations, yet nevertheless, there was no evidence of disconfirmation.
Study 3 did not reproduce the findings of the original experiment. Instead of finding an interaction effect that pointed at disconfirmation, we found an interaction pattern that actually pointed to a consonance between expectations and satisfaction judgments. There are various possible explanations and our experiment does not provide any definitive answers. As such, we speculate on two psychological mechanisms that may be at play here below.
The first potential explanation is that this finding is an artefact of the question order. Survey question order is known to affect satisfaction ratings (Van de Walle and Van Ryzin Citation2011), which is likely to be due to a priming effect. Priming is based on an assumption that information obtained during one stage of a survey can inform responses to questions later on. In this sense, information gleaned from a survey question itself can influence the way citizens respond to subsequent questions (Yeric and Tood Citation1996). This is particularly true when measuring general attitudes towards public services, because the object that is evaluated is vague and respondents are looking for readily available information to base their answer on.
In a split-ballot experiment, Van de Walle and Van Ryzin (Citation2011) found that when questions about a specific service were asked before questions about overall service satisfaction, the overall satisfaction ratings were lower than when the question order was reversed. Likewise, when the expectations manipulation was provided after the street cleanliness manipulation, this ‘positive cue’ may have primed respondents to give higher satisfaction ratings.
Although it can certainly be argued that part of our findings in study 3 results from priming, this does not seem to explain that the interaction pattern changes. shows that expectations only inflate satisfaction ratings in combination with a high performance. If expectations would prime respondents, we would expect to see a more pronounced difference between the high and low expectations group regardless the level of performance.
A complementary theory that may explain this result is the existence of an anchoring effect.Footnote5 Compared with the priming effect, the anchoring effect provides a more substantive explanation for our findings. The underlying premise of anchoring effects is that, once an anchor is set, subsequent judgments tend to be biased around that anchor. The anchoring effect is one of the most robust cognitive heuristics uncovered to date and psychologists have found the existence of this effect across various settings, such as in probability estimation, legal judgments, and performance ratings (Furnham and Boo Citation2011).
Also, anchoring has been found to be involved in more associative, less thoughtful cognitive processes (Mussweiler and Strack Citation2001; Blankenship et al. Citation2008) particularly when people have little knowledge about a certain topic (Mussweiler and Strack Citation2000; Wegener et al. Citation2001, 67). To this end, expectations can provide an initial point of reference, or anchor, from which citizens can make future satisfaction judgments.
Before discussion the implication of this finding in the conclusion, we reflect upon some limitations of our replication study.
Replication and limitations
Replication is an important feature of scientific knowledge (e.g. Tsang and Kwan Citation1999; Schmidt Citation2009). In this article we showed how an exact replication helped to find support for the findings of the original experiment. Furthermore, our first conceptual replication showed that the findings by Van Ryzin held even when manipulations were changed. Because we used a different sample from the same population (US citizens), these replications served two important functions: controlling for sampling error and artefacts of the experiment (i.e. checking internal validity) (Schmidt Citation2009). However, our replication could verify the underlying hypothesis of the Van Ryzin experiment.
What does this teach us about the use and limitations of replications for advancing theories in public management research? We think replications not only contribute to the verification of a theory, but also can be used to push the development of theory. Our results suggest that a crucial part of the EDM – disconfirmation – may need rethinking and further testing.
First, we replicated a survey experiment that was well suited for the purposes of replication. The materials are readily available and it is relatively easy to collect new data using the same or slightly different materials. In contrast, there are many other cross-sectional (field) studies on the EDM that are less replicable (e.g. Roch and Poister Citation2006; Morgeson Citation2012). Further, replications of these studies are less feasible because they require more resources, cooperation of specific organizations, or have taken place in a highly context-dependent setting. These reasons probably apply to public management research more broadly. Some studies are harder to replicate than others, which limits the potential power of replication.
Second, one caveat is that some of the inherent limitations of the study that is being replicated are automatically exported to the replication study. For instance, Van Ryzin’s choice to manipulate expectancy by providing subjects with information that suggests performance will be low or high, introduces a degree of artificiality into the attitude formation process. Another way would be to only use an observational measure of expectations and only manipulate various levels of performance.
Finally, the primary intention of this study was to explore the internal validity of Van Ryzin’s (Citation2013) findings through a series of replications. However, out replication is less useful to test the external validity of the original experiment, for instance, we do not know if our findings hold in other cultural context or with other services. Interestingly, elsewhere in this special issue, Filtenborg, Gaardboe, and Sigsgaard-Ramussen (Citation2017Citation) carried out a replication testing the external validity of Van Ryzin’s experiment on a sample taken from a different population (Danish citizens) and two different services (schools and libraries). Filtenborg et al. reproduced Van Ryzin’s original findings, yet found a direct influence of expectations on satisfaction, which resonates with the findings in the experiments in this article. Overall, these converging findings highlight that Van Ryzin’s design has a high internal and external validity.
Conclusion
In this article, we sought causal evidence for the EDM by performing three replications of an experiment by Van Ryzin (Citation2013). We reproduced most of Van Ryzin’s findings using a different sample (study 1) and different manipulations (study 2). However, in none of our studies we found evidence of expectancy disconfirmation. In contrast, when manipulations were reversed, expectations seemed to amplify the effect of high performance (study 3). Thus, receiving an expectations cue in retrospect can alter how a previously experienced performance is rated by citizens. We speculate that the expectations statement is used as an anchor to interpret the prior performance of a government service.
This is an important finding because in reality, too, various cues influence expectations, performance, and satisfaction ratings, and not necessarily in a chronological order. Citizens may form expectations while simultaneously experiencing performance, or receive expectation cues after experiencing a certain performance. All of this influences citizen satisfaction judgments.
In sum, the EDM assumes citizens deliberately contrast their views of performance against their prior expectations. We were unable to find evidence of such disconfirmation in our three studies. These findings resonate with a recent critical empirical assessment of the EDM. Andersen and Hjortskov (Citation2016) suggest that the formation of a satisfaction judgment is not a cognitive-rational process, unlike what the EDM suggests. Therefore, more research on how cognitive processes and biases – such as the anchoring effect – affect citizen satisfaction may help us to gain a better understanding of this phenomenon.
What does our research imply for practice? First, those who want to raise satisfaction judgments are advised not to deliberately lower citizen expectations. This does not seem to be a useful strategy because there is no evidence that – in case of both low and high performance – results in higher satisfaction ratings. In contrast, raising the level of expectations may have an overall positive effect on the views of citizens on government.
Second, we suggest that policymakers and public managers think carefully about what measures citizen satisfaction mean to an effective performance management regime. The findings of this research empirically illustrate validity issues regarding satisfaction, by demonstrating that satisfaction, despite its popularity, can lead to an imperfect reflection of government performance. Indeed, building upon previous research, our findings demonstrate that satisfaction judgments are sometimes shaped by innate cognitive biases that can be triggered by simple statements anchoring citizen judgments.
Acknowledgements
The authors wish to thank Gregg Van Ryzin, two anonymous reviews, the special issue editors, and the participants of Panel E110 ‘Experiments, Replication and Knowledge in Public Management Research’ of the IRSPM 2016 Conference in Hong Kong for their useful comments and feedback on a prior version of this article.
Disclosure statement
No potential conflict of interest was reported by the authors.
Additional information
Funding
Notes on contributors
Stephan Grimmelikhuijsen
Stephan Grimmelikhuijsen is assistant professor at the Utrecht University School of Governance. His research interests include government and court transparency, citizen attitudes, legitimacy, experimental methods, and a behavioural approach to public administration. His work appeared in various journals, such as Journal of Public Administration and Theory, Public Administration Review, and Public Administration.
Gregory A. Porumbescu
Gregory A. Porumbescu is an assistant professor in the School of Public and Global Affairs at Northern Illinois University. His research interests relate to public sector transparency, e-government, and citizen perceptions of government. His work is forthcoming or appeared in Journal of Public Administration and Theory, Public Administration Review, American Review of Public Administration, Public Management Review, and Administration & Society.
Notes
1. We carried out an auxiliary analysis for the satisfaction ratings across groups in each study without using these filters yet the results were not substantively different.
2. Manipulation check succeeded. Test of difference in means study 1 (t = 14.52, df = 307, p < .001), study 2 (t = 10.09, df = 170, p < .001), study 3 (t = 9.23, df = 164, p < .001).
3. Manipulation check succeeded. Test of difference in means study 1 (t = 8.44, df = 307, p < .001), study 2 (t = 29.09, df = 171, p < .001), study 3 (t = 7.09, df = 165, p < .001).
4. ‘We are conducting an academic survey about a public policy. We need to understand your opinion about this policy. Select the link below to complete the survey. At the end of the survey, you will receive a code to paste into the box below to receive credit for taking our survey.
Make sure to leave this window open as you complete the survey. When you are finished, you will return to this page to paste the code into the box’.
5. James (Citation2009) also found some evidence for expectations anchoring, but this approach is different from the anchoring effect. According to James, expectations anchoring hypothesizes that satisfaction is directly influenced by expectations of the quality of services, separately from the influence of disconfirmation. This direct effect of expectations is also confirmed in our experiments.
References
- Andersen, S. C., and M. Hjortskov. 2016. “Cognitive Biases in Performance Evaluations.” Journal of Public Administration Research and Theory 26 (4): 647–662. doi: 10.1093/jopart/muv036
- Berinsky, A. J., G. A. Huber, and G. S. Lenz. 2012. “Evaluating Online Labor Markets for Experimental Research: Amazon.Com’s Mechanical Turk.” Political Analysis 20 (3): 351–368. doi:10.1093/pan/mpr057.
- Blankenship, K. L., D. T. Wegener, R. E. Petty, B. Detweiler-Bedell, and C. L. Macy. 2008. “Elaboration and Consequences of Anchored Estimates: An Attitudinal Perspective on Numerical Anchoring.” Journal of Experimental Social Psychology 44 (6): 1465–1476. doi:10.1016/j.jesp.2008.07.005.
- Faul, F., E. Erdfelder, A. Buchner, and A.-G. Lang. 2009. “Statistical Power Analyses Using G*Power 3.1: Tests for Correlation and Regression Analyses.” Behavior Research Methods 41: 1149–1160. doi:10.3758/BRM.41.4.1149.
- Faul, F., E. Erdfelder, A.-G. Lang, and A. Buchner. 2007. “G*Power 3: A Flexible Statistical Power Analysis Program for the Social, Behavioral, and Biomedical Sciences.” Behavior Research Methods 39: 175–191. doi:10.3758/BF03193146.
- Filtenborg, A. F., F. Gaardboe, and J. Sigsgaard-Rasmussen. 2017. “Experimental Replication: An Experimental Test of the Expectancy Disconfirmation Theory of Citizen Satisfaction.” Public Management Review. doi:10.1080/14719037.2017.1295099.
- Furnham, A., and H. C. Boo. 2011. “A Literature Review of the Anchoring Effect.” The Journal of Socio-Economics 40 (1): 35–42. doi:10.1016/j.socec.2010.10.008.
- James, O. 2009. “Evaluating the Expectations Disconfirmation and Expectations Anchoring Approaches to Citizen Satisfaction with Local Public Services.” Journal of Public Administration Research and Theory 19 (1): 107–123. doi:10.1093/jopart/mum034.
- James, O. 2011. “Managing Citizens’ Expectations of Public Service Performance: Evidence from Observation and Experimentation in Local Government.” Public Administration 89 (4): 1419–1435. doi:10.1111/padm.2011.89.issue-4.
- Mason, W., and S. Suri. 2012. “Conducting Behavioral Research on Amazon’s Mechanical Turk.” Behavior Research Methods 44 (1): 1–23. doi:10.3758/s13428-011-0124-6.
- Morgeson, F. V. 2012. “Expectations, Disconfirmation, and Citizen Satisfaction with the U.S. Federal Government: Testing and Expanding the Model.” Journal of Public Administration Research and Theory 23 (2): 289–305. doi:10.1093/jopart/mus012.
- Morgeson, F. V., and C. Petrescu. 2011. “Do They All Perform Alike? an Examination of Perceived Performance, Citizen Satisfaction and Trust with US Federal Agencies.” International Review of Administrative Sciences 77 (3): 451–479. doi:10.1177/0020852311407278.
- Morton, R. B., and K. C. Williams. 2010. Experimental Political Science. from the Nature to the Lab. Cambridge: Cambridge University Press.
- Mussweiler, T., and F. Strack. 2000. “Numeric Judgments under Uncertainty: The Role of Knowledge in Anchoring.” Journal of Experimental Social Psychology 36 (5): 495–518. doi:10.1006/jesp.1999.1414.
- Mussweiler, T., and F. Strack. 2001. “The Semantics of Anchoring.” Organizational Behavior and Human Decision Processes 86 (2): 234–255. doi:10.1006/obhd.2001.2954.
- Oliver, R. L. 1980. “A Cognitive Model of the Antecedents and Consequences of Satisfaction Decisions.” Journal of Marketing Research 42: 460–469. doi:10.2307/3150499.
- Oliver, R. L. 1997. Satisfaction: A Behavioral Perspective on the Consumer. New York: Irwin McGraw-Hill.
- Oliver, R. L., and W. S. DeSarbo. 1988. “Response Determinants in Satisfaction Judgments.” Journal of Consumer Research 14: 495–507. doi:10.1086/jcr.1988.14.issue-4.
- Oppenheimer, D. M., T. Meyvis, and N. Davidenko. 2009. “Instructional Manipulation Checks: Detecting Satisficing to Increase Statistical Power.” Journal of Experimental Social Psychology 45 (4): 867–872. doi:10.1016/j.jesp.2009.03.009.
- Poister, T. H., and J. C. Thomas. 2011. “The Effect of Expectations and Expectancy Confirmation/Disconfirmation on Motorists’ Satisfaction with State Highways.” Journal of Public Administration Research and Theory 21: 601–617. doi:10.1093/jopart/mur004.
- Roch, C. H., and T. H. Poister. 2006. “Citizens, Accountability, and Service Satisfaction: The Influence of Expectations.” Urban Affairs Review 41: 292–308. doi:10.1177/1078087405281124.
- Ross, J., L. Irani, M. Silberman, A. Zaldivar, and B. Tomlinson. 2010. “Who Are the Crowdworkers? Shifting Demographics in Mechanical Turk.” Conference on Human Factors in Computing Systems – Proceedings: 2863–2872.
- Schmidt, S. 2009. “Should We Really Do It Again? the Powerful Concept of Replication Is Neglected in the Social Sciences.” Review of General Psychology 13 (2): 90–100. doi:10.1037/a0015108.
- Tsang, E. W. K., and K.-M. Kwan. 1999. “Replication and Theory Development in Organizational Science: A Critical Realist Perspective.” Academy of Management Journal 24 (4): 759–780.
- Tversky, A., and D. Kahneman. 1974. “Judgment under Uncertainty: Heuristics and Biases.” Science 185 (4157): 1124–1131. doi:10.1126/science.185.4157.1124.
- Van de Walle, S., and G. G. Van Ryzin. 2011. “The Order of Questions in a Survey on Citizen Satisfaction with Public Services: Lessons from a Split-Ballot Experiment.” Public Administration 89 (4): 1436–1450. doi:10.1111/j.1467-9299.2011.01922.x.
- Van Ryzin, G. G. 2004. “Expectations, Performance, and Citizen Satisfaction with Urban Services.” Journal of Policy Analysis and Management 23 (3): 433–448. doi:10.1002/pam.20020.
- Van Ryzin, G. G. 2006. “Testing the Expectancy Disconfirmation Model of Citizen Satisfaction with Local Government.” Journal of Public Administration Research and Theory 16 (4): 599–611. doi:10.1093/jopart/mui058.
- Van Ryzin, G. G. 2013. “An Experimental Test of the Expectancy‐Disconfirmation Theory of Citizen Satisfaction.” Journal of Policy Analysis and Management 32 (3): 597–614. doi:10.1002/pam.2013.32.issue-3.
- Van Ryzin, G. G., S. Immarwahr, and S. Altman. 2008. “Measuring Street Cleanliness: A Comparison of New York City’s Scorecard and Results from A Citizen Survey.” Public Administration Review 68 (2): 295–303. doi:10.1111/j.1540-6210.2007.00863.x.
- Wegener, D. T., R. E. Petty, B. T. Detweiler-Bedell, W. Jarvis, and G. Blair. 2001. “Implications of Attitude Change Theories for Numerical Anchoring: Anchor Plausibility and the Limits of Anchor Effectiveness.” Journal of Experimental Social Psychology 37 (1): 62–69. doi:10.1006/jesp.2000.1431.
- Williamson, V. 2016. “On the Ethics of Crowdsourced Research.” Political Science & Politics 49 (1): 77–81. doi:10.1017/S104909651500116X.
- Yeric, J. L., and J. R. Tood. 1996. Public Opinion: The Visible Politics. Itasca, IL: F.E. Peacock.
APPENDIX:
EXPERIMENTAL MATERIALS
Step 1: introductory language (all studies)
Hometown is a medium-size US city with a growing population. Recently, Hometown’s city administrator made the following public statement about the current economic situation and the city’s budget difficulties:
Step 2: expectations manipulation
Low expectations statement (Study 1 and 3)
(MARCH 2016): My fellow citizens, Hometown is facing challenges as a result of the ongoing recession and a continuing decline in local tax revenues. The city has been forced all this year to make cuts across the board in order to balance our budget.
Unfortunately, these cuts will result in noticeable declines in the quality of many public services. The streets may not be as clean as you expect, potholes may not be fixed as fast as they should be, and many other city services will no longer meet our usual high standards. As a result of these budget cuts, the quality of life in Hometown will noticeably decline. I regret that we cannot maintain the quality of services that you expect of city government, but we all must make sacrifices during these difficult times and hope, together, for better days ahead.
High expectations statement (Study 1 and 3)
(MARCH 2016): My fellow citizens, Hometown is facing challenges as a result of the ongoing recession and a continuing decline in local tax revenues. The city has been forced all this year to make cuts across the board in order to balance our budget.
Fortunately, the necessary cuts we have made will not reduce the quality of public services. Indeed, the city will find a way to make sure that the streets stay as clean as you expect them to be, that potholes continue to be fixed as fast as they should be, and that all city services will be maintained at our usual high standards. Our quality of life will remain as high as it has always been.
I promise you that we will continue to deliver the high-quality public services that you expect of city government, and that we will find a way, together, to do more with less during these difficult times.
Extremely low expectations statement (Study 2)*
(MARCH 2016): My fellow citizens, Hometown is facing challenges as a result of the ongoing recession and a continuing decline in local tax revenues. The city has been forced all this year to make cuts across the board in order to balance our budget.
Unfortunately, these cuts will result in highly noticeable declines in the quality of all public services. The streets will definitely become less clean, we will stop fixing potholes, and most other city services will no longer meet our usual high standards. As a result of these budget cuts, the quality of life in Hometown will decline drastically. I regret that we cannot maintain the quality of services that you expect of city government, but we all must make sacrifices during these difficult times and hope, together, for better days ahead.
Extremely high expectations statement (Study 2)*
(MARCH 2016): My fellow citizens, Hometown is facing challenges as a result of the ongoing recession and a continuing decline in local tax revenues. The city has been forced all this year to make cuts across the board in order to balance our budget.
Fortunately, the necessary cuts we have made will not reduce the quality of public services. In contrast, the city will find a way to make sure that the streets will be cleaner than ever before, that street maintenance will go up and prevent potholes, and that all city services will be maintained at our usual high standards. Our quality of life will not just be maintained, but we want to see the quality of life in our town increase. I promise you that we will continue to deliver the high-quality public services that you expect of city government, and that we will find a way, together, to do more with less during these difficult times.
* Underlined phrases have been adapted from original wording to create more extreme expectations.
Step 3: performance manipulation**
The picture below shows the cleanliness of a typical street in Hometown. Please look at the picture, then answer the questions below.
‘Extremely low’ performance photograph of city cleanliness
Low performance photograph of city cleanliness
High performance photograph of city cleanliness
‘Extremely high’ performance photograph of city cleanliness
** Step 2 and 3 were reversed in Study 3
Experimental manipulations and the NYC scorecard for street cleanliness (based on Van Ryzin, Immarwahr, and Altman Citation2008)