?Mathematical formulae have been encoded as MathML and are displayed in this HTML version using MathJax in order to improve their display. Uncheck the box to turn MathJax off. This feature requires Javascript. Click on a formula to zoom.
ABSTRACT
Measures of individual mobility, such as activity space, have been previously used to help improve our understanding of individuals’ interactions with their everyday environments. However, such methods have rarely been adopted in studying children's physical activity and active travel behavior. In this study, we use a combination of participatory mapping and accelerometer data collected from children aged 8–13 years living in Tāmaki Makaurau/Auckland, Aotearoa/New Zealand, to describe children's travel behavior and explore associations of active travel, physical activity, and socio-demographic characteristics with environmental attributes. The results from this study reveal complex associations between these different layers. Density of cycling routes was consistently associated with higher levels of physical activity captured via moderate-to-vigorous physical activity (MVPA), prevalence of active travel, and total activity space exposure. Nevertheless, population density, greenspace, and land-use mix revealed varying associations across different activity behaviors including MVPA, number of steps, and prevalence of active travel. The results from this study not only reassert the complexity of person–environment relationships, but also highlight the potential impacts of measurement and analytical methods on the study results. The novel combination of participatory mapping and accelerometer data together with activity space analysis provided new analytical insights which we discuss in this paper. This study concludes by reporting its observations and envisioning future research directions.
1. Introduction
A growing body of evidence has shown that physical activity (PA) can have significant impacts on various aspects of children's health (WHO Citation2020). PA guidelines of accumulating the average of 60 min of moderate-to-vigorous physical activity (MVPA) daily have been associated with reduced risk factors for cardiovascular disease and type 2 diabetes, improved bone and mental health, and maintenance of a healthy weight in children (WHO Citation2020). Active travel is a form of PA and is associated with higher rates of MVPA and improved health outcomes (Tribby et al. Citation2017). Active travel refers to any human-powered transportation such as walking, bicycling, and scootering and it has been previously shown to be associated with higher PA levels among children hence resulting in health benefits (Jones et al. Citation2019; Cooper et al. Citation2006; Borghese and Janssen Citation2018). Despite the many benefits of active travel, its prevalence is low in developed countries including Aotearoa New Zealand (Smith et al. Citation2019b).
Engagement in PA and active travel can be explained by multilevel interactions between individuals, social and cultural environments, physical (i.e. built and natural) environments, and policies (Mitra Citation2013). Among these, the physical environment is increasingly recognized as having an important role in supporting or hindering PA and active travel across various age groups (Kajosaari et al. Citation2021; Laatikainen, Broberg, and Kyttä Citation2017). This is especially relevant to children whose opportunities for PA and active travel may more directly depend on readily available amenities (Villanueva et al. Citation2012; Loebach and Gilliland Citation2016a; Smith et al. Citation2020a). Some consistent relationships have been observed, despite a largely heterogeneous evidence base. Residing in more ‘walkable’ physical environments, with characteristics such as higher population/dwelling density, intersection density/street connectivity, and land-use mix (LUM) has been associated with higher children's physical activity and active travel (Pan et al. Citation2021; Dixon et al. Citation2021; Ikeda et al. Citation2018b). Availability of and access to amenities such as safe places to walk or cycle, and recreation settings such as parks and playgrounds are also important (Pan et al. Citation2021; Davison and Lawson Citation2006; Smith et al. Citation2017). The importance of green space for children's PA is an emerging area of research and an increasing amount of evidence shows the importance of greenspace for supporting children's activity (Ward et al. Citation2016; Lachowycz et al. Citation2012). However, inconsistent findings have been observed to date and there is some suggestion that greenspace quality and characteristics also play a role (Benjamin-Neelon et al. Citation2019; Ikeda et al. Citation2018b).
Most previous research has focused on home and school neighborhoods as representations of the immediate environment where children's PA, active travel and independent mobility typically occur (Smith et al. Citation2017; Loebach and Gilliland Citation2016b). This article builds upon the argument that a key reason for the considerable heterogeneity in the evidence base linking children's PA and their environments is due to measurement differences in studies (Smith et al. Citation2021). Measurement differences exist across all aspects of research, including how PA environments are conceptualized (e.g. areas around the home or school environment, administrative units, or individual-centric approaches) and measured (e.g. estimated using geographic information systems [GIS], child or parent reports, or objective monitoring using global positioning systems [GPS]), and what activity behavior is being assessed (e.g. active travel, total PA). Although to date no agreed-upon best practice exists, there are increasing calls for improved sensitivity and specificity in the evidence base by using PA behavior-specific and population-specific measures (Giles-Corti et al. Citation2009), and individual-centric approaches that might more accurately capture environmental exposures than researcher-estimated environments (Smith et al. Citation2021).
An ongoing challenge related to the spatial analysis of such association is the Uncertain Geographic Context Problem (UGCoP), whereby estimated neighborhood delineations (and thus exposures generated) may not reflect an individual's actual environmental exposures (Kwan Citation2012). The use of administrative units as the spatial unit of analysis is an example of such ill-fitting delineations which are increasingly criticized in the literature (Hasanzadeh, Laatikainen, and Kyttä Citation2018). To tackle the UGCoP issue, modern research favors ego-centric units of analysis such as activity spaces (Sharp and Kimbro Citation2021). The activity space (AS) concept has been widely used as a measure of individual mobility by researchers from a range of fields. Given their broad application, ASs have been widely used in empirical research to evaluate various aspects of person-environment relationships. Nevertheless, they have rarely been incorporated in studies of children's mobility (Smith et al. Citation2021). Given the promising performance of AS models in capturing mobility behavior and place exposure in various age groups (Laatikainen, Hasanzadeh, and Kyttä Citation2018), this study aims to contribute new knowledge to the evidence base by generating children's AS, exploring its characteristics, and evaluating differences in associations between children's ASs and their PA and active travel.
PPGIS methodology including softGIS and VERITAS has been increasingly utilized in studies with children and youth to capture ‘individual-centric’ environmental exposure (Broberg and Sarjala Citation2015; Kyttä, Broberg, and Kahila Citation2012; Stewart et al. Citation2015; Smith et al. Citation2021). However, few studies have used PPGIS data to derive measures of AS and environmental exposure with children (Smith et al. Citation2021). In a study conducted in Helsinki, Finland, Kyttä, Broberg, and Kahila (Citation2012) generated measures for children's places of importance using PPGIS. However, they did not use these places to delineate neighborhood boundaries, instead using a 500 m network buffer around residential locations. According to the authors, this was a major limitation as only 53% of meaningful places marked by children were within this distance from home. Villanueva et al. (Citation2012) used data on places of importance to generate egocentric neighborhood delineations by making a minimum convex polygon from children's home and actively reached local destinations. AS size was associated with confidence to travel independently and sex differences in relationships were observed.
The paucity of literature using PPGIS with children limits any clear comparability with other measurement approaches. A scoping review of associations between children's PA and environments using GIS suggested some common relationships exist across literature using PPGIS, GPS, and GIS; specifically consistent positive relationships were found between children's PA and destination accessibility, street connectivity, and population density (Smith et al. Citation2022). Considerable differences were also observed; however, it is unclear whether this was due to the measurement approach (i.e. PPGIS vs. other approaches) or the measures assessed, or other differences in study characteristics.
Studies measuring school routes suggest meaningful differences in environmental characteristics captured when using different approaches. Ikeda et al. (Citation2018a) compared children's drawn routes to school using PPGIS with GIS-derived shortest distance to school using both street and pedestrian networks. Findings showed significant differences in numerous built environment attributes using the different route calculation methods, and varying degrees of overlap in areas measured. Similarly, environmental characteristics differed in children's GPS and GIS-derived school routes in the study of Dessing et al. (Citation2016). Of note, differences in findings across measurement approaches have also been observed by children's travel mode (Moran, Eizenberg, and Plaut Citation2017; Ikeda et al. Citation2018a; Dessing et al. Citation2016). One study reported greater accuracy in child-drawn routes to school (Moran, Eizenberg, and Plaut Citation2017), and another reported a higher confidence in, and likelihood of, completing mapping tasks (Oliver et al. Citation2016; Ikeda et al. Citation2018a) in children who actively traveled to school compared with those who were driven.
Motivated by the existing limitation in how children's mobilities including PA and active travel are analyzed and understood in the literature, this study pursued three aims. First, this study took a new analytical approach to model and understand the individualized AS of children in a major urban city using PPGIS data. The PPGIS data were collected from children aged approximately 8–13 years living in Tāmaki Makaurau Auckland, Aotearoa New Zealand (NZ). Second, this study analyzed AS data to capture both the physical and built environment characteristics of the everyday environments and to explore their associations with sociodemographic and PA characteristics of children. This is complemented with additional PA data collected through accelerometers which not only widened the insight, but also facilitated the third aim, which was to evaluate and discuss the effectiveness of accelerometer based and PPGIS/AS-derived measures of activity.
1.1. Activity space as the spatial unit of analysis
AS can be defined as a set of geographical locations that individuals connect with over the course of their everyday life. Buffers of various shapes and radii, and container geometries such as minimum convex polygons and deviational ellipses are some of the best-known examples of AS delineations in research (Hasanzadeh, Broberg, and Kyttä Citation2017). Over the last decade, advanced AS modeling methods have also captured the purpose, timing, and intensity of an individual's daily travels (D. Wang, Li, and Chai Citation2012; Hasanzadeh, Laatikainen, and Kyttä Citation2018). These approaches are based on the understanding that the spatial units of analysis should be specific to individuals (Hasanzadeh, Broberg, and Kyttä Citation2017), unlike static buffers which are often uniformly applied to all individuals (Kyttä et al. Citation2015).
Places and daily movements, or space in general, are heterogonous between individuals and complex in nature, which should be considered in AS modeling (Wei et al. Citation2018). An example of such methods, the individualized residential exposure model (IREM) was adopted in this study (Hasanzadeh, Laatikainen, and Kyttä Citation2018). IREM enables delineating and capturing the relevant geographical context for analysis based on exposure values which are estimated based on the unique mobility patterns of an individual. This not only provides a more realistic spatial unit of analysis, but also a more refined picture of an individual's PA and active travel (Hasanzadeh, Laatikainen, and Kyttä Citation2018). Compared to other advanced AS models such as the context-based Crystal-Growth model (Wang, Kwan, and Chai Citation2018), IREM provides a good balance of complexity and accuracy which also suits sparse spatial datasets such as those collected through participatory mapping methods (Hasanzadeh, Laatikainen, and Kyttä Citation2018).
It is worth noting that ASs do not replace spatial data such as GPS but instead can be a product of them. Historically AS has been modeled using a mobile phone (Zhao et al. Citation2016) and GPS tracking data (Villanueva et al. Citation2012), but the use of PPGIS for mapping activity spaces and assessing exposure has also been gradually increasing over the past few years (Hasanzadeh Citation2021). Compared to GPS data in which actual exposure is measured objectively, PPGIS uses a self-report approach to collect and assess spatial and temporal information on an individual's neighborhood exposure. ASs have been used as a spatial unit of analysis to simply serve as a container to carry out environmental measurements in GIS (Ramezani et al. Citation2019), or more sophisticatedly as proxy measures capturing the levels and extents of active or motorized travel (Hasanzadeh et al. Citation2019). The application of AS in this study serves both purposes.
2. Methodology
2.1. Data
Data were derived from the Neighborhoods for Active Kids study, which has been described in detail elsewhere (Oliver et al. Citation2016). A brief overview of the study methods and detail regarding the measures specific to the current study are provided here.
Data were collected through an online mapping survey using softGIS methodology. SoftGIS is a PPGIS method that combines Internet maps with traditional questionnaires (Brown and Kyttä Citation2014). The result is geocoded qualitative and quantitative data that can be analyzed with GIS.
2.1.1. Participants and setting
Neighborhoods for Active Kids was conducted in Tāmaki Makaurau Auckland in NZ. The overall study aim was to identify relationships between children's health behaviors and their neighborhood environments. Nine intermediate (junior high, years 7–8) schools were selected for invitation based on a matrix of area-level socio-economic status, child-specific destination accessibility (Badland et al. Citation2015), and child-specific walkability (Giles-Corti et al. Citation2011). For each intermediate school, a contributing primary (elementary) school in the same neighborhood was also invited to participate. Children in school years 5–8 (approximate ages 8–13 years) were invited with the aim of recruiting approximately 65 children across each neighborhood. Participation required informed consent from the school principal and a parent/caregiver, and assent from the child. Ethical approval to conduct the research was provided by the host institution ethics committees (AUTEC 14/263 3/9/2014, MUHECN 3/9/2014, UAHPEC-019985 9/9/2014).
2.1.2. Protocol
Data were collected at schools, during school time. Trained researchers worked individually with each participant to complete the study protocol, which included fitting of an accelerometer and instructions on wearing the device; measurement of height, weight, and waist circumference; and completion of an online PPGIS survey. Parents/caregivers completed a computer-aided telephone interview (CATI) with trained CATI researchers.
2.1.3. Measures
Spatial information was retrieved from the neighborhood mapping component within the PPGIS survey. Spatial locations of each destination marked for each individual were extracted and used together with travel behavior information to generate the AS measurements (described in 2.2).
Travel behavior was assessed in two ways. Firstly, children were asked to self-report their usual mode of travel to school in the online PPGIS survey with the item ‘How do you usually get to school?’ Response options were: walk; bike; scooter (non-motorized); public bus, train or ferry; car, motorbike, scooter or taxi; or another way (e.g. skateboard). Walking, biking, skateboard, or non-motorized scooter was categorized as ‘Active Travel to School.’ Secondly, children completed a neighborhood mapping exercise in the PPGIS survey where they were asked to mark the places (other than their school) in and around their neighborhood that they go to. For each destination marked, children were also asked to indicate the usual mode of travel to that destination. ‘Active travel to destinations’ was defined as usually walking, biking, or scootering (non-motorized) to the marked destination.
Physical activity was measured using Actigraph GT3X+ accelerometers worn on a belt at the waist during waking hours for seven consecutive days (excluding water-based activities) (Jarrett, Fitzgerald, and Routen Citation2015). Specifications included a 30 Hz sampling rate and all download options marked. Evenson et al. (Citation2008) count thresholds were used to determine PA intensity; blocks of ≥60 min of consecutive zero counts were considered non-wear time (Oliver et al. Citation2011); thereafter, participants with at least three days of data with at least seven hours of data on each day were included in analyses (Mattocks et al. Citation2008). Variables used for the current study were number of steps and proportion of wear time spent in moderate-to-vigorous physical activity (MVPA).
Socio-demographic information was captured from the parent/caregiver CATI and included child's ethnicity (categorized as Māori, Pacific, New Zealand European/Pākehā, Asian, Middle Eastern/Latin American/African [MELAA], or ‘other’) (Statistics New Zealand Citation2005), sex of child (female/male), school year, parent/caregiver current employment situation (generalized to unemployed, part-time or casual work, and full-time employment) and parent/caregiver highest educational qualification (finished primary school, finished high school, University Entrance/Bursary/Scholarship (or equivalent), Apprenticeship, diploma, or trade certificate, Bachelor degree or higher). Both the education and employment measures were treated as ordinal values in the analysis.
Weather information (daily precipitation, hours of daylight, minimum and maximum temperature) was downloaded from the New Zealand meteorological service (cliflo.niwa.co.nz). Daily weather data were matched for each individual to their days of PA measurement. Given the weather conditions at the time of year when data were collected, models were adjusted for average minimum temperature and average rainfall to account for possible effects on the level of activity.
2.2. AS measurements
ASs were modeled using an individualized exposure-based model (Hasanzadeh, Laatikainen, and Kyttä Citation2018). In this model, exposures are estimated based on everyday locations (i.e. home and destinations), travel routes, modes, and frequency (Hasanzadeh, Laatikainen, and Kyttä Citation2018). According to this model, an AS comprising frequent travels made using active travel modes has higher exposure than an AS comprising fewer travels driven by motorized travel modes. The modeling was done using a python script (Hasanzadeh Citation2018). When actual travel route data were available, they were used in the modeling. In other cases, the travel route was estimated using the shortest path based on the indicated travel mode and using Open Street Map route data (2020). For ease of analysis, areas of high exposure were extracted and delineated from the raster files based on the median of individual exposure values (Laatikainen, Hasanzadeh, and Kyttä Citation2018). This is referred to as the AS throughout this study. An example of the AS model created for an individual and more details on the modeling process are provided in the Appendix.
Space and environmental exposure variables adopted from previous studies were calculated for each AS (). Additionally, the AS polygons were used as the spatial unit of analysis to calculate the built environment measures. All GIS analyses in this paper were conducted using python scripts and ArcGIS Pro 2.5.
Table 1. AS based variables used in the study.
2.3. Statistical analysis
The associations of AS and environmental exposure measures with built environment measures, sociodemographic characteristics, and travel behavior (including neighborhood destinations and travel to school) were investigated using six hierarchical linear models with random effects at school level. Similarly, the associations between PA variables and AS, built environment, and sociodemographic characteristics were explored using four hierarchical linear models with random effects at three levels: neighborhood, school, and day of data collection (weekday vs weekend). The PA models were additionally controlled for weather conditions using data on average rainfall and average minimum temperature at the time of data collection. A significance level was set at .05. All statistical analyses in this study were conducted with IBM SPSS 27. For all models, multicollinearity was assessed using the variance inflation factor (VIF) and tolerance values.
3. Results
3.1. Participants
In total, 1102 children participated in the study. The geographical distribution of home locations in the study area as well as the detailed characteristics of participants are provided as supplementary materials.
3.2. Associations of AS and exposure with built environment, sociodemographic characteristics, and travel behavior
presents the results from the six hierarchical linear models, each made for one of the AS measures.
Table 2. HLM results – AS.
A higher population density was associated with a more compact and less intense activity space, i.e. generally smaller and with lower exposure. In other words, children living in densely populated areas were more likely to do most of their activities around their home and have a smaller average exposure to their everyday environment. At the same time, a higher availability of green spaces in the AS was associated with increased total exposure.
A higher density of cycling routes was associated with an increase in the overall extents of mobility. Children whose ASs demonstrated a dense cycling network were more likely to have polycentric activity spaces and travel further from home. In contrast, intersection density was negatively associated with the AS variables related to the extent and dispersion. ASs located in areas with a high density of intersections in the street network were more likely to be compact and monocentric.
Children who more frequently used walking to reach their daily destinations were more likely to have a compact AS. In contrast, high car usage as the travel mode was associated with larger, more polycentric AS. Children who more often used bicycle as their mode of transport were more likely to have monocentric activity spaces.
3.3. Associations of PA and active travel with AS and sociodemographic characteristics
presents the results from the four hierarchical linear models, each made for one of the PA measures.
Table 3. HLM results – PA.
Population density was negatively associated with all PA measures suggesting that children in denser areas were generally less active. The amount of green areas within the AS was positively associated with number of steps and MVPA, but negatively associated with the use of active travel modes to reach destinations. In areas with a higher density of cycling routes, children were more likely to use walking and cycling as their mode of travel and have a higher MVPA. LUM was positively associated with higher use of active travel modes.
There were also statistically significant associations between the PA measures and some of the socio-demographic variables. For example, being older was associated with higher step counts and being male was positively associated with all three PA measures. Additionally, compared to the NZ European ethnic group, being of Asian or Māori ethnicity was associated with being less active according to some of the measures. Being of Māori ethnicity was associated with less active travel to school. Similarly, being of Asian ethnicity was negatively associated with MVPA and share of active travel to school.
4. Discussion
4.1. Individualized ASs for studying children's mobility and PA
In this study, we used an exposure-based AS model, namely IREM (Hasanzadeh, Laatikainen, and Kyttä Citation2018) to model and analyze the individual activity and travel behavior of children. As reviewed in an earlier study (Smith et al. Citation2021), such approaches have been rare in children's PA studies leaving research gaps in how we conceptualize, operationalize, and scrutinize children's ASs.
Using the individual AS models, we made two sets of GIS measurements which enabled the statistical analysis conducted in the following step pursuing the second objective of this study. The first set of measurements focused on the space and environmental exposure of individuals. The measures in this category enabled us to capture the extent and magnitude of mobility in a quantitative and individually sensitive way. The second set of measures focused on the physical and environmental characteristics of the children's everyday environments. Based on evidence from previous studies (Laatikainen, Hasanzadeh, and Kyttä Citation2018; Kwan Citation2012), the use of an individualized AS model for this purpose helped mitigate the effects of UGCoP in the analysis.
4.2. ASs and associations with personal and environmental characteristics
Results showed that population density had an inverse association with ‘how active’ the AS is. In other words, in more densely populated areas children generally had less exposure to their environment. That could be the result of less frequent travels and/or higher use of motorized travel modes. This pattern was even more consistent in the second set of hierarchical linear models where activity measures were used as the outcome variable. This somewhat counterintuitive negative relationship was also reported in an earlier study (Ikeda et al. Citation2018b). Exploratory work by Ikeda et al. (Citation2018b) showed that a possible level of interaction between dwelling density and distance to school, with a combination of lower housing density and shorter distance to schools, is linked with active travel to school.
At the same time, the amount of greenspace was almost consistently positively associated with different activity measures. Individuals with higher amounts of greenspace available within their AS generally had higher MVPA, number of steps, and total amount of environmental exposure. This is in line with previous studies reporting associations between green areas and PA (Ward et al. Citation2016; Benjamin-Neelon et al. Citation2019). Conversely, the amount of greenspace was negatively associated with the share of use of active travel for reaching school. This can be due to an increased sense of unsafety which has previously been shown to impede active travel among children (Smith et al. Citation2020b). Further, this contrast may be attributable to how children accumulate their activity. While the overall activity can include play, sports, or walking and cycling for leisure, active travel is specific to walking and cycling between destinations. It is worth noting that this negative association contradicts most of the findings from studies of adults (Ramezani et al. Citation2019). This may suggest significant differences on how exposure to similar built environment characteristics can affect children compared with other age groups. Children, especially those who are transported by their parents (Herrador-Colmenero, Villa-González, and Chillón Citation2017), might have less autonomy over travel routes and hence factors such as esthetics may have less impact on children's choice of route. Understanding such mechanisms may significantly deepen our understanding of travel behavior in children. This demonstrates the importance of conducting child-specific research rather than extrapolating adult findings to children.
The density of cycling routes available within the AS was positively associated with PA and active travel. This is consistent with previous findings that a better availability of cycling infrastructure is associated with increased PA and active travel (Pan et al. Citation2021; Ramezani et al. Citation2021). At the same time, density of cycling routes was positively associated with polycentricity and elongation of ASs. This is interestingly in contrast with what we would expect from adults as a better availability of cycling routes may encourage higher use of active travel modes and hence result in a more compact activity space (Ramezani et al. Citation2021). Among children, a better availability of cycling routes may increase accessibility and increase the geographical extents of active travel.
It is noteworthy that the prevalence of children cycling in New Zealand is low (i.e. six percent based on the New Zealand Household Travel Survey) (Smith et al. Citation2019b). Moreover, the availability of child-friendly cycling infrastructure was extremely low across Auckland at the time of data collection. Earlier examinations in the Neighborhoods for Active Kids study revealed parental license for independent mobility was negatively associated with cycling infrastructure and positively associated with parent-reported need for safer places to cycle (Smith et al. Citation2019a). Hypotheses for these somewhat counterintuitive findings were that parents who allow their children greater independence also have a greater awareness of their traffic environments, and a preference for allowing walking more than cycling in children due to inadequate infrastructure. The results suggest that a large polycentric AS can result from increased active mobility opportunities for children, but also can be driven by motorized travel. Hence, measures of AS dispersion alone cannot yield conclusive results regarding active travel in children.
There were associations between the physical structure of ASs and some of the built environment and PA variables. Intersection density was found to be positively associated with active travel to destinations. This is consistent with previous research (Ikeda et al. Citation2018b; Jia et al. Citation2021b), solidifying the case for the important role of connected streets in supporting resident active travel behaviors in the neighborhoods. In more densely populated areas with a higher density of intersections, children's ASs were more monocentric, meaning that destinations were concentrated around a fewer number of clusters. This is in line with a number of empirical studies from various age groups reporting the presence of more compact ASs in areas of higher density largely due to the fact that points of interest and amenities are generally located closer to individuals’ homes (Hasanzadeh et al. Citation2021). Given that monocentricity of AS was associated with more active travel, this may be interpreted as a desirable outcome of urban planning ideals, such as a compact or walkable city (Ramezani et al. Citation2021). At the same time, LUM was positively associated with polycentricity. This could mean that a more diverse land use was associated with a more geographically diverse AS among the participants.
LUM was positively associated with most of the AS and activity measures. This suggests that ASs located in areas with more land-use diversity, and therefore more diverse destination possibilities, generally comprise more frequent and more active travel. This is in line with many previous studies reporting a positive link between LUM and children's PA level (Jia et al. Citation2021a). Nevertheless, similar to what is seen in the literature (Jia et al. Citation2021a), the associations found with LUM were not consistent across all PA measures. According to our results, while LUM was positively associated with active travel to school, a negative association emerged with active travel to destinations. Neighborhoods with land-use diversity in which people perform various activities are likely to facilitate safety and opportunities for children to be active, and facilitate social interactions (Smith et al. Citation2019a; Bahadure Citation2012). A previous New Zealand study showed that children (aged 8–13 years) of parents who perceived their neighborhood as more cohesive and connected had higher levels of independent mobility (Lin et al. Citation2017), which is positively associated with children's active travel and PA (Marzi, Demetriou, and Reimers Citation2018). It is worth mentioning that the observed discrepancy can be due to measurement differences in both the activities and the LUM itself. As previously reported in a number of studies, the way LUM is measured can affect the findings (Mavoa et al. Citation2018; Song, Merlin, and Rodriguez Citation2013; Duncan et al. Citation2010).
Among the sociodemographic variables, gender and age seem to be most relevant to PA and are consistent with previous research (Smith et al. Citation2018). Potential ethnic inequities also exist, with New Zealand Europeans having higher PA and active travel than other ethnic groups.
4.3. Measurement methods and potential effects on results
Results show that different measures of activity derived from PPGIS and AS models or accelerometer data may affect findings. While generally congruent, the associations yielded from different sets of activity measures were not always consistent. For example, active travel as measured directly from the survey (‘to school’) or retrieved from travels mapped in the survey (‘to destinations’) revealed considerably different and even contrasting associations. LUM revealed strong and positive associations with activity measures derived from ASs whereas its associations with accelerometer-measured MVPA were statistically insignificant. Further, the AS measure of the average exposure was positively associated with accelerometer-measured steps and MVPA but did not always result in the same kind of associations with other variables.
There are two ways to interpret such discrepancies: the differences may be originated from measurement biases and inaccuracies, or different measures may be capturing different things. We suggest it can be both. Active travel and PA are related concepts, but they are not the same. Additionally, active travel and PA have different aspects which may be captured through different measures (Laatikainen, Hasanzadeh, and Kyttä Citation2018). Thus, differences in results may not necessarily be due to inconsistency or inaccuracy but it could merely be because they are capturing different aspects of the same phenomenon or some closely related phenomena (Davis et al. Citation2021). Nevertheless, these findings warrant further investigation. In the meantime, it is important to acknowledge that our findings can be impacted by the choice of data and measurement of variables.
4.4. Contributions, limitations, and future study
This study took a fresh methodological approach to study the PA and active travel as well as their personal and environmental associates among children aged 8–13 years living in Tāmaki Makaurau/Auckland. To the authors’ best of knowledge, this was a first example of how an exposure-based AS model can be used to study PA in this age group. As discussed above, the combination of AS analysis and accelerometer data led to empirical findings shedding new light on the complicated associations between the physical environment and the PA and relevance of active travel in this age group and study area. Further, by taking this dual approach this study tried to draw scholarly attention to the impacts of data and measurement choices on empirical findings by discussing the results in light of two different analytical methods. However, this is a one-case observation and a more conclusive result would require a more systematic and comprehensive approach.
There are also other limitations in this study that need to be discussed and addressed in future research. Firstly, and most importantly, this study used cross-sectional data, meaning that the causality of relationships might not be confidently determined. Further, as a common limitation of all data collected through map-based surveys including PPGIS, individual differences in engagement in mapping among participants as well as differences in their level of mapping skills, may have introduced some biases to the study (Brown Citation2016). Additionally, self-reported bias, social desirability bias, and recall bias are particularly relevant to this data collection method. While involving children in determining neighborhood environment measures through mapping activities can be time-consuming and susceptible to self-report errors (Stewart et al. Citation2017), these approaches can provide detailed insights in ways that estimated measures cannot (Smith et al. Citation2021). There is a need to advance these techniques and the evidence base through considering relative importance and role of key destinations in children's lives.
To our knowledge, this was the first study to employ PPGIS with children as young as eight years old. Accordingly, the protocol was pilot tested with a class of children prior to field implementation. A number of adaptations were made to the protocol including the need for one-to-one assistance with the PPGIS survey completion (Oliver et al. Citation2016). Accordingly, these potential biases may have been mitigated through in-depth researcher support. There are also limitations related to the AS modeling implemented in this study. The model used in this study does not consider the temporal aspect of mobility. The absence of the temporal aspect from the model is largely due to the data constraints. To this point, time has not been successfully integrated with PPGIS data (Hasanzadeh Citation2021; Fagerholm et al. Citation2021).
Additional research in diverse populations is essential to move the field forward, alongside longitudinal approaches to determine causality, and with clear reporting of methods to improve the evidence base (e.g. using the ISLE-REST statement (Jia et al. Citation2020). Improved confidence in the measures generated could be achieved through simultaneous use of GPS, accelerometry, and PPGIS. Approaches that have not yet been explored include having participants cross-check/validate generated ASs. This could be achieved through providing generated ASs and bringing them back to participants. As spatial modeling approaches and technology advances, ASs could be generated in real time during the PPGIS mapping process, enabling children to cross-check/validate maps during the data collection process.
CCHG_2039901_Supplementary
Download MS Word (118.4 KB)Acknowledgements
KH is supported by Academy of Finland as part of PLANhealth Project (13297753). KH would also like to acknowledge FinEst (H2020 grant 856602) for supporting this study. SM was supported by an Australian National Health and Medical Research Council Early Career Fellowship (#1121035) and a University of Melbourne Faculty of Medicine, Dentistry and Health Sciences Research Fellowship. EI is supported by the Medical Research Council [MC_UU_12015/7, MC_UU_00006/5]. MS is supported by a Health Research Council of New Zealand Sir Charles Hercus Research Fellowship (Grant number 17/013). Neighbourhoods for Active Kids was funded by the Health Research Council of New Zealand (grant number 14/436). Authors would like to acknowledge prof. Marketta Kyttä her contribution to this research.
Disclosure statement
No potential conflict of interest was reported by the author(s).
Additional information
Funding
References
- Badland, Hannah, Phil Donovan, Suzanne Mavoa, Melody Oliver, Moushumi Chaudhury, and Karen Witten. 2015. “Assessing Neighbourhood Destination Access for Children: Development of the NDAI-C Audit Tool.” Environment and Planning B: Planning and Design 42 (6): 1148–1160. doi:10.1068/b140009p.
- Bahadure, Sarika. 2012. “Social Sustainability and Mixed Landuse, Case Study of Neighborhoods in Nagpur, India.” Bonfring International Journal of Industrial Engineering and Management Science 2 (4): 76–83. doi:10.9756/bijiems.1744.
- Benjamin-Neelon, Sara E., Alyssa Platt, Montserrat Bacardi-Gascon, Sarah Armstrong, Brian Neelon, and Arturo Jimenez-Cruz. 2019. “Greenspace, Physical Activity, and BMI in Children from Two Cities in Northern Mexico.” Preventive Medicine Reports 14 (June): 100870. doi:10.1016/j.pmedr.2019.100870.
- Borghese, Michael M., and Ian Janssen. 2018. “Development of a Measurement Approach to Assess Time Children Participate in Organized Sport, Active Travel, Outdoor Active Play, and Curriculum-Based Physical Activity.” BMC Public Health 18 (1): 1–10. doi:10.1186/S12889-018-5268-1/TABLES/2.
- Broberg, Anna, and Satu Sarjala. 2015. “School Travel Mode Choice and the Characteristics of the Urban Built Environment: The Case of Helsinki, Finland.” Transport Policy 37: 1–10. doi:10.1016/j.tranpol.2014.10.011.
- Brown, Greg. 2016. “A Review of Sampling Effects and Response Bias in Internet Participatory Mapping (PPGIS/PGIS/VGI).” Transactions in GIS 2016. doi:10.1111/tgis.12207.
- Brown, Greg, and Marketta Kyttä. 2014. “Key Issues and Research Priorities for Public Participation GIS (PPGIS): A Synthesis Based on Empirical Research.” Applied Geography 46: 126–136. doi:10.1016/j.apgeog.2013.11.004.
- Cooper, Ashley R., Niels Wedderkopp, Han Wang, Lars Bo Andersen, Karsten Froberg, and Angie S. Page. 2006. “Active Travel to School and Cardiovascular Fitness in Danish Children and Adolescents.” Medicine and Science in Sports and Exercise 38 (10): 1724–1731. doi:10.1249/01.MSS.0000229570.02037.1D.
- Davis, Zoë, Martin Guhn, Ingrid Jarvis, Michael Jerrett, Lorien Nesbitt, Tim Oberlander, Hind Sbihi, Jason Su, and Matilda van den Bosch. 2021. “The Association Between Natural Environments and Childhood Mental Health and Development: A Systematic Review and Assessment of Different Exposure Measurements.” International Journal of Hygiene and Environmental Health 235 (June): 113767. doi:10.1016/j.ijheh.2021.113767.
- Davison, Kirsten Krahnstoever, and Catherine T. Lawson. 2006. “Do Attributes in the Physical Environment Influence Children’s Physical Activity? A Review of the Literature.” International Journal of Behavioral Nutrition and Physical Activity 3 (1): 1–17. doi:10.1186/1479-5868-3-19.
- Dessing, Dirk, Sanne I. de Vries, Geertje Hegeman, Evert Verhagen, Willem van Mechelen, and Frank H. Pierik. 2016. “Children’s Route Choice During Active Transportation to School: Difference Between Shortest and Actual Route.” International Journal of Behavioral Nutrition and Physical Activity 13 (1): 1–11. doi:10.1186/S12966-016-0373-Y/TABLES/6.
- Dixon, Brittney N., Umelo A. Ugwoaba, Andrea N. Brockmann, and Kathryn M. Ross. 2021. “Associations Between the Built Environment and Dietary Intake, Physical Activity, and Obesity: A Scoping Review of Reviews.” Obesity Reviews 22 (4): e13171. doi:10.1111/obr.13171.
- Duncan, Mitch J., Elisabeth Winkler, Takemi Sugiyama, Ester Cerin, Lorinne Dutoit, Eva Leslie, and Neville Owen. 2010. “Relationships of Land Use Mix with Walking for Transport: Do Land Uses and Geographical Scale Matter?” Journal of Urban Health 87 (5): 782–795. doi:10.1007/s11524-010-9488-7.
- Evenson, Kelly R., Diane J. Catellier, Karminder Gill, Kristin S. Ondrak, and Robert G. McMurray. 2008. “Calibration of Two Objective Measures of Physical Activity for Children.” Journal of Sports Sciences 26 (14): 1557–1565. doi:10.1080/02640410802334196.
- Fagerholm, Nora, Christopher M Raymond, Anton Stahl Olafsson, Gregory Brown, Tiina Rinne, Kamyar Hasanzadeh, Anna Broberg, and Marketta Kyttä. 2021. “A Methodological Framework for Analysis of Participatory Mapping Data in Research, Planning, and Management.” International Journal of Geographical Information Science 35 (9): 1848–1875. doi:10.1080/13658816.2020.1869747.
- Frank, Lawrence D., Thomas L. Schmid, James F. Sallis, James Chapman, and Brian E. Saelens. 2005. “Linking Objectively Measured Physical Activity with Objectively Measured Urban Form: Findings from SMARTRAQ.” In American Journal of Preventive Medicine. https://doi.org/10.1016/j.amepre.2004.11.001.
- Giles-Corti, Billie, Sally F. Kelty, Stephen R. Zubrick, and Karen P. Villanueva. 2009. “Encouraging Walking for Transport and Physical Activity in Children and Adolescents: How Important Is the Built Environment?” Sports Medicine 39 (12): 995–1009. doi:10.2165/11319620-000000000-00000/FIGURES/2.
- Giles-Corti, Billie, Gina Wood, Terri Pikora, Vincent Learnihan, Max Bulsara, Kimberly Van Niel, Anna Timperio, Gavin McCormack, and Karen Villanueva. 2011. “School Site and the Potential to Walk to School: The Impact of Street Connectivity and Traffic Exposure in School Neighborhoods.” Health and Place 17 (2): 545–550. doi:10.1016/j.healthplace.2010.12.011.
- Hasanzadeh, Kamyar. 2018. “IASM: Individualized Activity Space Modeler.” SoftwareX 7: 138–142. doi:10.1016/j.softx.2018.04.005.
- Hasanzadeh, Kamyar. 2019. “Exploring Centricity of Activity Spaces: From Measurement to the Identification of Personal and Environmental Factors.” Travel Behaviour and Society 14: 57–65. doi:10.1016/j.tbs.2018.10.001.
- Hasanzadeh, Kamyar. 2021. “Use of Participatory Mapping Approaches for Activity Space Studies: A Brief Overview of Pros and Cons.” GeoJournal 60: 1366. doi:10.1007/s10708-021-10489-0.
- Hasanzadeh, Kamyar, Anna Broberg, and Marketta Kyttä. 2017. “Where is My Neighborhood? A Dynamic Individual-Based Definition of Home Ranges and Implementation of Multiple Evaluation Criteria.” Applied Geography 84: 1–10. doi:10.1016/j.apgeog.2017.04.006.
- Hasanzadeh, Kamyar, Michal Czepkiewicz, Jukka Heinonen, Marketta Kyttä, Sanna Ala-Mantila, and Juudit Ottelin. 2019. “Beyond Geometries of Activity Spaces: A Holistic Study of Daily Travel Patterns, Individual Characteristics, and Perceived Wellbeing in Helsinki Metropolitan Area.” Journal of Transport and Land Use 12 (1). doi:10.5198/jtlu.2019.1148.
- Hasanzadeh, Kamyar, Marketta Kyttä, Johanna Lilius, Samira Ramezani, and Tiina Rinne. 2021. “Centricity and Multi-Locality of Activity Spaces: The Varying Ways Young and Old Adults Use Neighborhoods and Extra-Neighborhood Spaces in Helsinki Metropolitan Area.” Cities 110: 103062. doi:10.1016/j.cities.2020.103062.
- Hasanzadeh, Kamyar, Tiina E. Laatikainen, and Marketta Kyttä. 2018. “A Place-Based Model of Local Activity Spaces: Individual Place Exposure and Characteristics.” Journal of Geographical Systems 20 (3): 227. doi:10.1007/s10109-017-0264-z.
- Herrador-Colmenero, Manuel, Emilio Villa-González, and Palma Chillón. 2017. “Children Who Commute to School Unaccompanied Have Greater Autonomy and Perceptions of Safety.” Acta Paediatrica, International Journal of Paediatrics 106 (12): 2042–2047. doi:10.1111/apa.14047.
- Ikeda, Erika, Suzanne Mavoa, Erica Hinckson, Karen Witten, Niamh Donnellan, and Melody Smith. 2018a. “Differences in Child-Drawn and GIS-Modelled Routes to School: Impact on Space and Exposure to the Built Environment in Auckland, New Zealand.” Journal of Transport Geography 71 (July): 103–115. doi:10.1016/J.JTRANGEO.2018.07.005.
- Ikeda, Erika, Tom Stewart, Nicholas Garrett, Victoria Egli, Sandra Mandic, Jamie Hosking, Karen Witten, et al. 2018b. “Built Environment Associates of Active School Travel in New Zealand Children and Youth: A Systematic Meta-Analysis Using Individual Participant Data.” Journal of Transport and Health 9: 117–131. doi:10.1016/j.jth.2018.04.007.
- Jarrett, Haydn, Liam Fitzgerald, and Ash C. Routen. 2015. “Interinstrument Reliability of the ActiGraph GT3X+ Ambulatory Activity Monitor During Free-Living Conditions in Adults.” Journal of Physical Activity and Health 12 (3): 382–387. doi:10.1123/jpah.2013-0070.
- Jia, Peng, Chao Yu, Justin V. Remais, Alfred Stein, Yu Liu, Ross C. Brownson, Jeroen Lakerveld, et al. 2020. “Spatial Lifecourse Epidemiology Reporting Standards (ISLE-ReSt) Statement.” Health and Place 61 (January): 102243. doi:10.1016/j.healthplace.2019.102243.
- Jia, Peng, Xiongfeng Pan, Fangchao Liu, Pan He, Weiwei Zhang, Li Liu, Yuxuan Zou, and Liding Chen. 2021a. “Land Use Mix in the Neighbourhood and Childhood Obesity.” Obesity Reviews 22: e13098. doi:10.1111/obr.13098.
- Jia, Peng, Yuxuan Zou, Zhifeng Wu, Dong Zhang, Tong Wu, Melody Smith, and Qian Xiao. 2021b. “Street Connectivity, Physical Activity, and Childhood Obesity: A Systematic Review and Meta-analysis.” Obesity Reviews 22 (S1): e12943. doi:10.1111/obr.12943.
- Jones, Rebecca A., Nicole E. Blackburn, Catherine Woods, Molly Byrne, Femke van Nassau, and Mark A. Tully. 2019. “Interventions Promoting Active Transport to School in Children: A Systematic Review and Meta-Analysis.” Preventive Medicine 123 (June): 232–241. doi:10.1016/J.YPMED.2019.03.030.
- Kajosaari, Anna, Sayyed M Haybatollahi, Kamyar Hasanzadeh, and Marketta Kyttä. 2021. “Examining the Effects of Residential Location and Stated Residential Preferences on Activity Space Size and Centricity.” Travel Behaviour and Society 23: 65–75. doi:10.1016/j.tbs.2020.11.002.
- Kwan, Mei-Po. 2012. “The Uncertain Geographic Context Problem.” Annals of the Association of American Geographers 102 (May 2015): 958–968. doi:10.1080/00045608.2012.687349.
- Kyttä, Marketta, Anna Broberg, Mohammad Haybatollahi, Kaisa Schmidt-Thomé, and K. Schmidt-Thome. 2015. “Urban Happiness: Context-Sensitive Study of the Social Sustainability of Urban Settings.” Environment and Planning B: Planning and Design 43 (1): 34–57. doi:10.1177/0265813515600121.
- Kyttä, Marketta, Anna K Broberg, and Maarit Kahila. 2012. “Urban Environment and Children’s Active Lifestyle: SoftGIS Revealing Children’s Behavioral Patterns and Meaningful Places.” American Journal of Health Promotion: AJHP 26 (5): e137–e148. doi:10.4278/ajhp.100914-QUAN-310.
- Kyttä, Marketta, Melody Oliver, Erika Ikeda, Ehsan Ahmadi, Ichiro Omiya, and Tiina Laatikainen. 2018. “Children as Urbanites: Mapping the Affordances and Behavior Settings of Urban Environments for Finnish and Japanese Children.” Children’s Geographies 16 (3): 319–332. doi:10.1080/14733285.2018.1453923.
- Laatikainen, Tiina E., Anna Broberg, and Marketta Kyttä. 2017. “The Physical Environment of Positive Places: Exploring Differences Between Age Groups.” Preventive Medicine 95 (February): S85–S91. doi:10.1016/J.YPMED.2016.11.015.
- Laatikainen, Tiina E., Kamyar Hasanzadeh, and Marketta Kyttä. 2018. “Capturing Exposure in Environmental Health Research: Challenges and Opportunities of Different Activity Space Models.” International Journal of Health Geographics 17 (1): 29. doi:10.1186/s12942-018-0149-5.
- Lachowycz, Kate, Andy P. Jones, Angie S. Page, Benedict W. Wheeler, and Ashley R. Cooper. 2012. “What Can Global Positioning Systems Tell Us About the Contribution of Different Types of Urban Greenspace to Children’s Physical Activity?” Health and Place 18 (3): 586–594. doi:10.1016/j.healthplace.2012.01.006.
- Lin, En Yi, Karen Witten, Melody Smith, Penelope Carroll, Lanuola Asiasiga, Hannah Badland, and Karl Parker. 2017. “Social and Built-Environment Factors Related to Children’s Independent Mobility: The Importance of Neighbourhood Cohesion and Connectedness.” Health and Place 46 (July): 107–113. doi:10.1016/j.healthplace.2017.05.002.
- Loebach, Janet, and Jason Gilliland. 2016a. “Neighbourhood Play on the Endangered List: Examining Patterns in Children’s Local Activity and Mobility Using GPS Monitoring and Qualitative GIS.” Children’s Geographies 14 (5): 573–589. doi:10.1080/14733285.2016.1140126.
- Loebach, Janet, and Jason A. Gilliland. 2016b. “Free Range Kids? Using GPS-Derived Activity Spaces to Examine Children’s Neighborhood Activity and Mobility.” Environment and Behavior 48 (3): 421–453. doi:10.1177/0013916514543177.
- Lord, Sébastien, Florent Joerin, and Marius Thériault. 2009. “La Mobilité Quotidienne de Banlieusards Vieillissants et Âgés: Déplacements, Aspirations et Significations de La Mobilité.” Canadian Geographer / Le Géographe Canadien 53 (3): 357–375. doi:10.1111/j.1541-0064.2009.00269.x.
- Marzi, Isabel, Yolanda Demetriou, and Anne Kerstin Reimers. 2018. “Social and Physical Environmental Correlates of Independent Mobility in Children: A Systematic Review Taking Sex/Gender Differences Into Account.” International Journal of Health Geographics 17 (1): 1–17. doi:10.1186/s12942-018-0145-9.
- Mattocks, Calum, Andy Ness, Sam Leary, Kate Tilling, Steven N. Blair, Julian Shield, Kevin Deere, et al. 2008. “Use of Accelerometers in a Large Field-Based Study of Children: Protocols, Design Issues, and Effects on Precision.” Journal of Physical Activity and Health 5 (s1): 98–111. doi:10.1123/jpah.5.s1.s98.
- Mavoa, Suzanne, Claire Boulangé, Serryn Eagleson, Joshua Stewart, Hannah M. Badland, Billie Giles-Corti, and Lucy Gunn. 2018. “Identifying Appropriate Land-Use Mix Measures for Use in a National Walkability Index.” Journal of Transport and Land Use 11 (1): 681–700. doi:10.5198/jtlu.2018.1132.
- Mitra, Raktim. 2013. “Independent Mobility and Mode Choice for School Transportation: A Review and Framework for Future Research.” Transport Reviews 33 (1): 21–43. doi:10.1080/01441647.2012.743490.
- Moran, Mika R., Efrat Eizenberg, and Pnina Plaut. 2017. “Getting to Know a Place: Built Environment Walkability and Children’s Spatial Representation of Their Home-School (h–s) Route.” International Journal of Environmental Research and Public Health 2017 Vol. 14 Page 607 14 (6): 607. doi:10.3390/IJERPH14060607.
- Oliver, Melody, Hannah M. Badland, Grant M. Schofield, and Janine Shepherd. 2011. “Identification of Accelerometer Nonwear Time and Sedentary Behavior.” Research Quarterly for Exercise and Sport 82 (4): 779–783. doi:10.1080/02701367.2011.10599814.
- Oliver, Melody, Julia McPhee, Penelope Carroll, Erika Ikeda, Suzanne Mavoa, Lisa Mackay, Robin A Kearns, e tal. 2016. “Neighbourhoods for Active Kids: Study Protocol for a Cross-Sectional Examination of Neighbourhood Features and Children's Physical activity, Active Travel, Independent Mobility and Body Size.” BMJ Open 6 (8): e013377. doi:10.1136/bmjopen-2016-013377.
- Pan, Xiongfeng, Li Zhao, Jiayou Luo, Yinhao Li, Lin Zhang, Tong Wu, Melody Smith, Shaoqing Dai, and Peng Jia. 2021. “Access to Bike Lanes and Childhood Obesity: A Systematic Review and Meta-Analysis.” Obesity Reviews 22 (S1): e13042. doi:10.1111/obr.13042.
- Ramezani, Samira, Kamyar Hasanzadeh, Tiina Rinne, Anna Kajosaari, and Marketta Kyttä. 2021. “Residential Relocation and Travel Behavior Change: Investigating the Effects of Changes in the Built Environment, Activity Space Dispersion, Car and Bike Ownership, and Travel Attitudes.” Transportation Research Part A: Policy and Practice 147: 28–48. doi:10.1016/j.tra.2021.02.016.
- Ramezani, Samira, Tiina Laatikainen, Kamyar Hasanzadeh, and Marketta Kyttä. 2019. “Shopping Trip Mode Choice of Older Adults: An Application of Activity Space and Hybrid Choice Models in Understanding the Effects of Built Environment and Personal Goals.” Transportation 48 (2): 1–32. doi:10.1007/s11116-019-10065-z.
- Sallis, James F, Ester Cerin, Terry L Conway, Marc A Adams, Lawrence D Frank, Michael Pratt, Deborah Salvo, et al. 2016. “Physical Activity in Relation to Urban Environments in 14 Cities Worldwide: A Cross-Sectional Study.” The Lancet 387 (10034): 2207–2217. doi:10.1016/S0140-6736(15)01284-2.
- Sharp, Gregory, and Rachel Tolbert Kimbro. 2021. “Neighborhood Social Environments, Healthy Resources, and Adult Diabetes: Accounting for Activity Space Exposures.” Health and Place 67 (January): 102473. doi:10.1016/j.healthplace.2020.102473.
- Smith, Melody, Rebecca Amann, Alana Cavadino, Deborah Raphael, Robin Kearns, Roger Mackett, Lisa Mackay, et al. 2019a. “Children’s Transport Built Environments: A Mixed Methods Study of Associations between Perceived and Objective Measures and Relationships with Parent Licence for Independent Mobility in Auckland, New Zealand.” International Journal of Environmental Research and Public Health 16 (8): 1361. doi:10.3390/ijerph16081361.
- Smith, Melody, Jianqiang Cui, Erika Ikeda, Suzanne Mavoa, Kamyar Hasanzadeh, Jinfeng Zhao, Tiina E Rinne, Niamh Donnellan, and Marketta Kyttä. 2021. “Objective Measurement of Children's Physical Activity Geographies: A Systematic Search and Scoping Review.” Health & Place 67: 102489. doi:10.1016/j.healthplace.2020.102489.
- Smith, Melody, Jamie Hosking, Alistair Woodward, Karen Witten, Alexandra MacMillan, Adrian Field, Peter Baas, and Hamish Mackie. 2017. “Systematic literature review of built environment effects on physical activity and active transport – an update and new findings on health equity.” International Journal of Behavioral Nutrition and Physical Activity 14 (1). doi:10.1186/s12966-017-0613-9.
- Smith, Melody, Erika Ikeda, Scott Duncan, Ralph Maddison, Erica Hinckson, Kim Meredith-Jones, Caroline Walker, and Sandra Mandic. 2019b. “Trends and Measurement Issues for Active Transportation in New Zealand's Physical Activity Report Cards for Children and Youth.” Journal of Transport & Health 15: 100789. doi:10.1016/j.jth.2019.100789.
- Smith, Melody, Erika Ikeda, Greer Hawley, Suzanne Mavoa, Jamie Hosking, Victoria Egli, Jinfeng Zhao, et al. 2020a. “An Integrated Conceptual Model of Environmental Needs for New Zealand Children's Active Travel to School.” Journal of Transport & Health 16: 100814. doi:10.1016/j.jth.2019.100814.
- Smith, Melody, Erika Ikeda, Greer Hawley, Suzanne Mavoa, Jamie Hosking, Victoria Egli, Jinfeng Zhao, et al. 2020b. “An Integrated Conceptual Model of Environmental Needs for New Zealand Children’s Active Travel to School: Environmental Needs for Active School Travel.” Journal of Transport and Health 16: 100814. doi:10.1016/j.jth.2019.100814.
- Smith, Melody, Erika Ikeda, Erica Hinckson, Scott Duncan, Ralph Maddison, Kim Meredith-Jones, Caroline Walker, and Sandra Mandic. 2018. “Results from New Zealand’s 2018 Report Card on Physical Activity for Children and Youth.” Journal of Physical Activity and Health 15 (s2): S390–S392. doi:10.1123/jpah.2018-0463.
- Smith, Melody, Suzanne Mavoa, Erika Ikeda, Kamyar Hasanzadeh, Jinfeng Zhao, Tiina E Rinne, Niamh Donnellan, Marketta Kyttä, and Jianqiang Cui. 2022. “Associations between Children’s Physical Activity and Neighborhood Environments Using GIS: A Secondary Analysis from a Systematic Scoping Review.” International Journal of Environmental Research and Public Health 19 (3): 1033. doi:10.3390/ijerph19031033.
- Song, Yan, Louis Merlin, and Daniel Rodriguez. 2013. “Comparing Measures of Urban Land Use Mix.” Computers, Environment and Urban Systems 42: 1–13. doi:10.1016/j.compenvurbsys.2013.08.001.
- Statistics New Zealand. 2005. “Statistical Standard for Ethnicity.” Wellington, New Zealand.
- Stewart, Tom, Scott Duncan, Basile Chaix, Yan Kestens, Jasper Schipperijn, and Grant Schofield. 2015. “A Novel Assessment of Adolescent Mobility: A Pilot Study.” International Journal of Behavioral Nutrition and Physical Activity 12 (1): 1–11. doi:10.1186/s12966-015-0176-6.
- Stewart, Tom, Jasper Schipperijn, Bernhard Snizek, and Scott Duncan. 2017. “Adolescent School Travel: Is Online Mapping a Practical Alternative to GPS-Assessed Travel Routes?” Journal of Transport and Health 5: 113–122. doi:10.1016/j.jth.2016.10.001.
- Tribby, Calvin P., Harvey J. Miller, Barbara B. Brown, Ken R. Smith, and Carol M. Werner. 2017. “Geographic Regions for Assessing Built Environmental Correlates with Walking Trips: A Comparison Using Different Metrics and Model Designs.” Health and Place 45: 1. doi:10.1016/j.healthplace.2017.02.004.
- Villanueva, Karen, Billie Giles-Corti, Max Bulsara, Gavin R. McCormack, Anna Timperio, Nick Middleton, Bridget Beesley, and Georgina Trapp. 2012. “How Far Do Children Travel from Their Homes? Exploring Children’s Activity Spaces in Their Neighborhood.” Health and Place 18 (2): 263–273. doi:10.1016/j.healthplace.2011.09.019.
- Wang, Jue, Mei-Po Kwan, and Yanwei Chai. 2018. “An Innovative Context-Based Crystal-Growth Activity Space Method for Environmental Exposure Assessment: A Study Using GIS and GPS Trajectory Data Collected in Chicago.” International Journal of Environmental Research and Public Health 15 (4): 703. doi:10.3390/ijerph15040703.
- Wang, Donggen, Fei Li, and Yanwei Chai. 2012. “Activity Spaces and Sociospatial Segregation in Beijing.” Urban Geography 33 (2): 256–277. doi:10.2747/0272-3638.33.2.256.
- Ward, Jonathan S., J. Scott Duncan, Aaron Jarden, and Tom Stewart. 2016. “The Impact of Children’s Exposure to Greenspace on Physical Activity, Cognitive Development, Emotional Wellbeing, and Ability to Appraise Risk.” Health and Place 40 (July): 44–50. doi:10.1016/j.healthplace.2016.04.015.
- Wei, Qiujun, Jiangfeng She, Shuhua Zhang, and Jinsong Ma. 2018. “Using Individual Gps Trajectories to Explore Foodscape Exposure: A Case Study in Beijing Metropolitan Area.” International Journal of Environmental Research and Public Health 15 (3): 405. doi:10.3390/ijerph15030405.
- WHO. 2020. “WHO Guidelines on Physical Activity and Sedentary Behaviour: Web Annex Evidence Profiles.” 2020. https://www.who.int/publications/i/item/9789240015111.
- Zhao, Ziliang, Shih-Lung Shaw, Yang Xu, Feng Lu, Jie Chen, and Ling Yin. 2016. “Understanding the Bias of Call Detail Records in Human Mobility Research.” International Journal of Geographical Information Science 30 (9): 1738–1762. doi:10.1080/13658816.2015.1137298.
Appendix: Activity space modeling
The exposure-based model was created using the following steps:
Figure A1. AS modeling process.
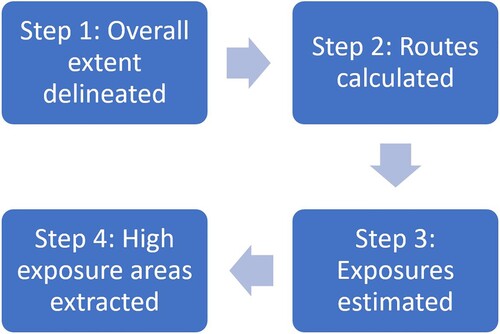
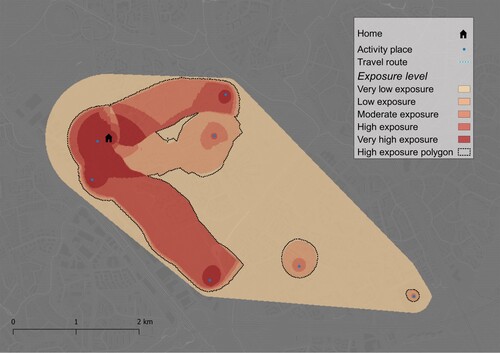
Step 1: The initial extent of activity space was defined using a convex polygon enclosing home location, activity places, and routes.
Step 2: Where actual routes were not present in the data for an individual, shortest path between each participant's home location and destination was estimated using network analysis while considering the reported mode of transportation in the survey.
Step 3: In this step the place exposures were estimated. To quantify the level of exposure, weights were assigned to each feature (home, activity point, and travel route). The weights for point features were calculated in terms of frequency of visit per month. A weight for each path was determined by its frequency of use and the used travel mode. This was operationalized as the geometric mean of destination and origin weights divided by the ratio of transportation mode's speed to walking speed. The average speed for each transportation mode was obtained from local transportation authorities. It should be noted that the transit timetables were not considered in calculation of transportation mode speeds.
Step 4: Areas of high exposure were extracted from overall activity space and used as the main activity space used in this study. High exposure areas delineated from the raster files based on the median of individual exposure values for each individual (high exposure: exposure in pixel > median of exposure in all pixels for the individual).
Figure A2. An exemplary individual AS modeled by IREM (Hasanzadeh, Laatikainen, and Kyttä Citation2018; Laatikainen, Hasanzadeh, and Kyttä Citation2018).