
ABSTRACT
Understanding the location of schools relative to the population they serve is important to contextualise the time, students must travel and to define school catchment areas (SCAs) for planning. We assembled a spatio-temporal database of public primary schools (PPS), population density of school-going children (SGC), and factors affecting travel in 2009 and 2020 in Kenya. We combined the assembled datasets within cost distance and cost allocation algorithms to compute travel time to the nearest PPS and define SCAs. We elucidated travel time and marginalised SGC living outside 24-minutes, government's threshold at sub-county level (decision-making units). Weassembled 2170 PPS in 2009 and 4682 in 2020, an increase of 115.8%, while the average travel time reduced from 28 to 17 minutes between 2009 and 2020. Nationally, 65% of SGC were within 24-minutes’ catchment in 2009, which increased to 89% in 2020. Subnationally, 19 and 61 out of 62 sub-counties had over 75% of SGC within the same threshold, in 2009 and 2020, respectively. Findings can be used to target the marginalised SGC, and monitor progress towards attainment of national and Sustainable Development Goals. The framework can be applied in other contexts to assemble geocoded school lists, characterise travel time and model SCA.
Background
Education and geographical access
Education is an important metric of national economic and social development and a pathway to improved health outcomes (Marmot et al. Citation2008; Lutz, Cuaresma, and Sanderson Citation2008; Graetz et al. Citation2018). The national and international communities have set goals and milestones to increase educational attainment. The Millennium Development Goals focused mainly on expanding primary education by 2015, while the current Sustainable Development Goals (SDGs) emphasise reducing inequalities in school access by 2030 (Friedman et al. Citation2020). Through concerted efforts, the net enrolment rate in primary school education increased globally from 82% in 1990 to 91% in 2018 (World Bank Citation2021). Historically, high-income countries have had higher net enrolment rate (94.8% in 1990 to 96.3% in 2018) than low-income countries (47% in 1990 to 81% in 2018). Globally and relative to other regions, Sub-Saharan Africa (SSA) remains most disadvantaged over time, with a net enrolment rate of 53% in 1990 and 78% in 2018 (World Bank Citation2021), and its primary school completion rates at 67% in 2018.
In SSA, poor enrolment and education attainment can be ascribed to many factors which vary between and within countries. Some of the factors include distance (or travel time) to school, household wealth, affordability, parents’ past education experience and travel cost (Lavy Citation1996; Porter et al. Citation2010a; Porter et al. Citation2010b; Siiba Citation2020; Afoakwah and Koomson Citation2021; Ngware and Mutisya Citation2021). Among these factors, particularly for primary school-going children, a significant concern is the travel time between their households and the location of the primary school (Lavy Citation1996; Afoakwah and Koomson Citation2021; Rodriguez-Segura and Kim Citation2021; Ngware and Mutisya Citation2021). Many children continue to travel long distances, which has been associated with poor schooling and learning outcomes because children are more likely to miss part of the daily instructions, announcements, and other academic activities (Lavy Citation1996; Cattaneo, Oggenfuss, and Wolter Citation2017; Afoakwah and Koomson Citation2021). This is especially important in SSA, where most children walk to school due to poverty and lack of motorised alternatives (Porter et al. Citation2010a; Porter et al. Citation2010b; Poku-Boansi, Amoako, and Atuah Citation2019; Siiba Citation2020). Therefore, better geographic access to primary schools has been an overarching goal in SSA. However, a prerequisite for defining geographic accessibility is the availability of an updated and geocoded master school list for the country of interest.
Master school lists
A master school list is a geo-database of educational, demographic, and socio-economic data for schools to facilitate planning and decision-making usually created through a mapping exercise (Attfield et al. Citation1999; Mulaku and Nyadimo Citation2011). At a minimum, the school database should contain the school’s location, capacity, amenities, number of students by gender and number of teachers alongside their qualifications. However, additional spatial layers of the road network, topography, economic and administrative data are required (Mulaku and Nyadimo Citation2011). Evaluating these databases within a geospatial information system (GIS), decision-makers and stakeholders can plan to rehabilitate or expand existing schools, construct new or merge existing schools guided by the population dynamics or plan for additional teachers and other resources. Additionally, essential insights that can be generated to enhance timely decision-making include how far children travel to reach a school from their homes, availability of electricity, toilet and clean water within a school or availability of health services within recommended radius of a school (Attfield et al. Citation1999).
Given the importance of such databases and accrued benefits of geospatial analysis, school mapping dates to the 1960s in Africa (Theunynck Citation2009). Some of the SSA countries where a form of school mapping has been conducted include Ethiopia (Attfield et al. Citation1999), Kenya (Mulaku and Nyadimo Citation2011), Tanzania (Alegana et al. Citation2021), Rwanda and South Africa (Rodriguez-Segura and Kim Citation2021), and Nigeria and Sierra Leone (GRID3 Citation2021). However, countries often have several school lists created by different agencies and not harmonised over time. Various organisations usually host these unharmonised lists, partially geocoded or lacking geographic coordinates and containing different attributes. Critically evaluating the fidelity of these databases while harmonising their differences into a single temporal master list is essential to any analysis, the resulting findings, and the implications for education policy. Such a database is the fundamental starting point for any geographic accessibility analysis for educational planning.
Modelling travel time
Defining travel time to school is essential in highlighting areas and school-going children (SGC) who are marginalised and need prioritisation during policy making, resource allocation and distribution. This aligns with SDGs fundamental principle of leaving no one behind and reaching the furthest behind, first (Stuart and Woodroffe Citation2016). Despite an increasing number of applications in health geography to understand spatial access to health services (Makanga Citation2021), there have been only a few attempts to define travel time to school and use of GIS for education in SSA including Sierra Leone, Nigeria, Ghana, Tanzania, Malawi and South Africa (Porter et al. Citation2010a; Porter et al. Citation2010b; Chacha and Bwire Citation2013; De Kadt et al. Citation2014; Poku-Boansi, Amoako, and Atuah Citation2019; Siiba Citation2020; GRID3 Citation2021; Mackintosh et al. Citation2020). Determining travel times to schools is not only important for understanding marginalisation but can also be used as a starting point to increase enrolment rates, educational attainment and learning outcomes in SSA (Lehman Citation2013; Afoakwah and Koomson Citation2021). This is particularly important for girls who are disproportionately affected due to security concerns posed by long distances to schools located outside their communities (GoK/MoE Citation2018). Further, long distances pose additional challenges for children with disabilities. Taken together, all of these factors underscore the need to assess and update the spatial accessibility of schools continually.
Various approaches can be used to compute travel time or distance. They range from simple methods such as Euclidean distance to complex methods such as cost distance algorithms (Ouma et al. Citation2021). While the simple approaches are easy to understand, implement and explain to stakeholders, they generalise and ignore factors that influence the journey to a school. Most of the previous studies on school access have used Euclidean distances (Lehman Citation2013; Rodriguez-Segura and Kim Citation2021), which is questionable since children’s travel can significantly deviate from the trajectory of a straight line. A child’s travel route to school is complex, influenced by socio-economic factors, facilitators of movement such as tracks and roads, and obstacles. Therefore, travel time analysis should aim for ‘near to reality travel times’ if they are to be beneficial to policymakers (Banke-Thomas et al. Citation2021).
Policy relevant thresholds
A travel time threshold (or norm) is the maximum travel time considered the ‘acceptable physical access’ to a school for a child; areas outside the defined threshold are considered physically marginalised from the school (Gould Citation1978; Theunynck Citation2009; Rodriguez-Segura and Kim Citation2021). The universal goal is to have schools located as close as possible to children’s homes, and if possible, within the village where the children reside (Theunynck Citation2009). The travel time thresholds have been used primarily in low-resource settings to guide infrastructure and resource allocation and facilitate equitable physical access. They have been used to define school catchment areas (SCAs) that form the basis of establishing new schools or expanding existing ones alongside other factors (Theunynck Citation2009).
There are no global benchmarks or thresholds for the maximum distance or travel time children should travel to access a primary school (Mackintosh et al. Citation2020). A radius of 3 kilometres (km) from home has been proposed (Gould Citation1978; Theunynck Citation2009). However, the threshold cannot be applied uniformly across SSA as a blanket cut off given the variations in population distribution, context, geography, infrastructure, and resources. Further, there is a perception that 3 km is too far for a child to walk (Rodriguez-Segura and Kim Citation2021). Thresholds of 5 km have been used in Mali (Lehman Citation2013) and Sierra Leone (Mackintosh et al. Citation2020), while 2 km radius has been applied in Nigeria (GRID3 Citation2021). In Kenya, The Ministry of Education aims to have a school within 2 km walking distance of every household (GoK/MoE Citation2018).
Objective
Kenya lacks a unified temporal master school list with all essential attributes. However, inconsistent lists are neither comparable nor easily accessible. They are maintained by different organisations, limiting their usefulness for decision-based planning, promoting equitable access, and tracking development goals. Further, no studies have explored the differences in geographical accessibility over time or evaluated the progress towards attaining recommended travel time thresholds in Kenya.
To address these issues and generate useful information for planning, we aim to assemble existing lists of primary schools between 2009 and 2020 and create a temporal and unique geocoded database of all public primary schools (PPS) and extend this database by linking it to spatial data layers known to affect travel between households and schools. These include road network, land use and cover, elevation, and travel barriers (major rivers, water bodies, game parks and reserves) to model travel time, assess progress, and derive SCAs for planning and highlighting areas and SGC that have been marginalised in the last decade. Specifically, we use these spatial data layers in a cost distance algorithm to define travel time to the nearest PPS, and compute the number of SGC who reside beyond the recommended policy threshold from school, based on SCAs derived through a cost allocation algorithm.
Study area
The study area comprises eight of Kenya’s 47 subnational units (counties) located in Western Kenya at the shores of Lake Victoria neighbouring Uganda and Tanzania (). The counties form the subnational government following the promulgation of a new constitution in 2010 that introduced a devolved system of government (GoK Citation2010). These eight counties are further subdivided into 62 sub-counties that are used by policymakers to plan, allocate, and distribute resources within counties. The region was chosen because of its high population density of 560 people per square km relative to Kenya’s average of 82 people per square km in 2019 (KNBS Citation2020). Secondly, regular school surveys have been conducted in this region contributing to fidelity and completeness of assembled school database and other complementary studies on travel specificities (Dixit et al. Citation2016; Snow et al. Citation2017). Finally, among the top 20 counties with the highest proportion of the population that has never been to school in Kenya, seven were in this region (KNBS Citation2020).
Figure 1. Location of Western Kenya with eight counties (dark lines) and 62 sub-counties (numbered, see note) relative to Kenya and Africa. Notes: Bungoma county: Bumula (1), Kabuchai (2), Kanduyi (3), Kimilili (4), Mt. Elgon (5), Sirisia (6), Tongaren (7), Webuye East (8), Webuye West (9); Busia county: Bunyala (10), Butula (11), Samia (12), Matayos (13), Nambale (14), Teso North (15), Teso South (16); Homa Bay county: Homa Bay (17), Rachuonyo East (18), Rachuonyo North (19), Rachuonyo South (20), Suba North (21), Ndhiwa (22), Rangwe (23), Suba South (24); Kakamega county: Butere (25), Ikolomani (26), Khwisero (27), Likuyani (28), Lugari (29), Lurambi (30), Malava (31), Matungu (32), Mumias East (33), Mumias West (34), Navakholo (35), Shinyalu (36); Kisumu county: Kisumu Central (37), Kisumu East (38), Kisumu West (39), Muhoroni (40), Nyakach (41), Nyando (42), Seme (43); Migori county: Awendo (44), Kuria East (45), Kuria West (46), Nyatike (47), Rongo (48), Suna East (49), Suna West (50), Uriri (51); Siaya county: Alego-usonga (52), Bondo (53), Gem (54), Rarieda (55), Ugenya (56), Ugunja (57), Vihiga county: Emuhaya (58), Hamisi (59), Luanda (60), Sabatia (61), Vihiga (62).
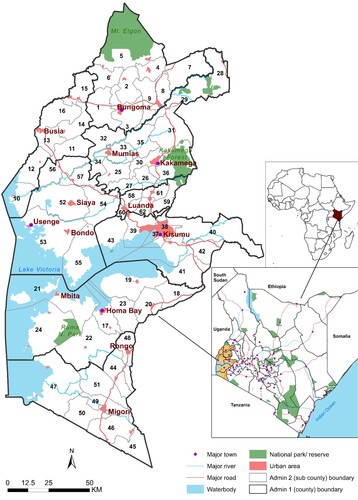
The region has 53 urban areas that host 1.4 million people, 14.4% of the region’s total population (KNBS Citation2020). The major urban areas in the region, each with more than 20,000 people, are Kisumu city, Kakamega, Busia, Migori, Bungoma, Kimilili, Homa Bay, Webuye and Mumias (). These urban areas support trading activities and host major learning institutions. Farming and fishing are the dominant agricultural activities of the region (LREB Citation2020). Transport infrastructure is still developing with less than 50% of the roads paved. Transportation in the area is affected by altitudes that vary from 1130 metres above sea level around Lake Victoria to 4321 above sea level at Mt. Elgon. The major rivers include Yala, Nzoia, Nyando, Sondu, Kuja and Migori draining into Lake Victoria and are impassable except in a bridge. Near the lakeshore and along the river mouths are seasonal and permanent swamps. The region has a bi-modal rainfall pattern (LREB Citation2020), which may impact travel speeds in the unpaved roads.
Kenyan education system
The Ministry of Education manages the education sector in Kenya to ensure access to quality education. The national government is tasked with education policy, standards, curriculum, examinations, universities, research, higher learning and tertiary institutions, primary schools, secondary schools, special education, and promotion of sports. County governments are tasked with pre-primary education, youth polytechnics, home craft centres, farmers training centres and childcare facilities (GoK/MoE Citation2018). The government introduced free and compulsory primary education in 2003 (GoK/MoE Citation2018). Primary net enrolment rate increased by 8%, from 9.8 million in 2013 to 10.6 million in 2018, while the net enrolment rate rose from less than 60% during the pre-2003 period to about 91% in 2017 (GoK/MoE Citation2018) and can be linked to free primary education (Zuilkowski et al. Citation2018). About 9% of SGC expected to be in primary school were not enrolled nationally in 2018. The national education sector strategic plan 2018–2022 aims to enhance access and equity to education due to existing disparities in access based on location, gender, and region and recommends schools to be established within 2 km of children’s households, a reasonable walking distance (GoK/MoE Citation2018).
Our analysis considers travel time because time is comparable across different context and geographies, accounting for travel factors such as obstacles and topography (Ouma et al. Citation2021). The average human walking speed is 5 km/hr, which translates to 24 min for 2 km. However, children do not walk along a straight line to schools due to travel barriers and topography. Instead, they walk along road networks and footpaths, but the walking speeds vary depending on slopes and land use or cover. Therefore, a 2 km radius is more realistically represented as 24 min after accounting for factors that affect travel.
Methods
A flowchart summarising the analytical approaches is presented in supplemental online material. First, we curated existing lists of schools to create a spatio-temporal master list. Second, we assembled spatial data layers of factors that affect travel between residences and primary schools, including population estimates of school-going children. In the third step, we reviewed the literature to derive and infer school attendance specificities in travel modes and associated speeds. The fourth step entailed combining the factors that affect travel, geocoded school lists and school attendance behaviour in a geospatial framework to compute travel time between each 100 m grid and the nearest primary school and generating SCAs. Finally, we estimated the proportion of SGC within the recommended travel time threshold through a spatial overlay and aggregated at the sub-county level for relevance to policymakers.
Data assembly
School database
We consulted six existing school databases in Western Kenya, merged and cleaned them to a unique list of PPS in 2009 and 2020 (supplemental online material). We focused only on PPS managed by local authorities, community, Ministry of Education, non-governmental and religious organisations. These are more accessible by the general public since the introduction of free and compulsory primary education (GoK/MoE Citation2018). We excluded special schools catering for the deaf, blind, and neurologically impaired given our aim of computing walking travel time. We did not include schools that were purely boarding since students do not make daily travels to boarding schools.
The baseline database consisted of a geocoded listing of all educational institutions in Kenya from a nationwide mapping survey in 2009 and considered the gold standard (Mulaku and Nyadimo Citation2011). The list had 2137 PPS in Western Kenya meeting our inclusion criteria. The second list contained schools that participated in malaria parasite surveys since 2009 (Snow et al. Citation2017) and contributed 336 PPS in Western Kenya. The third list was retrieved from the online primary education directory of Kenya dated 2017 and contributed to 4234 PPS (PEDK Citation2017). It included school ownership, geographic coordinates, and type of school. However, details on custodian and how the list was generated were lacking. A fourth master list from the Ministry of Education dated 2018, was obtained through personal communication, listed schools and ownership details, but lacked geographic coordinates and contributed to 4920 PPS. The fifth list we used was a 2020 World Bank Kenya schools listing (World Bank Group Citation2020). Its data appears to be an amalgamation of lists from Ministry of Education in 2007 and 2016, it listed geographic coordinates and ownership details contributing to 4810 PPS. Finally, from the 2020 Ministry of Education enrolment listing provided through personal communication, we identified 4899 PPS meeting the inclusion criteria without geographic coordinates.
To create a master database, the lists were consulted progressively between 2009 and 2020. We confirmed no duplicates and geocoded the schools that did not have coordinates through Google Earth, OpenStreetMap, and Geonames. After geocoding, we ensured that no PPS were located within protected areas or in water bodies by rechecking the coordinates from the geocoding exercise.
Factors that affect travel
Roads: We assembled, merged and cleaned road networks from three sources detailed elsewhere (Joseph et al. Citation2020). In brief, the most comprehensive of Kenya’s road network data from the Ministry of Transport formed the road’s baseline layer. It was created using the gold standard Global Positioning System technique to map coverage of roads in 2016. We updated these roads via OpenStreetMap and Google Map Maker. The merged data road network was harmonised in ArcMap version 10.5 (ESRI Inc., Redlands, CA, USA) by deleting overlapping road sections, overshoots and undershoots at connection points due to digitisation errors and those road segments that extended into water bodies.
Land use/cover: Some areas were not covered by the road network or foot paths. We used satellite-derived information (land cover) to designate the underlying geographical space that children need to traverse on their journeys to schools in the absence of a road network and footpaths. We used the 2016 Copernicus Sentinel-2 satellite-derived landcover at 20 m spatial resolution. The study area contained shrubs cover, sparse vegetation, grassland, cropland, tree cover, bare areas, built-up areas, and open water.
Digital elevation model: The slope of the land derived impedes walking speeds that were corrected according to Tobler’s hiking function. This exponential function describes how human walking speeds vary with slope (Tobler Citation1993). The elevation was based on the Shuttle Radar Topography Mission at 30 m × 30 m spatial resolution (Farr et al. Citation2007).
Travel barriers: Barriers of travel included major rivers, lakes, national parks and game reserves (UNEP-WCMC and IUCN Citation2017). Barriers were considered impassable except in the presence of a bridge where a road intersects a water body or where official roads pass through national parks and game reserves.
Population data
To estimate the proportion of children within the recommended travel threshold, high spatial resolution population density maps of SGC are required to match the resolution of generated travel surfaces. However, estimates from the population census are at a coarse resolution (administrative units) and available decennially, the census repeat period. To circumvent this, population density data for SGC (aged between 5 and 14 years) for 2009 and 2020 at 100 m spatial resolution were downloaded from Worldpop Geoportal (WorldPop Citation2021). The downloaded SGC gridded surfaces are based on dasymetric spatial modelling techniques detailed by Stevens et al. Citation2015. In brief, population counts from census-based administrative units are redistributed using weights determined through the Random Forest technique by shifting people away from areas unlikely to be inhabited. The weights are assigned to each probable predictor of population distribution such as land cover, night-time lights, and health facilities. To obtain estimates in between population census, Worldpop projects the modelled estimates to match UN national estimates at the national level and grouped by five-year-age groups based on census and household survey age distribution patterns. shows a summary of all assembled data layers.
Table 1. Summary of data assembled including school databases, factors that affect travel between home and schools, and population data for primary school-going children.
Modelling travel time
To reliably estimate travel time, it is important to understand children’s travel behaviour between their homes and schools. Substantial literature exists in high-income countries about how children travel to schools compared to SSA where there is little to no documentation. The existing literature in SSA suggests that most children walk on foot to school (Bwire Citation2020; Salon and Gulyani Citation2019). This corresponds to health access literature (Dixit et al. Citation2016) and low ownership of motorcycles and vehicles in Western Kenya (KNBS Citation2020). This also aligns with our local knowledge of the region, involvement in school surveys related to malaria prevalence among SGC (Snow et al. Citation2017) and numerous spatial accessibility analyses to healthcare service providers (Ouma et al. Citation2018). Consequently, in this analysis, we only implemented a walking mode of transport between households and schools. This was also important to assess the Ministry of Education’s recommended threshold based on walking mode.
To model travel time to the nearest PPS, the ‘accessibility module’ of AccessMod software (alpha version 5.7.8) was used (Ray and Ebener Citation2008). AccessMod utilises the terrain-based least-cost path distance calculation to model travel time. The ‘merge land cover’ module in AccessMod was used to merge the road network, land cover, rivers, lakes and protected areas to obtain a single raster dataset to which walking speeds were applied. Speeds were assigned to each road class and land cover type based on a review of studies involving walking to schools in low-resource settings (supplemental online material). The analysis was conducted at 100 m spatial resolution for 2009 and 2020.
In this implementation, a child walks along a road if there is a road connecting their residence to the nearest school in the shortest time. In areas with no roads, the child will walk along the least resistance route in terms of vegetation and trees. Thus, a student will walk along grassland through the shortest path to reach a nearby road that leads to the school up to the point of taking a grassland trail in the final stretch to school. This implementation accounts for topography and the transport barriers in determining the least-cost path.
Delineating school catchment areas
To better understand areas that are geographically far from households and not sufficiently covered by a SCA, we defined the geographical area around a school where the majority of students who attend a particular school reside (SCA) (Gould Citation1978; Macharia et al. Citation2021). Within the ‘accessibility’ module of AccessMod software, we adopted the defined travel time model and used Accessmod’s cost allocation option to output the cost allocation grid delineating SCAs in 2009 and 2020. The SCAs were constrained to 24 min based on the Ministry of Education threshold. The cost allocation algorithm calculates for each cell, its nearest school based on the least accumulative travel similar to the Voronoi diagram in Euclidean distance analysis. Consequently, these algorithms result in non-overlapping SCAs due to the unavailability of residential addresses for school-going children.
Finally, gridded surfaces of travel time and downloaded SGC population density maps were used to estimate the proportion of SGC within 24 min of their nearest PPS in 2009 and 2020 and aggregated at the sub-county level using ArcMap 10.5 (ESRI Inc., Redlands, CA, USA).
Results
The six school lists (supplemental online material) resulted to a master database with 2170 PPS in 2009 and 4894 in 2020 in the eight counties of Western Kenya. We were unable to geolocate 212 (4.3%) schools in 2020 (potentially newly constructed schools), while all schools listed in 2009 had been spatially positioned from a national mapping survey. Therefore, 2170 PPS in 2009 ((a)) and 4682 PPS in 2020 ((b)) were used to define geographical accessibility to the nearest PPS and their corresponding SCAs.
Figure 2. Public primary schools in 2009 (a) and 2020 (b), with corresponding modelled walking travel time to the nearest school in 2009 (c) and 2020 (d) in Western Kenya.
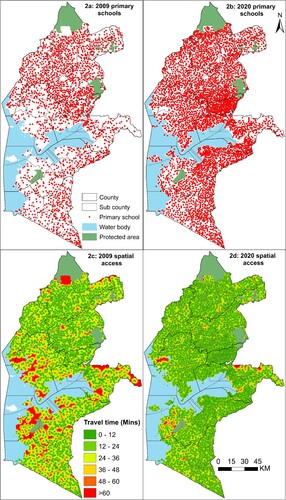
Across the region, the number of PPS increased by 115.8% from 2009 to 2020. The increase was variable ranging from 59.5% (Busia) to 209.8% (Homa Bay) across the eight counties, and from 19.4% (Matayos) to 506.7% (Suba North) across the 62 sub-counties. Thirty sub-counties had a percentage increase of over 100%, while 11 had a percentage increase of less than 50%. A majority (56%) of the sub-counties had over 70 schools, while 11 sub-counties had less than 40 schools each. In 2020, Homa Bay county (787) and Rachuonyo North sub-county had the highest number of schools (supplemental online material).
The average travel time to the nearest PPS in the Western region was 28 min in 2009 and reduced by 39% to 17 min by 2020. Therefore, in 2009 children walked on average 4 min (0.3 km) further relative to the Ministry of Education’s threshold of 24 min, while in 2020, all children were covered within the threshold. Accounting for the population distribution, 65% (1,390,173) of SGC lived within the threshold in 2009. Therefore, 35% of the SGC were considered marginalised in 2009. In 2020, 11% of SGC were outside the threshold, with 89% (2,455,102) residing within the cut-off. The 24% increase was observed in the areas where new schools had been introduced (supplemental online material).
The regional metrics mask much sub-regional heterogeneity in geographical access to schools. At the county level in 2009, the average travel time was 34 min in the most marginalised county (Homa Bay) and 18 min in the best performing county (Vihiga). The improvement has been evident over the past decade. The average time decreased by between 23% (Kakamega) and 47% (Homa Bay) across the eight counties. By 2020, all counties had an average travel time equal to or less than 18 min; surprisingly, the value was recorded for the best performing county in 2009. Although access to schools in Homa Bay County had the greatest improvement, they remained the farthest from residential areas on average in 2020.
In terms of Ministry of Education cut-off, by 2020, on average, all schools in every county were accessible within the 24 min threshold. This was a significant improvement from 2009, when only two counties were accessible within the threshold. However, the number of children within 24 min ranged between 86% (277,437) in Migori county and 99% (186,873) in Vihiga county by 2020. The situation in 2009 was dire, with all counties having less than 80% of children meeting the threshold. Siaya and Homa Bay were the most disadvantaged with about half of SGC outside the threshold in 2009.
However, while regional and county-level metrics are essential for country and regional planning, county planners need sub-county level metrics to support their decisions. Sub-county level metrics uncovered further heterogeneity. In 2009, one sub-county (Mt. Elgon) had an average travel time of 70 min, 11 sub-counties averaged between 50 and 30 min, while the rest (50 sub-counties) had averages of less than 30 min each. By 2020, all sub-counties had an average travel time of less than 30 min, a remarkable improvement.
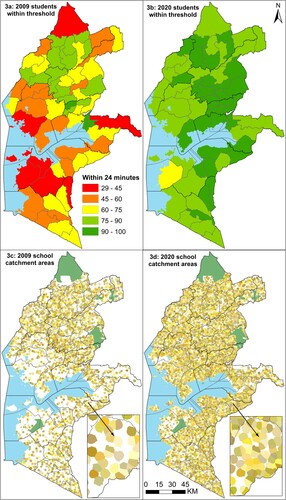
In terms of the policy threshold, in 2009, schools in 55% of the sub-counties could be accessed within the recommended threshold, while in 2020, only schools in Suba-South sub-county could not be accessed within the threshold. The proportion of SGC within 24 min was uneven, ranging from 29% in Suba North sub-county to 94% in Kisumu Central sub-county ((a)) in 2009, and between 100% (Sabatia) to 61% (Suba South) in 2020 ((b)). In 2009, 52 and 19 sub-counties had over 50% and 75% of their SGC within the threshold, respectively. By 2020, all sub-counties had over 50% of their SGC within 24 min of a PPS. All but one sub-county (Suba South) had coverage of over 75% in 2020 compared to 18 sub-counties in 2009. Six sub-counties (Nambale, Suba South, Likuyani, Lugari, Muhoroni, and Nyatike) had the highest proportion of SGC outside 24 min (marginalised) in 2020 (supplemental online material).
Figure 3. Proportion of primary school-going children within the recommended threshold of 24 min (2 km) by sub-county in 2009 and 2020 (top panel) and the corresponding school catchment areas (coloured) (bottom panel).
There is value in understanding high-level spatial resolution variation of travel time when targeted actions are required compared to county and sub-county summary. Travel time from households to schools ranged between 0 and 4.3 h in 2009 and 2.6 h in 2020. To better contextualise this variation, the proportion of SGC within every 5 min band in 2009 is shown in supplemental online material. It shows a typical decay curve for both time points, where the proportion with each 5-minute band increases, followed by a rapid decline before flattening off.
SCAs were generated for each PPS in 2009 and 2020. (lower panel) shows areas (in white) not covered by the catchments with a total of 743,121 (35%) SGC in 2009 ((c)) and 304,968 (14%) SGC in 2020 ((d)). Much of the habitable area was within 45 min. The areas beyond 45 min reduced from 13% in 2009 to 2% in 2020. These areas were mainly located at the foot of mountains or bordering adjacent counties, which for the latter could indicate that SGC could be attending a school in a neighbouring county that was not part of the eight counties considered in our study.
Discussion
We have assembled a temporal updated geocoded database of public primary schools by combining six databases in eight counties of Western Kenya. The database is comprehensive when compared to a single list that might be incomplete and lacking spatial locations. Using this comprehensive database, we have provided geographic access metrics for two-time points, 2009 and 2020 and the corresponding SCAs. The travel time and SCAs were aligned to the government’s recommended 2 km (24 min) threshold at the subnational units used for decision-making.
Mapping the spatial positions of schools as done in this study and maintaining a master geocoded list of schools with relevant attributes facilitates a better understanding of disparities in geographical access to educational centres. The master geocoded list can further enhance connectivity by unmasking infrastructure gaps such as the provision of internet within schools by relating the location of schools and radio transmitters (GRID3 Citation2021) in western Kenya. The generated travel time metrics provide a better understanding of the time students spend walking each day and how that time varies at high spatial resolution and at the decision unit level. In the last decade, Western Kenya witnessed a substantial increase in the proportion of SGC within the Ministry of Education’s recommended threshold of 24 min walking time to the nearest PPS. In 2009, 13 out of 20 SGC were within the threshold, and this has improved to about 18 out of 20 SGC by 2020.
The derived travel time is likely to be variable across sub-groups such as socio-economic status, informal settlements, geography, and gender which we did not investigate due to data limitations. In terms of geography, since we concentrated in Western Kenya only which is better served by schools, it might limit generalisability across Kenya and other low-resource settings. While in terms of gender, girls are more disadvantaged than boys due to safety concerns when walking to schools (GoK/MoE Citation2018), seasonal risks from impassable road network elements, fatigue (Fiala et al. Citation2020) and dangers from assault and sexual harassment especially in rural areas. Consequently, girls may travel further to go to girls only schools or use longer routes where insecurity is not a concern.
We generated SCAs accounting for travel factors, unlike those generated through straight-line (buffers, Thiessen polygons and administrative boundaries). Subsequent policy applications of SCAs underpin the importance of defining a representative and robust catchment (Macharia et al. Citation2021). However, despite accounting for travel factors, this is an approximation due to the lack of geolocated residence location and other factors that attract SGC and parents to a specific school such as capacity, size, number of classrooms per school, and enrolment statistics (Mackintosh et al. Citation2020; Solomon and Zeitlin Citation2019). The catchments areas did not overlap. In practice, however, children in the same village might attend several primary schools, resulting in overlapping SCAs.
Availability of data to better understand school attendance behaviour between households and schools would have improved the generated travel time metrics and SCAs. Attendance behaviour is a complex socio-economic and demographic activity influenced by type of school, distance or travel time, weather conditions, gender, urban and rural areas, socioeconomic status, age group, neighbourhood safety, availability of walking and cycling paths, traffic, and car ownership (Chacha and Bwire Citation2013; Bwire Citation2020; Siiba Citation2020). However, in Kenya and SSA, there is a dearth of information on school attendance behaviour. This creates an impetus for data collection to improve model parametrisation. For example, the assumption that students attend the nearest PPS can be handled by using residences and incorporating the mode of transportation utilised.
There were additional limitations to our study. Our spatial access metrics did not account for private, and special educational needs schools, which may underestimate SGC within 24 min of a school. Exclusion of a few purely boarding schools may have underestimated spatial access. However, these might have been balanced by including mixed day and boarding schools. The exclusion of boarding-only schools was necessary to account for those who travel to school on daily basis. In contrast, the exclusion of private schools allowed for the calculation of access metrics for schools open to the public at no cost.
We computed travel time to the nearest school. Still, a small proportion of children may bypass the nearest school for a variety of reasons such as parental choice (Solomon and Zeitlin Citation2019). Weather variability, such as rainfall, can affect walking speeds, footpaths, and unpaved roads. Some areas are also prone to insecurity than others and potentially impassable. Overall, not accounting for the school attended, weather variability and insecurity may have resulted in overestimating SGC with good access and underestimating marginalised SGC. We also did not consider those PPS in neighbouring counties’ outside our study area, but students may attend schools across counties.
More significantly, the geospatial methodological approaches used in this study provide a detailed framework that can be used in other contexts (SSA and low-resource settings) to help address problems related to local and international policies in education and other thematic areas. The application of GIS and other geospatial technologies in educational planning has started to gain momentum and is nascent. The Education Commission, a global initiative enhancing progress on SDG 4, established a GIS for Education Working Group that aims to convene actors in the education sector who are using GIS to advance SDG 4 (The Education Commission Citation2021). The group defined school remoteness and SCAs in Sierra Leone (Mackintosh et al. Citation2020). GRID3 determined spatial access and optimised school locations in Nigeria, while in Sierra Leone they mapped coverage of education radio transmitters and suitable areas for expansion, conducted school mapping and catchment analysis (GRID3 Citation2021). Rodriguez-Segura and Kim (Citation2021) developed a framework to identify areas not served by schools in low- and middle-income countries. The momentum in the use of geospatial technologies is promising in the education sector.
First, by making our database publicly available, we anticipate that other researchers will harness its potential through further analyses, in addition to supporting its improvement over time. Further, this exemplar list of PPS in Western Kenya demonstrates that such lists can be collated and maintained across countries, continents and indeed globally, in a similar way as our previous work of creating health facility master list for sub-Saharan Africa (Ouma et al. Citation2018). This can also be applied to other service points relevant to children geographies such as playgrounds, open spaces, and parks. The accessibility framework is also replicable in other contexts by making use of school lists or other service points combined with travel factors and travel behaviour to explore how far residences are from service points to inform corrective measures beneficial to the wider community.
This school master list can be further improved by attaching school attribute data such as the number of textbooks, chairs, availability of electricity, water sanitation facilities, playing grounds, and school buses. When such information is overlaid with geographic access metrics, nuanced and informative viewpoints can be derived that would enrich the assessment of service provision. For example, a village might have good spatial access, but its corresponding school might have few textbooks. In this regard, UNICEF initiated in 2017 Project Connect that aims to create a global map of all schools, including their internet connection status. This has been made possible by leveraging existing data, crowdsourcing, and training of machine learning algorithms based on high-resolution imagery and partnering with governments, the private sector, and communities.
The generated travel time metrics have important implications for policymakers in Kenya and other similar contexts with low resources as pertains to the SDGs and education development agenda. SDG 4 on education aims to ensure inclusive and equitable quality education and promote lifelong learning opportunities for all. Therefore, the first step in understanding inclusivity and equity is, at the very least, to explore issues related to access. This is because some communities would be left behind even if schools were guaranteed to provide a high-quality education, due to physical distance between them and the residences. The estimates can be used by education stakeholders to prioritise those outside the set distance/time threshold and aligns with the SDG principle of targeting the marginalised and reaching furthest behind, first.
The subnational metrics generated offers policymakers a starting point regarding where to focus on and would include prioritising the six sub-counties with the highest proportion of SGC outside the threshold. The high spatial-resolution maps () can reveal the villages that have poor geographical access. Strategies for improvement might include building additional schools, providing alternative means of transport (such as school buses or bicycles) (Fiala et al. Citation2020) and providing social support structures for those most marginalised who are also likely to be the poorest. Left unchecked, the long walking distances and travel times may lead to poor schooling and learning outcomes, poor enrolment rates and negatively affect the likelihood of achieving SDG 4 that aims to ensure inclusive and equitable quality education for all.
The travel time continuous surfaces can be spatially overlaid with other geospatial indicators (socio-economic and educational status) to gain more insights. For example, which areas and communities bear a considerable burden, are marginalised from schools, are poor and have low educational attainment. Travel can also be statistically linked with enrolment rates to assess the impact of longer walking distance on enrolment, not explored in the current work due to data limitations.
Across Kenya and sub-Saharan Africa, SCAs can inform planning, effective delivery of services and resources, and school-based interventions such as projecting school needs (supply of books, allocation of teachers and improving infrastructure). It would form the basis for constructing new classrooms within existing schools or constructing new schools. Importantly, the utility of the SCAs finds applications beyond the education sector. They can be used as alternative service delivery points by estimating the total population that would have access to them in mass campaigns for health interventions such as bed nets and COVID-19 vaccines. We are currently pursuing this area, including extending the current database to the entire country. SCAs also open new possibilities in model-based geostatistics discipline for disease mapping (Diggle and Giorgi Citation2019). Current model-based geostatistics approaches mainly rely on residence locations to interpolate disease risk within an area. The paradigm can be extended to incorporate SCAs and draw inferences on the children’s residence when this is missing to reduce bias.
Conclusions
We have provided an updated geolocated database of schools in Western Kenya, and defined geographic access, along with coverage of school-going children within recommended travel threshold and corresponding school catchment areas. The geospatial approach can be replicated within other counties in Kenya and different low-resource settings across the world in the education and related sectors. The findings are useful for policy and decision-makers to target children outside the threshold by offering alternative means of transport, implementing community programmes to reduce poverty and other social support structures, or establishing the feasibility of additional schools. This will likely increase primary school enrolment, educational attainment, reduce inequalities in education access and increase the likelihood of meeting SDGs linked with education attainment.
Supplemental Material
Download MS Word (316.6 KB)Acknowledgements
The authors would like to thank Dr Charles Mwandawiro and Crispin Owaga for their help in locating lists of schools.
Disclosure statement
No potential conflict of interest was reported by the author(s).
Data availability statement
The data associated with the findings in this manuscript is available at https://doi.org/10.7910/DVN/5N8LW2.
Additional information
Funding
References
- Afoakwah, C., and I. Koomson. 2021. “How Does School Travel Time Impact Children’s Learning Outcomes in a Developing Country?” Review of Economics of the Household 19: 1077–1097.
- Alegana, V. A., C. Pezzulo, A. J. Tatem, B. Omar, and A. Christensen. 2021. “Mapping Out-of-School Adolescents and Youths in Low- and Middle-Income Countries.” Humanities and Social Sciences Communications 15 (8): 213.
- Attfield, I., M. Tamiru, B. Parolin, and A. De Grauwe. 1999. Improving Micro Planning in Education Through a Geographic Information System; Studies on Ethiopia and Palestine. Accessed January 4, 2022. https://unesdoc.unesco.org/ark:/48223/pf0000129288/PDF/129288eng.pdf.multi.
- Banke-Thomas, A., K. L. M. Wong, F. I. Ayomoh, R. O. Giwa-Ayedun, and L. Benova. 2021. “‘In Cities, It’s Not Far, but It Takes Long’: Comparing Estimated and Replicated Travel Times to Reach Life-Saving Obstetric Care in Lagos, Nigeria.” BMJ Global Health 6: e004318.
- Bwire, H. 2020. “Determinants of Children’s School Travel Mode in use in Dar es Salaam.” International Journal for Traffic & Transport Engineering 10: 390–401.
- Cattaneo, M. A., C. Oggenfuss, and S. C. Wolter. 2017. “The More, the Better? The Impact of Instructional Time on Student Performance.” Education Economics 25: 433–445.
- Chacha, P., and H. Bwire. 2013. “Analysis of Factors Affecting School Children Travel Mode Choice in Dar es Salaam.” In 32nd Southern African Transport Conference, 49–61. Pretoria, South Africa.
- De Kadt, J., S. A. Norris, B. Fleisch, L. Richter, and S. Alvanides. 2014. “Children's Daily Travel to School in Johannesburg-Soweto, South Africa: Geography and School Choice in the Birth to Twenty Cohort Study.” Children's Geographies 12: 170–188.
- Diggle, P. J., and E. Giorgi. 2019. Model-Based Geostatistics for Global Public Health: Methods and Applications. 1st ed. Boca Raton, FL: Chapman and Hall/CRC.
- Dixit, A., M. C. Lee, B. Goettsch, Y. Afrane, A. K. Githeko, and G. Yan. 2016. “Discovering the Cost of Care: Consumer, Provider, and Retailer Surveys Shed Light on the Determinants of Malaria Health-Seeking Behaviours.” Malaria Journal 15: 179.
- The Education Commission. 2021. GIS for Education Working Group. Accessed July 20, 2021. https://educationcommission.org/gis-for-education-working-group/.
- Farr, T. G., P. A. Rosen, E. Caro, R. Crippen, R. Duren, S. Hensley, M. Kobrick, et al. 2007. “The Shuttle Radar Topography Mission.” Reviews of Geophysics 45: RG2004.
- Fiala, N., A. Garcia-Hernandez, K. Narula, and N. Prakash. 2020. The Impact of Bicycles on Girls’ Education and Empowerment Outcomes in Zambia. Education Policy Brief. Accessed January 4, 2022. https://www.poverty-action.org/sites/default/files/publications/WBR-Policy-Brief-2020.04.30.pdf.
- Friedman, J., H. York, N. Graetz, L. Woyczynski, J. Whisnant, S. I. Hay, and E. Gakidou. 2020. “Measuring and Forecasting Progress Towards the Education-Related SDG Targets.” Nature 580: 636–639.
- GoK (Government of Kenya). 2010. The Constitution of Kenya, 2010. Accessed July 20, 2021. http://kenyalaw.org/kl/index.php?id=398.
- Gould, W. T. S. 1978. Guidelines for School Location Planning. Staff Working Paper 308. Washington, DC: World Bank.
- Government of Kenya, and Ministry of Education. 2018. National Education Sector Strategic Plan 2018–2022. Accessed July 20, 2021. https://www.globalpartnership.org/sites/default/files/document/file/kenya-nessp-2018-2002.pdf.
- Graetz, N., J. Friedman, A. Osgood-Zimmerman, R. Burstein, M. H. Biehl, C. Shields, J. F. Mosser, et al. 2018. “Mapping Local Variation in Educational Attainment Across Africa.” Nature 555: 48–53.
- GRID3 (Geo-Referenced Infrastructure and Demographic Data for Development). 2021. Data-Driven Decision Making. Accessed July 20, 2021. https://grid3.org/.
- Joseph, N. K., P. M. Macharia, P. O. Ouma, J. Mumo, R. Jalang’o, P. W. Wagacha, V. O. Achieng, et al. 2020. “Spatial Access Inequities and Childhood Immunisation Uptake in Kenya.” BMC Public Health 20: 1407.
- KNBS (Kenya National Bureau of Statistics). 2020. 2019 Kenya Population and Housing Census Reports. Accessed July 23, 2020. https://www.knbs.or.ke/?p=5732.
- Lavy, V. 1996. “School Supply Constraints and Children's Educational Outcomes in Rural Ghana.” Journal of Development Economics 51: 291–314.
- Lehman, D. 2013. Access to Education in Rural Areas of Mali: Shortening the Distance to Education for All. Accessed January 6, 2022. https://www.edc.org/sites/default/files/uploads/Mali-Rural-Ed.pdf.
- LREB. 2020. The Lake Region Economic Blueprint; A Better Life. Accessed December 30, 2021. https://lreb.or.ke/downloads/.
- Lutz, W., J. C. Cuaresma, and W. Sanderson. 2008. “The Demography of Educational Attainment and Economic Growth.” Population 25: 15–19.
- Macharia, P. M., N. Ray, E. Giorgi, E. A. Okiro, and R. W. Snow. 2021. “Defining Service Catchment Areas in Low Resource Settings.” BMJ Global Health 6: e006381.
- Mackintosh, A., A. Ramirez, P. Atherton, V. Collis, M. Mason-Sesay, and C. Bart-Williams. 2020. Education Work Force Spatial Analysis in Sierra Leone. Accessed July 20, 2021. https://educationcommission.org/wp-content/uploads/2020/12/2-EW-Spatial-Analysis-Paper.pdf.
- Makanga, P. T. 2021. Practicing Health Geography: The African Context. 1st ed. Global Perspectives on Health Geography. Cham: Springer Nature. doi:10.1007/978-3-030-63471-1.
- Marmot, M., S. Friel, R. Bell, T. A. Houweling, S. Taylor, and Commission on Social Determinants of Health. 2008. “Closing the Gap in a Generation: Health Equity Through Action on the Social Determinants of Health.” The Lancet 372: 1661–1669.
- Mulaku, G. C., and E. Nyadimo. 2011. “GIS in Education Planning: The Kenyan School Mapping Project.” Survey Review 43: 567–578.
- Ngware, M. W., and M. Mutisya. 2021. “Demystifying Privatization of Education in Sub-Saharan Africa: Do Poor Households Utilize Private Schooling Because of Perceived Quality, Distance to School, or Low Fees?” Comparative Education Review 65: 124–146.
- Ouma, P., P. M. Macharia, E. A. Okiro, and V. A. Alegana. 2021. “Methods of Measuring Spatial Accessibility to Health Care in Uganda.” In Practicing Health Geography. Global Perspectives on Health Geography, edited by P. T. Makanga, 77–90. Cham: Springer.
- Ouma, P.O., J. Maina, P.N. Thuranira, P.M. Macharia, V.A. Alegana, M. English, E.A. Okiro, and R.W Snow. 2018. “Access to emergency hospital care provided by the public sector in sub-Saharan Africa in 2015: a geocoded inventory and spatial analysis.” The Lancet Global Health 6 (3): e342–e350.
- PEDK (Primary Education Directory of Kenya). 2017. Kenya Primary Schools: Primary Education Directory of Kenya. Accessed March 25, 2021. https://www.kenyaprimaryschools.com/.
- Poku-Boansi, M., C. Amoako, and D. O. Atuah. 2019. “Urban Travel Patterns and Safety among School Children Around Accra, Ghana.” Journal of Transport & Health 15: 100660.
- Porter, G., K. Hampshire, A. Abane, A. Munthali, E. Robson, M. Mashiri, and G. Maponya. 2010a. “Where Dogs, Ghosts and Lions Roam: Learning from Mobile Ethnographies on the Journey from School.” Children's Geographies 8: 91–105.
- Porter, G., K. Hampshire, A. Abane, E. Robson, A. Munthali, M. Mashiri, and A. Tanle. 2010b. “Moving Young Lives: Mobility, Immobility and Inter-Generational Tensions in Urban Africa.” Geoforum 41: 796–804.
- Ray, N., and S. Ebener. 2008. “AccessMod 3.0: Computing Geographic Coverage and Accessibility to Health Care Services Using Anisotropic Movement of Patients.” International Journal of Health Geographics 7: 63.
- RCMRD. 2020. “RCMRD Geoportal.” Accessed July 20, 202. http://geoportal.rcmrd.org/.
- Rodriguez-Segura, D., and B. H. Kim. 2021. “The Last Mile in School Access: Mapping Education Deserts in Developing Countries.” Development Engineering 6: 100064.
- Salon, D., and S. Gulyani. 2019. “Commuting in Urban Kenya: Unpacking Travel Demand in Large and Small Kenyan Cities.” Sustain 11: 1–22.
- Siiba, A. 2020. “Active Travel to School: Understanding the Ghanaian Context of the Underlying Driving Factors and the Implications for Transport Planning.” Journal of Transport & Health 18: 100869.
- Snow, R. W., B. Sartorius, D. Kyalo, J. Maina, P. Amratia, C. W. Mundia, P. Bejon, et al. 2017. “The Prevalence of Plasmodium Falciparum in Sub-Saharan Africa Since 1900.” Nature 550: 515–518.
- Solomon, S., and A. Zeitlin. 2019. What Do Tanzanian Parents Want from Primary Schools – and What Can Be Done About It? Accessed January 4, 2022. https://riseprogramme.org/sites/default/files/publications/RISE_Insight_TZ_School_Choice_1.pdf.
- Stevens, F. R., A. E. Gaughan, C. Linard, and A. J. Tatem. 2015. “Disaggregating Census Data for Population Mapping Using Random Forests with Remotely-Sensed and Ancillary Data.” PLoS One 10: e0107042. https://doi.org/10.1371/journal.pone.0107042.
- Stuart, E., and J. Woodroffe. 2016. “Leaving No-One Behind: Can the Sustainable Development Goals Succeed Where the Millennium Development Goals Lacked?” Gender and Development 24: 69–81.
- Theunynck, S. 2009. School Construction Strategies for Universal Primary Education in Africa: Should Communities Be Empowered to Build Their Schools? Washington, DC: The World Bank.
- Tobler, W. 1993. Three Presentations on Geographical Analysis and Modeling. Santa Barbara: University of California. http://escholarship.org/uc/item/05r820mz.
- UNEP-World Conservation Monitoring Centre (WCMC), and International Union for Conservation of Nature (IUCN). 2017. The World Database on Protected Areas. Accessed July 23, 2020. https://www.protectedplanet.net/.
- World Bank Group. 2020. Kenya Schools Data Catalog. Accessed April 16, 2021. https://datacatalog.worldbank.org/dataset/kenya-schools.
- World Bank Group. 2021. School Enrollment. Accessed May 20, 2021. https://data.worldbank.org/indicator/SE.PRM.NENR.
- WorldPop. 2021. Open Spatial Demographic Data and Research. Accessed July 20, 2021. https://www.worldpop.org/.
- Zuilkowski, S. S., B. Piper, S. Ong’ele, and O. Kiminza. 2018. “Parents, Quality, and School Choice: Why Parents in Nairobi Choose Low-Cost Private Schools Over Public Schools in Kenya’s Free Primary Education Era.” Oxford Review of Education 44: 258–274.