
ABSTRACT
Objective
The current study aims to develop an algorithm for mapping the WHODAS 2.0 to the EQ-5D-5 L for patients with mental disorders.
Methods
This cross-sectional study was conducted at the Institute of Mental Health and Community Wellness Clinics in Singapore between June 2019 and November 2022. We included four regression methods including the Ordinary Least Square (OLS) regression, the Tobit regression model (Tobit), the robust regression with MM estimator (MM), and the adjusted limited dependent variable mixture model (ALDVMM) to map EQ-5D-5 L utility scores from the WHODAS 2.0.
Results
A total of 797 participants were included. The mean EQ-5D-5 L utility and WHODAS 2.0 total scores were 0.615 (SD = 0.342) and 11.957 (SD = 8.969), respectively. We found that the EQ-5D-5 L utility score was best predicted by the robust regression model with the MM estimator. Our findings suggest that the WHODAS 2.0 total scores were significantly and inversely associated with the EQ-5D-5 L utility scores.
Conclusion
This study provides a mapping algorithm for converting the WHODAS 2.0 scores into EQ-5D-5 L utility scores which can be implemented using a simple online calculator in the following web application: https://eastats.shinyapps.io/whodas_eq5d/.
1. Introduction
Mental disorders have been linked to substantial costs to patients, their family members, and the society [Citation1]. It has been estimated that the cost of mental disorders to the global economy could reach $16 trillion by 2030 [Citation2]. Over the years, a wide range of interventions have been introduced to treat people with mental disorders. Due to the increase in healthcare costs and scarcity of healthcare resources, cost-effectiveness analyses of an intervention, treatment, or program such as cost-utility analyses (CUA) play an important role in informing decision-makers on appropriate resource allocation to decide which intervention, treatment, or program to use. In CUA, the quality-adjusted life-year (QALY) is a key outcome measure because it allows a direct comparison across treatment strategies and patient populations [Citation3,Citation4]. The EuroQoL five-dimensional (EQ-5D) questionnaire is a commonly used multi-attribute utility instrument to generate utility values for the calculation of QALY [Citation5]. The United Kingdom (UK) National Institute of for Health and Care Excellence (NICE) has encouraged the use of the EQ-5D in economic evaluations and supported the use of mapping techniques as an alternative solution if the EQ-5D is not available [Citation4,Citation6–8].
In the mental healthcare setting, EQ-5D is not used as often as clinical instruments. Therefore, the development of mapping function of the EQ-5D from other instruments is the best alternative solution to generate utility values [Citation4,Citation7,Citation8]. One such potential instrument is the World Health Organization Disability Assessment Schedule 2.0 (WHODAS 2.0), a generic instrument for measuring functioning and disability among patients with mental or physical disorders. The WHODAS 2.0 was developed by the World Health Organization based on the International Classification of Functioning Framework to provide a standardized assessment tool for disability across diseases and cultures [Citation9]. It has been reported that the instrument is reliable, valid, and has good face validity, including replicability across countries, population groups, diagnostic groups, ages, and gender [Citation10]. The WHODAS 2.0 has been recommended and included in the fifth edition of the Diagnostic and Statistical Manual of Mental Disorders (DSM-5) and the eleventh International Classification of Diseases (ICD-11) [Citation10–12]. Therefore, it is expected that the use of WHODAS 2.0 in the assessment of functioning and disability in the clinical setting will increase over the years. Recently, Ma and colleagues [Citation13] developed a mapping algorithm from the WHODAS 2.0 onto the Assessment of Quality of Life-four dimensions (AQoL-4D) utility values and found that a robust regression with the MM estimator performed better than other statistical methods. Given that limited data exists on mapping studies on EQ-5D utility values based on the WHODAS 2.0, the current study aimed to develop an algorithm for mapping the WHODAS 2.0 to the EQ-5D among patients with mental disorders, which can be used to inform future cost-utility analysis.
2. Methods
This cross-sectional study was conducted at the Institute of Mental Health (IMH) and the Community Wellness Clinics (CWC) in Singapore between June 2019 and November 2022. IMH is the national tertiary psychiatric care provider which serves patients with various mental disorders in Singapore. CWCs are satellite clinics located in the community to provide psychiatric care to patients. Participants were patients recruited from outpatient clinics at IMH and the CWCs. Inclusion criteria comprised patients who were Singapore citizens or permanent residents, aged 21 years and above, able to understand and speak English and with a clinical diagnosis of depression, anxiety, or a schizophrenia spectrum disorder. Patients who were incapable of doing the interview due to severe physical or mental conditions and aged below 21 years were excluded from the study. The study was approved by the relevant Institutional Ethics Review Board (National Healthcare Group Domain Specific Review Board. Reference Number: 2018/01143). Prior to the commencement of data collection, written informed consent was obtained from all study participants. For the current study, data on socio-demographic background, EQ-5D-5 L, and WHODAS 2.0 from 798 participants were included. After removing observations with missing values in key variables, 797 observations were included in the final analysis.
3. Measures
The EQ-5D-5 L is a self-reported measure. It has five items: mobility, self-care, pain/discomfort, usual activities, and anxiety/depression, with five possible answers for each item (1 = no problems, 2 = slight problems, 3 = moderate problems, 4 = severe problems, 5 = extreme problems) and can generate 3125 possible health states. The utility scores of EQ-5D-5 L were obtained using Singapore (SG) value sets estimated with a cross-walk approach. The cross-walk approach was developed by van Hout et al. [Citation14] using the crosswalk link function between the EQ-5D-3 L value sets and the new EQ-5D-5 L descriptive system.
The WHODAS 2.0 is a 12-item instrument designed to measure disability during the preceding 30 days. Each item uses a 5-point Likert-type scale to reflect the level of difficulty, starting with ‘no difficulty’ and increasing in an ordered fashion from ‘mild,’ ‘moderate,’ ‘severe’ to ‘extreme or cannot do.’ A simple scoring can be generated by assigning each of the items a score ranging from 0 (mild) −4 (extreme or cannot do) – which are then summed up with total scores ranging from 0 to 48. The reliability and validity of the instrument has been established in Singapore [Citation15].
4. Statistical analyses
The distribution of EQ-5D utility scores are often not normally distributed due to a ceiling effect at a value of 1 [Citation16], hence we included four regression methods including the Ordinary Least Square (OLS) regression, Tobit regression model (Tobit), the robust regression with MM estimator (MM), and the adjusted limited dependent variable mixture models (ALDVMM) to map EQ-5D-5 L utility scores from the WHODAS 2.0. The selection of these four regression methods was based on their suitability for analyzing non-normally distributed data and their wide use as statistical methods in the mapping literature that perform well with EQ-5D data [Citation4,Citation17]. The OLS is the most widely used regression method to map EQ-5D utility values in mapping studies. In the OLS model, the regression slopes are estimated by minimizing the sum of the squares of the differences between the observed and predicted scores and it assumes the errors are normally distributed with mean zero and constant variance (homoscedasticity). The MM model is a robust regression method for outliers. This regression model estimates regression slopes by minimizing the sum of the absolute values of the residuals rather than the sum of their squares [Citation18]. The Tobit model is a regression model used in the presence of censored data which assumes that if a patient’s observed EQ-5D utility score is equal to 1, then EQ-5D utility score is actually greater than 1. This regression model assumes that there is a latent utility score that represents a valuation of an individual’s true health state [Citation19–21]. The ALDVMM is a mixture regression model of adjusted Tobit-like distribution. The regression model was developed to deal with the unique distribution of EQ-5D, including negative values at the bottom and a mass of observations at the top with the highest attainable value of 1 [Citation22]. Six model specifications were tested using OLS, Tobit, MM, and ALDVMM regression methods. The combination of four regression methods and six model specifications are summarized in . Briefly, Model 1 included only WHODAS 2.0 total score as the main predictor, Model 2 included WHODAS 2.0 total score and squared total score, Model 3 included WHODAS 2.0 total score, age, and gender, Model 4 included WHODAS 2.0 total score, squared total score, age, squared age, and gender, Model 5 included 12 individual items of the WHODAS 2.0, and Model 6 included 12 individual items of the WHODAS 2.0, age, and gender.
Table 1. Description of the model specification and regression methods.
The performance of the 24 regression models derived from the combination of four regression methods * six model modifications () was assessed based on three performance measures. These include mean absolute error (MAE) – the mean of the absolute differences between observed and predicted utility scores, mean square error (MSE) – the average of the squared differences between the observed and the predicted utility scores, and Lin’s concordance correlation coefficient for agreement on a continuous measure obtained by two methods (r). For the r values, the higher the value, the better the model, while for the MAE and MSE values, the lower the value, the better the model fit. Similar to Ma et al. (2023), we considered MAE as the primary indicator for the best performance model. Additionally, we also considered a model as optimal if it outperformed the other models on at least two of the three performance measures and had the smallest differences between observed and predicted values in terms of mean, minimum and maximum estimates, similar to previous studies [Citation23,Citation24]. The minimum and maximum estimates were used to measure and compare the spread of predicted scores against observed scores. We employed a tenfold cross-validation approach, which is increasingly popular in mapping studies to calculate the three performance measures. In this approach, we first randomly split the sample into 10 folds, fitting each regression model to the combined data of nine folds, the training set, and subsequently calculated the performance measures based on the tenth fold and the test set. This is an iterative process which does not stop until each of the 10 folds completes the estimation as the test set and produces the performance measures. We present the mean values of each performance measure in the final results. The correlation coefficient between the two raw scores was calculated using Pearson’s correlation coefficient (r). The Pearson’s correlation coefficient was interpreted using the following criteria: >0.6, very strong; ≥0.5 to ≤0.6, strong; <0.5 to ≥0.3, moderate; and <0.3, weak [Citation24]. All statistical analyses were performed in the Stata version 18.
5. Results
5.1. Descriptive statistics
The descriptive statistics are presented in . The sample included 797 participants with mental disorders. The mean age of the overall sample was 36.1 years (SD = 13), 70.8% were Chinese, 14.1% were Malays, 10.3% were Indians, and 4.8% belonged to other ethnicities. The EQ-5D-5 L showed a mean (SD) index score of 0.615 (0.342) with minimum and maximum scores of −0.584 and 1. An inspection of the distribution of the EQ-5D-5 L scores showed a substantial skew to the right, that is, toward better quality of life (). The mean (SD) WHODAS 2.0 total score was 11.957 (8.969). The scores showed a substantial skew to the left, that is, toward better functioning (). We found the WHODAS 2.0 total scores, and the EQ-5D utility scores had a strong correlation (r = −0.736), which indicated good overlap between the two instruments.
Figure 1. Distribution of the EQ-5D-5 L utility scores and WHODAS 2.0 total scores in the overall sample.
Table 2. Sociodemographic characteristics (n = 797).
5.2. Mapping on EQ-5D-5 L
shows summary performance measures from tenfold cross-validation. A combination of four regression methods (OLS, Tobit, MM, and ALDVMM) and six model specifications were fitted for mapping the WHODAS 2.0 to the EQ-5D utility scores. We found Model 1.3 consisting of the WHODAS 2.0 total scores had the smallest MAE value (0.179), while Model 2.3 consisting of the WHODAS 2.0 total scores, and squared WHODAS 2.0 total scores had the smallest differences in the minimum scores between observed and predicted scores (−0.349). We considered Model 2.3 as the best-performing model as we also observed that Model 2.3 had a slightly larger r value (0.712) than Model 1.3 and had the same predicted mean utility scores as the observed mean utility scores (0.615). In subgroup analysis, we also examined how these models performed across different diagnoses. Both models produced the smallest MAE and MSE values in anxiety (). The MAE and MSE values across diagnosis were slightly lower in the Model 1.3 than Model 2.3, but the differences were small. Model 2.3 had smaller, equal, and larger differences between the mean predicted scores and observed mean scores in the anxiety, depression, and schizophrenia groups, respectively (). In the final model, estimation using the overall sample revealed that WHODAS 2.0 total scores and squared WHODAS 2.0 total scores were significantly and inversely associated with EQ-5D-5 L utility scores. Hence, we propose that the EQ-5D-5 L utility values could be generated using Model 2.3 regression coefficients and a variance-covariance matrix results which can be found in Online Appendix 1 and Appendix 2, respectively. We have also developed a simple online calculator that is available at the following link: https://eastats.shinyapps.io/whodas_eq5d/ which allows the generation of EQ-5D-5 L utility values from WHODAS 2.0 total scores.
Figure 2. Prediction errors across diagnosis.
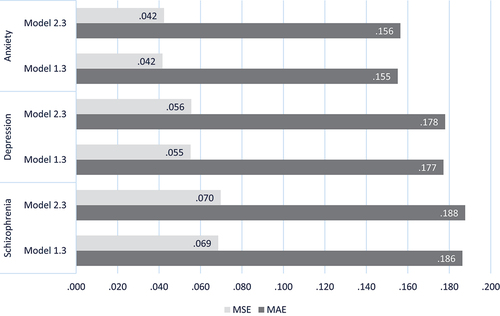
Table 3. Performance measures from tenfold cross-validation.
Table 4. Performance measures across different diagnoses.
6. Discussion
This is one of the few studies that have been conducted to map the WHODAS 2.0 onto a common utility score, the EQ-5D-5 L, in people with mental disorders in a multi-ethnic Asian population. Prior to the mapping analyses, we have examined the correlation between WHODAS 2.0 and EQ-5D-5 L. We found that the correlation was strong (r = −0.74) and concluded that there was a sufficient conceptual overlap between these two measures to support the development of a mapping algorithm. In the current study, four different regression methods and six model specifications were examined to develop mapping functions for the WHODAS 2.0. The findings provide evidence that the robust regression with the MM estimator should be used for mapping EQ-5D-5 L among patients with mental disorders. Our regression analyses showed that the EQ-5D-5 L utility score was best predicted by the robust regression model with the MM estimator consisting of two factors, i.e. WHODAS 2.0 total scores and squared WHODAS 2.0 total scores (Model 2.3). The robust regression with MM estimator outperformed other regression models and produced minimal MAE (0.183) and MSE (0.058), respectively. We note that WHODAS 2.0 total scores were significantly and inversely associated with EQ-5D-5 L utility scores, suggesting that higher disability was significantly associated with decreased quality of life. A previous study by [Citation13] has shown that the robust regression with MM estimator using individual items of the WHODAS 2.0 as predictors remained the best regression model for predicting utility scores derived from the AQoL-4D. Our results are not directly comparable to those of [Citation13] due to the fact that the latter study had used a different multi-attribute utility instrument in their regression model and the data were derived from people with disability or long-term conditions. It is important to note that the main purpose of the current mapping study was to develop a mapping function that best predicted EQ-5D-5 L utility scores, thus the statistical significance of the regression coefficients is of secondary consideration [Citation25]. In the current study, the selection of regression model was determined by three performance measures including MAE, MSE, and Lin’s concordance. Apart from that, differences between predicted and observed values in terms of mean, minimum and maximum scores were also taken into account in the model selection. Generally, our MAE values (with a mean of 0.183) are comparable to those of other mapping studies, and within the range of 0.011 to 0.19 that is typically reported in the literature [Citation17]. The MAE values that were produced by Model 2.3 were slightly higher than those produced by Model 1.3. However, we selected Model 2.3 as our selection of the best model was not focused exclusively on one performance measure but also took into consideration overall measures and descriptive statistics of the predicted scores including the mean, minimum, and maximum scores. It is important to note that most economic evaluations primarily focus on the impact of interventions using the mean scores, rather than minimum and maximum scores, thus emphasizing that the mean should be the primary consideration.
There are some limitations in the current study. First, the utility values for EQ-5D-5 L were based on the crosswalk approach that mapped EQ-5D-5 L utility scores from the EQ-5D-3 L because the Singapore value set estimated from a valuation study has not yet been developed. Hence, further analysis to update this mapping algorithm is needed when a new value set is available. Second, the current mapping study was conducted among those with mental disorders. Hence, further validation of the current mapping findings using external datasets with larger sample size under a wider range of conditions is recommended. Third, we have used econometric methods, further analysis using machine learning technique might improve the prediction. Nonetheless, this is the first study to compare four regression methods to map WHODAS 2.0 scores onto the EQ-5D-5 L, which is widely used as a generic preference-based measure to estimate QALYs in cost-effectiveness analyses. The mapping process incorporated the WHODAS 2.0 instrument into the model, which is feasible for use in economic evaluation of clinical research projects. These findings have practical implications for users interested in utilizing the WHODAS 2.0 for economic evaluation. This algorithm can contribute to the local health services research, to improve service provision and outcomes for people with mental illness in Singapore. From a clinical perspective, the WHODAS 2.0 is an increasingly used functioning and disability measure among patients with mental disorders. Hence, the availability of this algorithm will make cost-utility analysis possible among patients with mental disorders who are undergoing routine assessment for functioning and disability but do not have data on EQ-5D-5 L and other utility measures in future economic evaluation and trials.
7. Conclusion
In conclusion, we have provided a mapping algorithm for converting the WHODAS 2.0 scores into EQ-5D-5 L utility scores that is easily applicable in the clinical setting when EQ-5D data are not available. We suggest that the algorithm can be used to generate utility scores by mapping the EQ-5D-5 L from the WHODAS 2.0 to inform future cost-utility analyses in mental health interventions.
Declaration of interest
The authors have no relevant affiliations or financial involvement with any organization or entity with a financial interest in or financial conflict with the subject matter or materials discussed in the manuscript. This includes employment, consultancies, honoraria, stock ownership or options, expert testimony, grants or patents received or pending, or royalties.
Reviewer disclosures
Peer reviewers on this manuscript have no relevant financial or other relationships to disclose.
Additional information
Funding
References
- Christensen MK, Lim CCW, Saha S, et al. The cost of mental disorders: a systematic review. Epidemiol Psychiatr Sci. 2020;29:e161. doi: 10.1017/S204579602000075X
- Commission L. Report: mental illness will cost the world $16 trillion (USD) by 2030. Ment Health Wkly. 2018;28(39):1–8. doi: 10.1002/mhw.31630
- Brazier J. Measuring and valuing mental health for use in economic evaluation. J Health Serv Res & Policy. 2008;13 Suppl 3(3_suppl):70–75. doi: 10.1258/jhsrp.2008.008015
- Brazier J, Connell J, Papaioannou D, et al. A systematic review, psychometric analysis and qualitative assessment of generic preference-based measures of health in mental health populations and the estimation of mapping functions from widely used specific measures. Health Technol Assess. 2014;18(34):vii–viii, xiii–xxv, 1–188. doi: 10.3310/hta18340
- Longworth L, Rowen D. Mapping to obtain EQ-5D utility values for use in NICE health technology assessments. Value Health. 2013;16(1):202–210. doi: 10.1016/j.jval.2012.10.010
- Dakin H. Review of studies mapping from quality of life or clinical measures to EQ‐5D: an online database. Health Qual Life Outcomes. 2013;11(1):151. doi: 10.1186/1477-7525-11-151
- NICE. Guide to the methods of technology appraisal 2013. (UK): National Institute for Health and Care Excellence; 2013. Available from: https://www.nice.org.uk/process/pmg9/chapter/foreword
- Longworth L, Yang Y, Young T, et al. Use of generic and condition-specific measures of health-related quality of life in NICE decision-making: a systematic review, statistical modelling and survey. Health Technol Assess. 2014;18(9):1–224. doi: 10.3310/hta18090
- Ustun TB, Chatterji S, Kostanjsek N, et al. Developing the world health organization disability assessment schedule 2.0. Bull World Health Organ. 2010;88(11):815–823. doi: 10.2471/BLT.09.067231
- Federici S, Bracalenti M, Meloni F, et al. World health organization disability assessment schedule 2.0: an international systematic review. Disabil Rehabil. 2017;39(23):2347–2380. doi: 10.1080/09638288.2016.1223177
- Sjonnesen K, Bulloch AG, Williams J, et al. Characterization of disability in Canadians with mental disorders using an abbreviated version of a DSM-5 emerging measure: the 12-Item WHO disability assessment schedule (WHODAS) 2.0. Can J Psychiatry. 2016;61(4):227–235. doi: 10.1177/0706743716632514
- Selb M, Kohler F, Robinson Nicol MM, et al. ICD-11: a comprehensive picture of health, an update on the ICD–ICF joint use initiative. J Rehabil Med. 2015;47(1):2–8. doi: 10.2340/16501977-1928
- Ma BH, Chen G, Badji S, et al. Mapping the 12‑item world health organization disability assessment schedule 2.0 (WHODAS 2.0) onto the assessment of quality of life (AQoL)‑4D utilities. Qual Life Res. 2023;33:411–422.
- van Hout B, Janssen MF, Feng YS, et al. Interim scoring for the EQ-5D-5L: mapping the EQ-5D-5L to EQ-5D-3L value sets. Value Health. 2012;15(5):708–715. doi: 10.1016/j.jval.2012.02.008
- Subramaniam M, Abdin E, Vaingankar JA, et al. Validation of the world health organization disability assessment schedule 2.0 among older adults in an Asian country. Singapore Med J. 2020;61(5):246–253. doi: 10.11622/smedj.2019049
- Xie F, Pullenayegum EM, Li SC, et al. Use of a disease-specific instrument in economic evaluations: mapping WOMAC onto the EQ-5D utility index. Value Health. 2010;13(8):873–878. doi: 10.1111/j.1524-4733.2010.00770.x
- Brazier JE, Yang Y, Tsuchiya A, et al. A review of studies mapping (or cross walking) non-preference based measures of health to generic preference-based measures. Eur J Health Econ. 2010;11(2):215–225. doi: 10.1007/s10198-009-0168-z
- Verardi V, Croux C. Robust regression in stata. Stata J. 2009;9(3):439–453. doi: 10.1177/1536867X0900900306
- Wijeysundera HC, Tomlinson AJ, Norris CM, et al. Predicting EQ-5D utility scores from the Seattle Angina Questionnaire in coronary artery disease: a mapping algorithm using a bayesian framework. Med Decis Making. 2011;31(3):481. doi: 10.1177/0272989X10386800
- Austin PC. A comparison of methods for analyzing health-related quality-of-life measures. Value Health. 2002;5(4):329–337. doi: 10.1046/j.1524-4733.2002.54128.x
- Tobin J. Estimation of relationships for limited dependent variables. Econometrica. 1985;26(1):24–36. doi: 10.2307/1907382
- Alava MH, Wailoo AJ. Fitting adjusted limited dependent variable mixture models to EQ-5D. Stata J. 2015;15(3):737–750. doi: 10.1177/1536867X1501500307
- Steiner IM, Bokemeyer B, Stargardt T. Mapping from SIBDQ to EQ-5D-5L for patients with inflammatory bowel disease. Eur J Health Econ. 2023;25(3):539–548. doi: 10.1007/s10198-023-01603-9
- Papaioannou D, Brazier J, Parry G. How valid and responsive are generic health status measures, such as EQ-5D and SF-36, in schizophrenia? A systematic review. Value Health. 2011;14(6):907–920. doi: 10.1016/j.jval.2011.04.006
- Cheung YB, Luo N, Ng R, et al. Mapping the functional assessment of cancer therapy-breast (FACT-B) to the 5-level EuroQoL Group’s 5-dimension questionnaire (EQ-5D-5L) utility index in a multi-ethnic Asian population. Health Qual Life Outcomes. 2014;12(1):180. doi: 10.1186/s12955-014-0180-6