
Article title: WRH-2412 alleviates the progression of hepatocellular carcinoma through regulation of TGF-β/β-catenin/α-SMA pathway
Authors: Mohammed A. F. Elewa, Wagdy M. Eldehna, Ahmed M. E. Hamdan, Samraa H. Abd El-kawi, Asmaa M. El-Kalaawy, Taghreed Majrashi, Reham F. Barghash, Hatem A. Abdel-Azizb, Khalid S. Hashem, Mohammed M. Al-Gayyar
Journal: Journal of Enzyme Inhibition and Medicinal Chemistry
Bibliometrics: Volume 38, Number 1
DOI: https://doi.org/10.1080/14756366.2023.2185761
When the article has been previously published, an incorrect version of the figures were included. The correct version of the figures is as follows:
Figure 1. Chemical structure of WRH-2412.
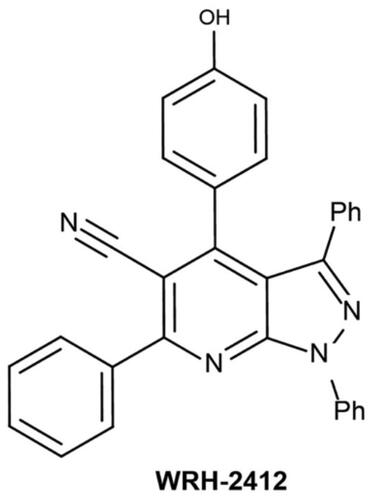
Figure 2. Effect of 5 mg/kg WRH-2412 on survival rate and AFP serum levels in HCC rats. (A) Survival rate represented as Kaplan-Meier curve. (B) AFP serum levels in the experimental groups. Values are presented as the mean ± SEM, *p < 0.05 vs. control; #p ≤ 0.05 vs. HCC group; AFP: α-fetoprotein; HCC: hepatocellular carcinoma; C: control.
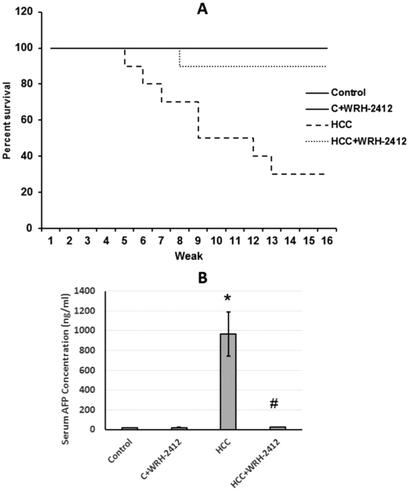
Figure 3. Effect of WRH-2412 on serum liver markers levels in HCC rats. (a) ALT (b) AST levels. Values are expressed as the mean ± SEM, *p < 0.05 vs. control; #p < 0.05 vs. HCC group; ALT: alanine aminotransferase; AST: aspartate aminotransferase; HCC: hepatocellular carcinoma; C: control.
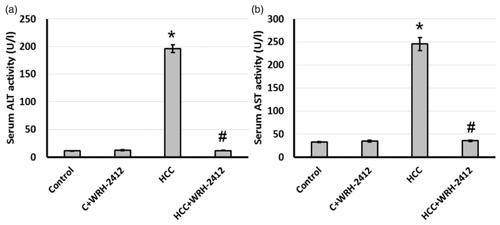
Figure 4. Representative image of hepatic sections stained with H/E. (A) Control group. (B) Control group treated with 5 mg/kg WRH-2412. (C) The liver architecture of HCC group showed massive break down of hepatic tissue together with hyperplastic nodules (Encircled) and apparent heteromorphism. (D) WRH-2412 treated rats showed greatly reduction in these histopathological features in the liver.
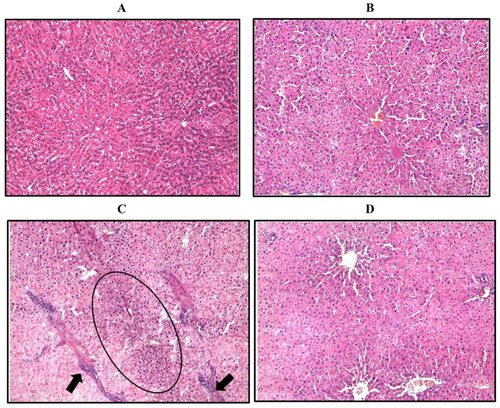
Figure 5. Effect of 5 mg/kg WRH-2412 on TGF-β protein levels (A) as well as liver sections stained with anti- TGF-β antibody in control group (B), control group treated with WRH-2412 (C), HCC group (D) and HCC group treated with WRH-2412 (E). Values are expressed as the mean ± SEM, *p < 0.05 vs. control; #p ≤ 0.05 vs. HCC group. TGF-β: transforming growth factor-β; HCC: hepatocellular carcinoma; C: control.
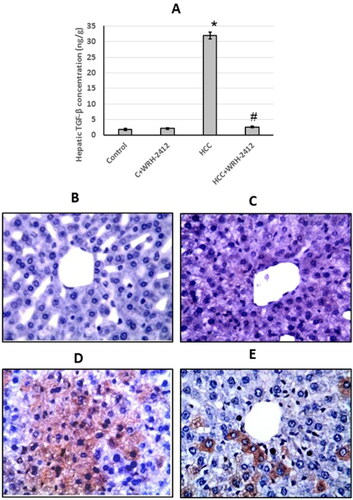
Figure 6. Effect of 5 mg/kg WRH-2412 on hepatic protein level of E-cadherin. Values are expressed as the mean ± SEM, *p < 0.05 vs. control; #p < 0.05 vs. HCC group; HCC: hepatocellular carcinoma; C; control.
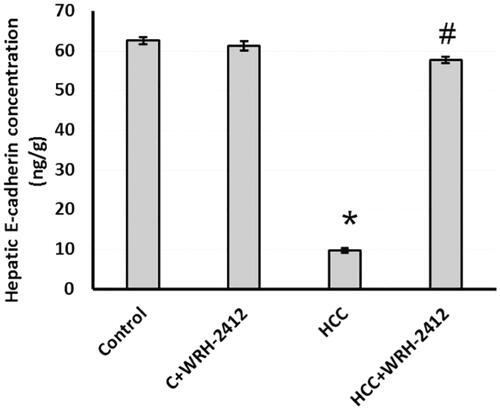
Figure 7. Effect of 5 mg/kg WRH-2412 on β-catenin protein levels (A) as well as liver sections stained with anti- β-catenin antibody in control group (B), control group treated with WRH-2412 (C), HCC group (D) and HCC group treated with WRH-2412 (E). *p < 0.05 vs. control; #p ≤ 0.05 vs. HCC group; HCC: hepatocellular carcinoma; C: control.
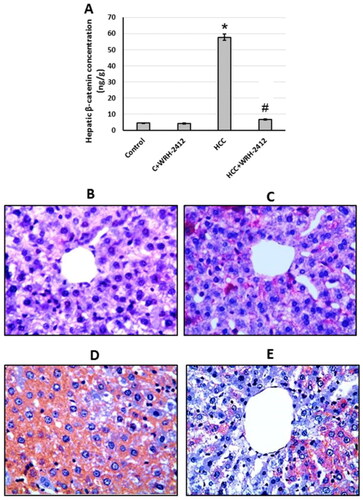
Figure 8. Effect of 5 mg/kg WRH-2412 on hepatic protein level of SMAD4. Values are expressed as the mean ± SEM, *p < 0.05 vs. control; #p < 0.05 vs. HCC group; HCC: hepatocellular carcinoma; C: control.
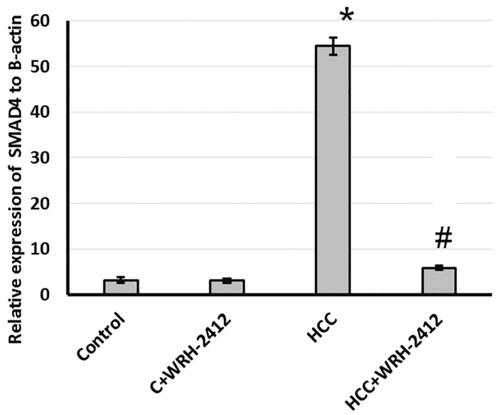
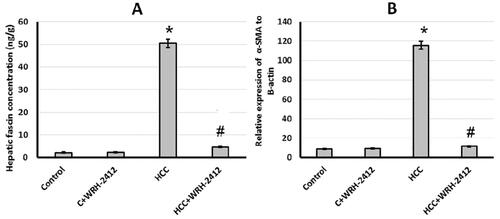
Figure 9. Effect of 5 mg/kg WRH-2412 on vascular invasion markers. (A) Fascin and (B) α-SMA protein levels in the experimental groups. Values are expressed as the mean ± SEM, *p < 0.05 vs. control; #p < 0.05 vs. HCC group; HCC: hepatocellular carcinoma; C: control.
The authors are not responsible for the errors and the online version of this paper has been corrected.