
Abstract
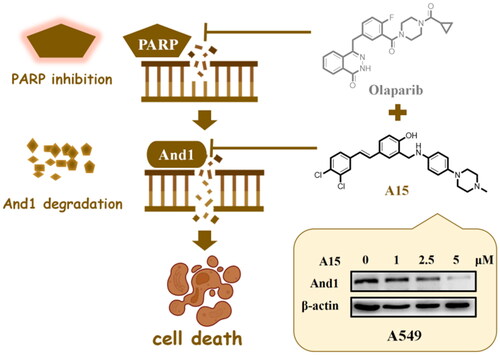
Specifically inducing the degradation of acidic nucleoplasmic DNA-binding protein 1 (And1) is a promising antitumor strategy. Our previous study identified Bazedoxifene (BZA) and CH3 as specific And1 degraders and validated their activity in reversing radiotherapy resistance in vitro and in vivo. However, unelucidated structure-activity relationships and moderate activity have limited their application. In this study, 27 novel CH3 derivatives were designed and synthesised based on the cavity topology of the WD40 domain of And1. Among them, A15 with a “V” conformation significantly induced And1 degradation in NSCLC cells. In addition, this study demonstrated a potential synthetic lethal effect of And1 degraders and PARP1 inhibitors. 1 µM of Olaparib in combination with 5 µM of A15 significantly inhibited the proliferation of A549 and H460 cells. Overall, these compounds are valuable tools for elucidating And1 biology, and their special spatial conformation make them promising candidates for future optimisation studies.
GRAPHICAL ABSTRACT
Introduction
Abnormally enhanced DNA damage response (DDR) is closely associated with tumorigenesis, metastasis and resistance to radiotherapyCitation1,Citation2. The use of DDR inhibitors helps to address three major clinical issues in cancer treatment. Firstly, They broaden the therapeutic range of antitumor drugsCitation1,Citation3. Moreover, DDR inhibitors prevent or reverse resistance to radiotherapy by impeding cellular recovery, as the antitumor efficacy of cytotoxic chemotherapy and radiotherapy, such as cisplatin, derives from their ability to destroy DNACitation2,Citation3. Thirdly, they can kill tumour cells that rely on compensatory mechanisms for DDR through a ‘synthetic lethal’ strategyCitation2,Citation3. PARP inhibitors are currently the most widely used DDR inhibitors in clinical practice. To date, a large number of PARP inhibitors have been identifiedCitation4–6. Although the success of PARP inhibitors in homologous recombination (HR) deficient ovarian, breast and pancreatic cancers has highlighted the potential of DDR inhibitors, their scope of application remains limitedCitation7–9. Therefore, the exploration of other targeted inhibitors of the DDR pathway is promising for the development of antitumour drugs.
Acidic nucleoplasmic DNA-binding protein 1 (And1, also known as WDHD1) contains the WD40 repeat (WD-repeat) and the high mobility histone box (HMG-box) domains, and possesses both of these protein family propertiesCitation10. It has been shown that And1 plays an important role in DNA damage repairCitation11–14. DNA double strand breaks (DSBs) are the most lethal type of DNA damage, and failure to repair DSBs usually results in genomic mutations or cell death. The two classical pathways for DSBs repair are HR and classical non-homologous end joining (cNHEJ). HR is preferred because of its high fidelity in repairing the genomeCitation15. And1 was found to have a dual role in HR repair, one of recruiting CtIP to DSB sites and the other of participating in Chk1 activation in cells with replicative stress. In the HR repair approach, the tumour suppressor protein CtIP is essential for DSB end resection and is recruited to DSB sites in an MRN (MER11-RAD50-NBS1)-dependent mannerCitation16. And1 regulates DSB end resection and DNA damage repair by forming complexes with CtIP and other repair proteins that recruit CtIP to DSB sitesCitation17. Thus, targeted degradation of And1 can produce a “BRCAness” phenotype, in which a HR repair defect in a tumour relates to and phenocopies BRCA1 or BRCA2 loss-of-function mutations. This “BRCAness” phenotype can be associated with PARP inhibition leading to a “synthetic lethal” effectCitation18. In addition, it was found that And1 was highly expressed in various tumours, such as cervical, ovarian, laryngeal squamous, lung, and oesophageal cancersCitation19–23. Together, these suggest that And1 is an promising therapeutic target for tumour therapy.
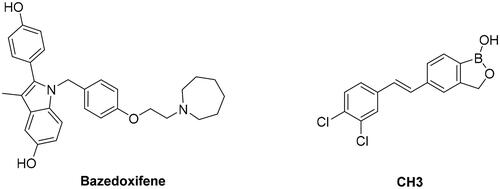
To the best of our knowledge, And1 inhibitors are still in their infancy, and only one case of peptide has been reportedCitation24. Recently, we have screened two efficient And1 degraders, Bazedoxifene (BZA) and CH3, based on a high-throughput screening platform (). Specifically, by interacting with the And1 WD40 domain, BZA and CH3 blocked And-1 polymerisation, thereby facilitating the interaction of And1 with the E3 ligase Cullin4B (CUL4B), which ultimately led to its degradation by ubiquitinationCitation25. Thus, this class of inhibitors are characterised by the fact that they are also degraders of And1. Our further study also found that BZA and CH3 resensitised platinum-resistant ovarian cancer to platinum drugs in vitro and in vivo and enhanced the sensitivity of NSCLC cells to radiotherapyCitation26.
Figure 1. Structures of the two And1 degraders.
Here, we carried out structural optimisation of CH3, expecting to explore for structure-activity relationships (SAR) of And1 degraders and pave the way for mechanism and functional studies of And1. As we all know, NSCLC can be divided into adenocarcinoma, squamous cell carcinoma, and large cell carcinoma. The adenocarcinoma cell line A549 and the large cell lung cancer cell line H460 were selected for in vitro evaluation of the compounds in this study, which will make the study more generalisable. In this study, Western Blot was used to initially evaluate the effects of the compounds on And1 expression. The novel piperazine-substituted stilbene derivatives exhibited good in vitro activity. We envisage that the small-molecule degraders developed in this study will be valuable tools for uncovering the molecular biology of And1.
Design rationale
Molecular docking results showed that compound CH3 was inserted obliquely into a circular cavity pocket of the And1 WD40 domainCitation25. In this case, the two chlorine atoms reached into two different β-folded voids, while the polar boronic acid group may form a triple hydrogen bond with the surrounding VAL-19, CYS-20, and GLY-278. This binding mode has been precisely justified by our previous protein thermal shift techniques, targeted mutagenesis, and boronic acid-specific chelating probesCitation25. However, the low efficiency of boronazole synthesis hindered the subsequent structural modification and SAR studies. The circular cavity of the WD40 domain has a diameter of about 20 Å and a depth of about 10 Å, which can accommodate larger groups. We hypothesised that the introduction of a group adjacent to the polar head of the molecule would lead to a “V” conformation that would be more conducive to its incorporation into the WD40 circular cavity. Taken together, we designed and synthesised a series of benzylamine derivatives based on the stilbene skeleton with two chlorine atoms.
Results and discussion
Chemistry
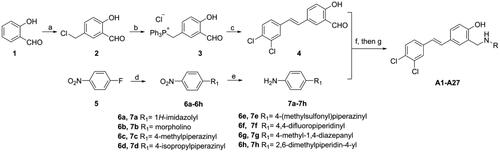
Using salicylaldehyde as starting material (Scheme 1), Blanc reaction can smoothly introduce chloromethyl group in the para position of phenolic hydroxyl group to obtain intermediate 2Citation27. Then the phosphine salt 3 was prepared smoothly. The Wittig reaction was used to construct the stilbene skeleton to give intermediate 4. Another class of aniline intermediates, 7a–7h, were obtained from p-fluoronitrobenzene by a nucleophilic aromatic substitution reaction introducing different substituents, followed by reduction of the nitro group with SnCl2. Finally, the target compounds can be efficiently prepared by reductive amination reaction.
Scheme 1. Synthesis of compounds A1-A27a. aReagents and conditions: (a) paraformaldehyde, HCl, 25 °C, 24 h; (b) PPh3, ACN, 80 °C, 3 h; (c) EtONa, EtOH, 75 °C, 3 h; (d) amine, K2CO3, DMF, 100 °C, 1.5–3 h; (e) SnCl2, HCl, EtOH, 60 °C, 2–4 h; (f) RNH2, EtOH, 70 °C, 1 h; (g) NaBH4, MeOH/THF, rt, 30 min.
Evaluation of degradation activity on And1
Initially, we screened 11 different types of substituents (A01–A11), which differed in several properties: substituent size, hydrophobicity, aromaticity, and acidity (). Western Blot results suggested that substituents such as hydroxyethyl (A01), cyclopentyl (A02), and phenyl (A09) rendered the compounds inactive. Isopropyl (A03), furanomethyl (A04), and methoxycarbonyl (A05) had weak inhibitory activity (). We noticed that the compounds had enhanced degradation activity against And1 when basic imidazole (A07) or morpholine (A08) was introduced in the para position of the benzene ring, while the compound was weakly active when carboxyl was introduced in the para position of the benzene (A11).
Figure 2. Structure formula and activity evaluation of compounds. (A) Compounds containing different substituents. (B) Quantification of And1 by gray-scale analysis. The expression of And1 was determined after 48 h treatment with DMSO or compounds A1–A27 (10 µM) by Western Blot (supplemental Figure S1). The Control group was normalised. The tests were conducted three times, and data were shown as mean ± the standard error of the mean (SEM); p values were calculated by two-sided Student’s t-test. *(p ≤ 0.05), **(p ≤ 0.01), ***(p ≤ 0.005), ****(p ≤ 0.001).
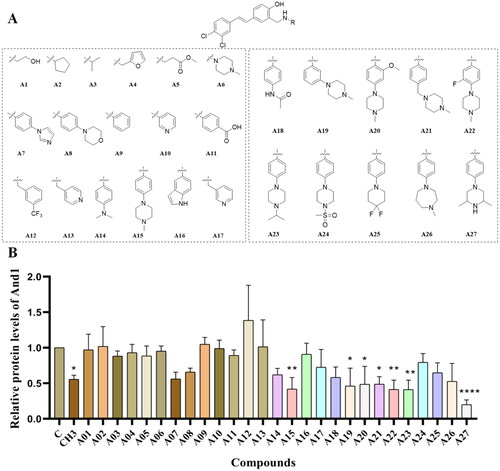
Therefore, in the next screening, we preferred to synthesise derivatives with basic substituents. To our delight, compounds introducing dimethylamino (A14) or 1-methylpiperazinyl (A15) in the para-position of the benzene showed better activity than CH3. In contrast, compounds substituted with indole (A16), pyridine (A13, A17), and 4-acetamidophenyl (A18) were weaker than A15, which may depend on the interaction of the compounds with the amino acid residues. Therefore, we synthesised a series of A15-based piperazine-derived compounds to investigate the pattern of activity changes of these compounds. First, when we shifted the 1-methylpiperazine group from the para-position of the benzene to the meta-position, the compound still showed good degradation activity (A19). When a carbon atom was inserted between the 1-methylpiperazine group and the benzene, the activity of the compound was retained. The introduction of methoxy (A20) or fluorine (A22) on the benzene did not have much effect on the activity of the compounds. These results suggested that the 1-methylpiperazinyl group may act in the flexible loop region of And1, and small changes in positions have little effect on the activity of the compounds. Subsequently, five piperazine fragments with different substituents were synthesised by us to explore their effect on activity. The results showed that the compound remained relatively active when the methyl group was transformed to isopropyl (A23), while the compound almost lost their activity when it was changed to methylsulfonyl (A24). Our results also showed that the activity of the compounds were retained when transforming 1-methylpiperazinyl to 4, 4-difluoropiperidinyl (A25) or homopiperazinyl (A26). In our experiments, we found that the 2,6-dimethylpiperazine-substituted compound (A27) was cytotoxic to human epithelial cells, so we chose A15 for further study.
Degradation activities
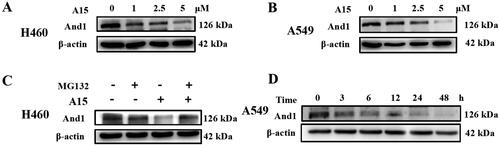
Subsequently, we carried out preliminary degradation kinetic studies (). The degradation of And1 by A15 was dose-dependent in H460 () and A549 () cells. Gray scale analysis revealed that degradation of And1 was observed at 1 µM administered concentration. A15 at 5 µM reduced And1 levels in H460 and A549 by 38% and 19%, respectively. To verify whether the degradation of And1 by A15 was dependent on the ubiquitin-proteasome pathway, we administered A15 concomitantly with the proteasome inhibitor MG132. The results showed that MG132 blocked the degradation of And1 by A15 (). Then, the time course of And1 degradation induced by A15 was determined (). At a dosing concentration of 10 µM, degradation of And1 was observed at 3 h. As the duration of action was prolonged, up to 48 h, And1 was significantly degraded.
Figure 3. Degradation kinetics of compound A15. (A, B) A15 degrades the And1 in a dose-dependent manner in H460 (A) and A549 (B) cells at 48 h. (C) Degradation of And1 by A15 can be intercepted by the proteasome inhibitor MG132. (D) Degradation of And1 by A15 (10 µM) at 0–48 h.
Molecular simulation and binding pattern analysis
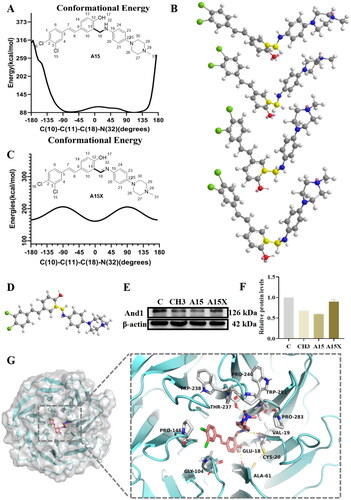
Potential energy surface scanning based on the molecular force field is able to visualise the energy variation with conformation of the active moleculeCitation28. The results suggested that the molecular conformation of A15 mainly depends on the dihedral angle formed by the rotatable bond C11-C18-N32, and the “V” conformation from −90° to 90° was a stable low-energy conformation (). As a comparative study, our team constructed the conformationally restricted variant A15X (), replacing the flexible benzylamine with a rigid imine. Western blotting experiments demonstrated that the A15X no longer had And1 degradation activity (). Potential energy surface scanning based on the MM2 force field revealed that A15X was dominated by a “linear” conformation (), and its “V” conformation had a potential energy of 205.73 kcal/mol (), which was much higher than that of 95.36 kcal/mol for A15. Molecular simulation studies predicted that A15 was folded and integrated to the circular cavity pocket of the WD40 domain in a precisely “V” shaped conformation. Its hydroxyl group formed hydrogen bonds with GLU18 and ALA61, while the amino group formed a hydrogen bond with VAL19. The two chlorine atoms still extended to the sides of the β-folded blade, and the piperazine extended to the flexible loop region on the outside of the pocket ().
Figure 4. Molecular simulation and binding pattern analysis of A15. (A) Potential energy surface scan of compound A15 based on the MM2 force field. (B) The conformation of A15 corresponding to the dihedral angles formed by C(10)-C(11)-C(18)-C(32) at −70°, −25°, 45°, and 90°. (C) Potential energy surface scan of compound A15X. (D) The conformation of A15X at the lowest potential energy. (E) Western Blot of And1 after 10 µM treatment with A15/A15X in A549. (F) Quantification of And1 in (E) by gray-scale analysis. (G) Predicted binding modes of A15 with And1 (PDB code: 5GVA).
Molecular docking results showed that A15X could not bind intact to the WD40 domain and the stilbene structure had extended to the outside of the pocket due to the rigidity of the structure. In addition, it can be seen from the model that the piperazine moiety in A15X did not form any hydrogen bonds with And1 (supplemental Figure S2). Unlike A15, compound A11 with an acidic substituent had a different binding pattern. The benzoic acid fragment of A11 extended to the outside of the pocket and its amino no longer forms a hydrogen bond with And1 (supplemental Figure S3). The introduction of the methylsulfonyl group prompted the amino group of A24 to no longer form hydrogen bonding interactions with the protein (supplemental Figure S4).
In vitro anti-tumour activity
Next, we tested the “synthetic lethal” effect of A15 in combination with PARP1 inhibitor in lung cancer cells. Olaparib is a clinically approved inhibitor targeting PARP1, a key enzyme in DNA single-strand damage repair, for the treatment of advanced ovarian cancer associated with BRCA deficiency. The detection of cell proliferation ability is an important module of cell function assay. To verify the “synthetic lethal” effect of compound A15 combined with the PARP1 inhibitor Olaparib on the proliferative ability of human lung cancer cell lines A549 and H460, we used the CCK-8 to assess cell viability (). Meanwhile, we plotted the changes in cell viability of different groups over time into proliferation curves (). From the proliferation curves, it can be visualised that neither Olaparib nor A15 alone had significant proliferation inhibitory activity on these two types of cells compared with the control group. In contrast, the combination of Olaparib and A15 showed significant proliferation inhibition on both cells, and the activity was superior to the combination of Olaparib and CH3.
Figure 5. Effects of Olaparib, A15, and the combination of both on lung cancer cell proliferation. (A, B) CCK-8 detects the proliferation of Olaparib (1 µM), A15 (5 µM) or both of them in combination on A549 or H460 cells. (C, D) Proliferation curves for Olaparib (1 µM), A15 (5 µM), Olaparib (1 µM)+A15 (5 µM) and Olaparib (1 µM)+CH3 (5 µM) on A549 (C) or H460 (D) cells. The tests were conducted three times, and data were shown as mean ± the standard error of the mean (SEM).
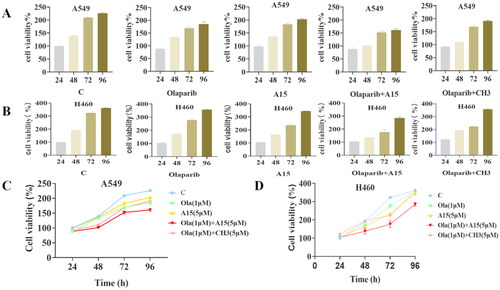
We used the CDI (coefficient of drug in interaction) to evaluate the synergistic nature of the two drugsCitation29, and the CDI was calculated according to the following formula: CDI = AB/A × B. AB is the ratio of the number of viable cells (absorbance value) in the combination group to that in the control group, and A (B) is the ratio of the number of viable cells (absorbance value) in the group of the drug alone to that in the control group. At 48 h, the CDI of Olaparib and A15 co-administration on the inhibition of A549 cell proliferation was 0.77, which was less than 1, proving the obvious synergistic effect of the two drugs. Similarly, the CDI value of Olaparib co-administered with A15 on the proliferation inhibition of H460 cells was 0.92, which also showed some synergistic effect. Thus, the proliferation curves visually depict that A15 has a synergistic effect with Olaparib in A549 and H460 cells.
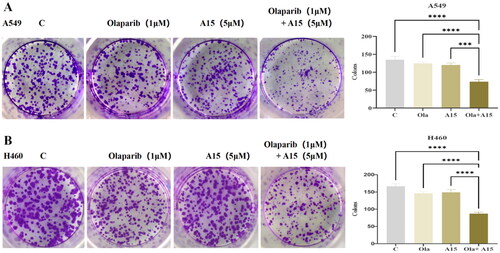
Cell clone formation assay is another technique that can reflect the proliferative and invasive capacity of cells. In this study, the effects of compound A15 combined with Olaparib on clone formation of A549 and H460 cell lines were tested (). The results showed that A15 or Olaparib alone had little or no inhibitory effect on clone formation in both cell lines compared to the control group. However, the combination of 1 µM Olaparib and 5 µM A15 reduced clone formation in both cell lines by 50% with statistically significant differences.
Figure 6. The effect of compound A15 (5 µM) combined with Olaparib (1 µM) on clone formation of A549 (A) and H460 (B), and the quantitative analysis is represented by the bar chart. The significance analysis was performed using the one-way ANOVA. (***p < 0.001, ****p < 0.0001 compared with different groups). The error bars represent mean ± s.d.
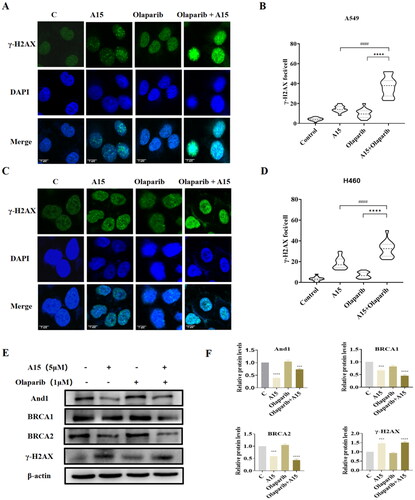
In order to further explore the potential synthetic lethal effect of And1 degraders and PARP-1 inhibitors, we used immunofluorescence detection to stain γ-H2AX. Obviously, the number of γ-H2AX focus formation significantly increased in NSCLC cells treated with A15 and Olaparib, which indicated that the combination of the two compounds increased the damage of DNA (). Next, we used Western-blot to detect the key protein BRCA1/BRCA2 involved in HR repair. The results showed that A15 significantly reduced the expression of BRCA1/BRCA2, which can also be observed in the combination of the two compounds (). The γ-H2AX was also observed to have a certain trend of upregulated expression (). Thus, targeted degradation of And1 can produce a “BRCAness” phenotype, and this defect actuate sensitivity of non BRCA-mutant tumour cells to PARP1 inhibitors.
Figure 7. Effects of Olaparib, A15, and the combination of both on DNA damage and HR repair in NSCLC cells. (A, B) Immunofluorescence assay to detect the effect of the combination of A15 (5 µM) and Olaparib (1 µM) on focal γ-H2AX content in A549 cells (A, scale bar: 5 μm) and quantification plots (B, mean ± SD, n = 3, > 100 cells counted in each independent experiment, ****p < 0.0001, ####p < 0.0001). (C, D) Immunofluorescence assay to detect the effect of the combination of A15 and Olaparib on focal γ-H2AX content in H460 cells (C, scale bar: 5 μm) and quantification plots (D, mean ± SD, n = 3, > 100 cells counted in each independent experiment, ****p < 0.0001, ####p < 0.0001). (E, F) The expression of And1, BRCA1, BRCA2, and γ-H2AX in A549 cell were determined after 48 h treatment with Olaparib (1 µM), A15 (5 µM), and the combination of both by Western Blot (E) and quantification plots (F, mean ± SD, n = 3, ***p < 0.001, ****p < 0.0001).
Conclusions
This study validated a potential synthetic lethal effect of And1 degraders and PARP1 inhibitors at the cellular level. PARP1 inhibitors for cancer therapy have experienced rapid growth, and many of them are being evaluated in clinical trials for the treatment of solid tumours, including (non) small-cell lung cancer, prostate cancer, and gastric cancerCitation30,Citation31. However, the narrow applicability of PARP1 inhibitors and acquired resistance limit their further application in cancer. Through synergistic or compensatory mechanisms, combination therapies have the potential to overcome resistance to PARP1 inhibitors by inhibiting the restoration of HR function and glycoprotein transport. And1, as a critical adaptor involved in HR, has a wide range of potential applicationsCitation31,Citation32.
To date, the research on And1 inhibitors are still in their infancy. There are still no reports of efficient and specific screening models for other And1 inhibitors or degraders. As in this study, Western Blot was used to screen the compounds, which is a low-sensitivity and inefficient screening method. Undeniably, the inhibition of And1 function by these degraders are complete and will accelerate the understanding of the druggability of this target. Efficient and specific screening systems for And1 inhibitors will be desirable.
In conclusion, we rationally designed and synthesised a class of stilbene analogs with “V” conformation based on the cavity topology of the WD40 domain of And1. In vitro studies showed that compound A15 significantly induced And1 degradation in A549 and H460 cells in a dose-dependent manner. Combining 5 µM of compound A15 with 1 µM of the PARP1 inhibitor Olaparib significantly inhibited the proliferation of A549 and H460 cells. Furthermore, A15 and PARP-1 inhibitor can inhibit the HR repair in NSCLC cells, resulting in an increase DNA damage. We expect this class of compounds to be promising tools for studying And1 function.
Experimental section
Chemistry
General methods: All the reagents and solvents were purchased from Energy Chemical (Shanghai, China) and used without further purification unless otherwise mentioned. A thin layer chromatography (TLC) system for routine monitoring the course of reactions and confirming the purity of analytical samples employed aluminum-backed silica gel plates.1H and 13C NMR spectra were recorded on Bruker Magnet System (300 MHz) or Bruker Avance III-400 (400 MHz) NMR spectrometer at room temperature. NMR chemical shifts were expressed in δ (ppm) relative to internal solvent and coupling constants were measured in Hz. The splitting patterns were described as follows: s (singlet), bs (broad singlet), d (doublet), t (triplet), q (quartet), and m (multiplet). High-resolution mass spectra (HRMS) were obtained using electrospray ionisation (ESI) on a time of flight (TOF) mass spectrometer. A list of structural identification information for the compounds is given in supplemental Table S1. Purities of final compounds were established by analytical HPLC (>95%), which was carried out on a Waters HPLC system using Agilent ZORBAXSB-Aq column (4.6 × 250 mm, 5-Micron) with detection at 254 nm on PDA, flow rate = 1.0 mL/min, the 45% acetonitrile aqueous solution (0.1% TFA) over 25 min. A list of purity information for compounds detected by HPLC is shown in Table S2.
5-(Chloromethyl)-2-hydroxybenzaldehyde (2)
A solution of paraformaldehyde (24.4 g, 0.2 mol) in concentrated hydrochloric acid (80 ml) was stirred at room temperature for 10 min, and salicylaldehyde (17.95 g, 0.6 mol) was added dropwise over 30 min. The reaction solution was stirred at room temperature for 24 h to give a white precipitate of liquid. The slurry was filtered to give a white solid and the filter cake was washed with cold water. Recrystallization from n-hexane (310 ml) gave white crystals (16.80 g, 49.4%). 1H NMR (400 MHz, DMSO-d6) δ 10.91 (s, 1H), 10.27 (s, 1H), 7.72 (d, J = 2.4 Hz, 1H), 7.59 (dd, J = 8.5, 2.4 Hz, 1H), 7.03 (d, J = 8.5 Hz, 1H), 4.76 (s, 2H).
(3-formyl-4-hydroxybenzyl)triphenylphosphonium chloride (3)
Compound 2 (15.5 g, 91.2 mmol) and triphenylphosphine (30.98 g, 118.1 mmol) were dissolved in 220 ml of dry acetonitrile. The reaction solution was stirred at 80 °C for 3 h under a nitrogen atmosphere. The acetonitrile was evaporated under reduced pressure, and the residue was washed with petroleum ether (100 mL × 3) to afford white powder (38.52 g, 97.8%). 1H NMR (400 MHz, DMSO-d6) δ 11.23 (s, 1H), 10.17 (s, 1H), 7.98 − 7.86 (m, 3H), 7.72 (dtd, J = 12.2, 8.3, 2.5 Hz, 12H), 7.22 (t, J = 2.6 Hz, 1H), 7.06 (m, 2H), 5.16 (d, J = 15.0 Hz, 2H).
(E)-5–(3,5-dichlorostyryl)-2-hydroxybenzaldehyde (4)
Sodium (0.19 g, 8.26 mmol) was dissolved in anhydrous ethanol (30 ml) under nitrogen. The phosphonium salt (1.20 g, 2.78 mmol) was added to this solution, followed by the addition of 3,4-dichlorobenzaldehyde (0.57 g, 3.26 mmol). The solution was stirred at 75 °C for 3 h. The mixture was poured into water, and the pH was adjusted to be acidic with dilute hydrochloric acid to precipitate a yellow solid. The crude solid was purified by silica chromatography to afford compound 4 as a yellow solid (0.387 g, 44.4%). 1H NMR (400 MHz, DMSO-d6) δ 10.92 (s, 1H), 10.31 (s, 1H), 7.87 (d, J = 1.9 Hz, 2H), 7.80 (dd, J = 8.6, 2.3 Hz, 1H), 7.61 (d, J = 8.4 Hz, 1H), 7.57 (dd, J = 8.4, 1.8 Hz, 1H), 7.37 (d, J = 16.5 Hz, 1H), 7.13 (d, J = 16.5 Hz, 1H), 7.05 (d, J = 8.6 Hz, 1H). 13C NMR (101 MHz, DMSO) δ 191.43, 161.22, 138.63, 134.57, 131.94, 131.14, 130.08, 129.72, 128.62, 128.24, 127.64, 126.74, 124.80, 122.89, 118.30.
General procedure to prepare 6a–6h
p-Fluoronitrobenzene (1.0 eq) was dissolved in 5 mL of anhydrous DMF, followed by the addition of amines (1.05 eq) and K2CO3 (2.0 eq), and the solution was stirred at 100 °C for 2 h. The feedstock was consumed as monitored by TLC. The reaction solution was cooled to room temperature and 100 ml of water was added. The slurry was filtered to give a yellow solid and the filter cake was washed with water. It was dried to give a yellow solid (90%-96%).
1–(4-nitrophenyl)-1H-imidazole (6a)
Yellow solid, 96% yield; 1H NMR (300 MHz, DMSO-d6) δ 8.55 − 8.49 (m, 1H), 8.40 − 8.37 (m, 1H), 8.37 − 8.33 (m, 1H), 8.03 − 7.99 (m, 1H), 7.99 − 7.95 (m, 2H), 7.22 − 7.17 (m, 1H).
4–(4-nitrophenyl)morpholine (6b)
Yellow solid, 92% yield; 1H NMR (300 MHz, DMSO-d6) δ 8.07 (d, J = 9.5 Hz, 2H), 7.03 (d, J = 9.5 Hz, 2H), 3.81 − 3.68 (m, 4H), 3.51 − 3.35 (m, 4H).
1-methyl-4–(4-nitrophenyl)piperazine (6c)
Yellow solid, 92% yield; 1H NMR (300 MHz, DMSO-d6) δ 8.05 (d, J = 9.5 Hz, 2H), 7.03 (d, J = 9.5 Hz, 2H), 3.49 − 3.38 (m, 4H), 2.48 − 2.38 (m, 4H), 2.22 (s, 3H).
1-isopropyl-4–(4-nitrophenyl)piperazine (6d)
Yellow solid, 91% yield; 1H NMR (300 MHz, DMSO-d6) δ 8.04 (d, J = 9.5 Hz, 2H), 7.01 (d, J = 9.5 Hz, 2H), 3.51 − 3.37 (m, 4H), 2.68 (dt, J = 13.1, 6.5 Hz, 1H), 2.60 − 2.52 (m, 4H), 0.99 (d, J = 6.5 Hz, 6H).
1-(Methylsulfonyl)-4–(4-nitrophenyl)piperazine (6e)
Yellow solid, 95% yield; 1H NMR (300 MHz, DMSO-d6) δ 8.09 (d, J = 9.5 Hz, 2H), 7.08 (d, J = 9.5 Hz, 2H), 3.66 − 3.53 (m, 4H), 3.30 − 3.19 (m, 4H), 2.93 (s, 3H).
4,4-difluoro-1–(4-nitrophenyl)piperidine (6f)
Yellow solid, 93% yield; 1H NMR (300 MHz, DMSO-d6) δ 8.07 (d, J = 9.4 Hz, 2H), 7.11 (d, J = 9.5 Hz, 2H), 3.75 − 3.54 (m, 4H), 2.05 (ddd, J = 19.9, 14.1, 5.8 Hz, 4H).
1-methyl-4–(4-nitrophenyl)-1,4-diazepane (6 g)
Yellow solid, 91% yield; 1H NMR (300 MHz, DMSO-d6) δ 8.03 (d, J = 9.5 Hz, 2H), 6.82 (d, J = 9.6 Hz, 2H), 3.73 − 3.61 (m, 2H), 3.57 (t, J = 6.2 Hz, 2H), 2.68 − 2.58 (m, 2H), 2.49 − 2.40 (m, 2H), 2.25 (s, 3H), 1.97 − 1.81 (m, 1H).
3,5-dimethyl-1–(4-nitrophenyl)piperazine (6h)
Yellow solid, 90% yield; 1H NMR (300 MHz, DMSO-d6) δ 8.03 (d, J = 9.5 Hz, 2H), 7.01 (d, J = 9.6 Hz, 2H), 3.89 (dd, J = 12.4, 2.0 Hz, 2H), 2.76 (ddd, J = 9.2, 6.3, 2.8 Hz, 2H), 2.38 (dd, J = 12.2, 10.8 Hz, 2H), 2.30 (s, 1H), 1.03 (d, J = 6.3 Hz, 6H).
General procedure to prepare 7a–7h
Compound 6a–6h (1.0 eq) was dissolved in 15 ml of ethanol, SnCl2-2H2O (3.0 eq) and concentrated hydrochloric acid (4.5 ml) were added to the suspension and stirred at 60 °C for 4 h. The feedstock was consumed as monitored by TLC. The reaction was cooled to room temperature and the pH was adjusted to alkaline with sodium hydroxide solution. The mixture was extracted with dichloromethane (50 mL × 3), and the organic layers were combined and dried over anhydrous Na2SO4, concentrated in vacuo to afford the product (82–93%).
4-(1H-imidazol-1-yl)aniline (7a)
Gray solid, 93% yield; 1H NMR (300 MHz, DMSO-d6) δ 7.97 (s, 1H), 7.49 (s, 1H), 7.23 (d, J = 8.8 Hz, 2H), 7.03 (s, 1H), 6.67 (d, J = 8.8 Hz, 2H), 5.29 (s, 2H).
4-morpholinoaniline (7b)
Gray-brown solid, 82% yield; 1H NMR (300 MHz, DMSO-d6) δ 6.69 (d, J = 8.8 Hz, 2H), 6.51 (d, J = 8.8 Hz, 2H), 4.58 (s, 2H), 3.79 − 3.61 (m, 4H), 2.97 − 2.77 (m, 4H).
4–(4-methylpiperazin-1-yl)aniline (7c)
Gray solid, 92% yield; 1H NMR (300 MHz, DMSO-d6) δ 6.68 (d, J = 8.8 Hz, 2H), 6.49 (d, J = 8.8 Hz, 2H), 4.55 (s, 2H), 2.97 − 2.82 (m, 4H), 2.48 − 2.35 (m, 4H), 2.20 (s, 3H).
4–(4-isopropylpiperazin-1-yl)aniline (7d)
Gray solid, 86% yield; 1H NMR (300 MHz, DMSO-d6) δ 6.68 (d, J = 8.7 Hz, 2H), 6.51 (d, J = 8.7 Hz, 2H), 4.53 (s, 2H), 2.96 − 2.83 (m, 4H), 2.65 (dt, J = 13.0, 6.5 Hz, 1H), 2.59 − 2.52 (m, 4H), 1.00 (d, J = 6.5 Hz, 6H).
4–(4-(Methylsulfonyl)piperazin-1-yl)aniline (7e)
Gray solid, 91% yield; 1H NMR (300 MHz, DMSO-d6) δ 6.73 (d, J = 8.7 Hz, 2H), 6.52 (d, J = 8.7 Hz, 2H), 4.65 (s, 2H), 3.31 − 3.17 (m, 4H), 3.11 − 2.95 (m, 4H), 2.91 (s, 3H).
4–(4,4-difluoropiperidin-1-yl)aniline (7f)
Gray-brown solid, 83% yield; 1H NMR (300 MHz, DMSO-d6) δ 6.75 (d, J = 8.8 Hz, 2H), 6.51 (d, J = 8.8 Hz, 2H), 4.64 (s, 2H), 3.02 (m, 4H), 2.04 (ddd, J = 19.9, 14.1, 5.7 Hz, 4H).
4–(4-methyl-1,4-diazepan-1-yl)aniline (7 g)
Gray-brown solid, 82% yield; 1H NMR (400 MHz, DMSO-d6) δ 6.52 − 6.44 (m, 4H), 3.96 (s, 2H), 3.40 − 3.33 (m, 2H), 3.29 (t, J = 6.3 Hz, 2H), 2.61 − 2.54 (m, 2H), 2.47 − 2.40 (m, 2H), 2.25 (s, 3H), 1.88 − 1.81 (m, 2H).
4–(3,5-dimethylpiperazin-1-yl)aniline (7h)
Gray solid, 87% yield; 1H NMR (300 MHz, DMSO-d6) δ 6.66 (d, J = 8.8 Hz, 2H), 6.48 (d, J = 8.8 Hz, 2H), 4.52 (s, 2H), 3.21 (d, J = 2.1 Hz, 1H), 3.17 (d, J = 2.1 Hz, 1H), 2.84 (ddd, J = 9.2, 6.3, 2.8 Hz, 2H), 1.97 (t, J = 10.6 Hz, 2H), 0.98 (d, J = 6.3 Hz, 6H).
General procedure to prepare A1–A27
Compound 4 (1.0 eq) and compound 7a–7h (1.0 eq) were dissolved in 10 mL of anhydrous ethanol and refluxed for 3–5 h. A large amount of dark coloured precipitate was generated. The reaction was monitored by TLC until its completion. The solution was transferred to room temperature, 2 mL of tetrahydrofuran was added additionally, followed by the addition of NaBH4 (5.0 eq), and the reaction was stirred for 5–8 h. Water was slowly added to the reaction mixture, diluted with dichloromethane (50 mL) and washed with saturated brine (30 ml × 2). The organic layer was dried by anhydrous Na2SO4, filtered, and the solvent was removed under reduced pressure. The crude residue was purified by flash column chromatography (DCM/MeOH = 50:1–10:1) on silica gel to afford the desired compound A1–A27 in 56 − 80% yield.
(E)-4–(3,4-dichlorostyryl)-2-(((2-hydroxyethyl)amino)methyl)phenol (A1)
Yellow solid, 80% yield; HRMS (ESI) m/z Cald for C17H16Cl2NO2 [M–H]− = 336.0558, found 336.0567; 1H NMR (300 MHz, DMSO-d6) δ 7.82 (d, J = 1.5 Hz, 1H), 7.55 (dt, J = 8.4, 5.1 Hz, 2H), 7.42 − 7.31 (m, 2H), 7.26 (d, J = 16.4 Hz, 1H), 7.00 (d, J = 16.4 Hz, 1H), 6.73 (d, J = 8.2 Hz, 1H), 3.87 (s, 2H), 3.51 (t, J = 5.6 Hz, 2H), 2.62 (t, J = 5.6 Hz, 2H). 13C NMR (101 MHz, DMSO-d6) δ 158.54, 139.16, 131.89, 131.48, 131.16, 129.15, 127.93, 127.67, 127.57, 127.40, 126.50, 124.78, 122.78, 116.23, 60.20, 50.86, 50.72.
(E)-2-((cyclopentylamino)methyl)-4–(3,4-dichlorostyryl)phenol (A2)
Yellow solid, 75% yield; HRMS (ESI) m/z Cald for C20H19Cl2NO [M–H]− =360.0922, found 360.0930; 1H NMR (300 MHz, DMSO-d6) δ 7.81 (d, J = 1.7 Hz, 1H), 7.55 (dt, J = 8.5, 5.1 Hz, 2H), 7.33 (d, J = 7.7 Hz, 2H), 7.26 (d, J = 16.5 Hz, 1H), 7.00 (d, J = 16.4 Hz, 1H), 6.70 (d, J = 8.3 Hz, 1H), 3.85 (s, 2H), 3.08 − 2.97 (m, 1H), 1.86 − 1.35 (m, 8H). 13C NMR (101 MHz, DMSO-d6) δ 158.99, 139.17, 131.89, 131.50, 131.15, 129.13, 127.92, 127.48, 127.37, 127.33, 126.49, 124.85, 122.72, 116.32, 58.79, 49.89, 32.28, 23.85.
(E)-4–(3,4-dichlorostyryl)-2-((isopropylamino)methyl)phenol (A3)
Yellow solid, 77% yield; HRMS (ESI) m/z Cald for C18H18Cl2NO [M–H]− = 334.0765, found 334.0775; 1H NMR (300 MHz, DMSO-d6) δ 7.81 (d, J = 1.7 Hz, 1H), 7.54 (dt, J = 8.5, 5.1 Hz, 2H), 7.33 (d, J = 8.4 Hz, 2H), 7.26 (d, J = 16.5 Hz, 1H), 7.00 (d, J = 16.4 Hz, 2H), 6.70 (d, J = 8.0 Hz, 1H), 3.88 (s, 2H), 2.75 (dt, J = 12.6, 6.3 Hz, 1H), 1.06 (d, J = 6.3 Hz, 6H). 13C NMR (101 MHz, DMSO-d6) δ 159.13, 139.18, 131.89, 131.51, 131.15, 129.12, 127.91, 127.42, 127.27, 126.48, 124.91, 122.68, 116.35, 48.78, 47.87, 22.50.
(E)-4–(3,4-dichlorostyryl)-2-(((furan-2-ylmethyl)amino)methyl)phenol (A4)
Yellow solid, 66% yield; HRMS (ESI) m/z Cald for C20H16Cl2NO2 [M–H]− = 372.0558, found 372.0566; 1H NMR (300 MHz, DMSO-d6) δ 7.83 (d, J = 1.5 Hz, 1H), 7.64 − 7.51 (m, 3H), 7.44 − 7.31 (m, 2H), 7.27 (d, J = 16.4 Hz, 1H), 7.01 (d, J = 16.4 Hz, 1H), 6.76 (d, J = 8.3 Hz, 1H), 6.46 − 6.40 (m, 1H), 6.31 (d, J = 3.0 Hz, 1H), 3.80 (s, 2H), 3.73 (s, 2H). 13C NMR (101 MHz, DMSO-d6) δ 157.93, 153.71, 142.63, 139.16, 131.89, 131.49, 131.16, 129.16, 127.95, 127.78, 127.76, 127.31, 126.52, 125.13, 122.88, 116.13, 110.84, 107.77, 49.51, 44.81.
methyl (E)-3-((5–(3,4-dichlorostyryl)-2-hydroxybenzyl)amino)propanoate (A5)
White solid, 73% yield; HRMS (ESI) m/z Cald for C19H18Cl2NO3 [M–H]− = 378.0664, found 378.0674; 1H NMR (300 MHz, DMSO-d6) δ 7.82 (d, J = 1.6 Hz, 1H), 7.55 (dt, J = 8.4, 5.0 Hz, 2H), 7.34 (dd, J = 13.6, 5.3 Hz, 2H), 7.26 (d, J = 16.4 Hz, 1H), 7.01 (d, J = 16.4 Hz, 1H), 6.74 (d, J = 8.3 Hz, 1H), 3.81 (s, 2H), 3.60 (s, 3H), 2.78 (t, J = 6.7 Hz, 2H), 2.54 (s, 1H). 13C NMR (101 MHz, DMSO-d6) δ 172.78, 158.07, 139.16, 131.89, 131.48, 131.16, 129.16, 127.93, 127.70, 127.64, 127.35, 126.51, 125.20, 122.86, 116.15, 51.77, 50.38, 44.38, 34.31.
(E)-4–(3,4-dichlorostyryl)-2-(((4-methylpiperazin-1-yl)amino)methyl)phenol (A6)
White solid, 72% yield; HRMS (ESI) m/z Cald for C20H22Cl2N3O [M–H]− = 390.1140, found 390.0975; 1H NMR (300 MHz, DMSO) δ 11.47 (s, 1H), 7.90 (s, 1H), 7.84 (d, J = 1.5 Hz, 1H), 7.65 − 7.52 (m, 3H), 7.44 (dd, J = 8.5, 1.8 Hz, 1H), 7.31 (d, J = 16.4 Hz, 1H), 7.04 (d, J = 16.4 Hz, 1H), 6.88 (d, J = 8.4 Hz, 1H), 3.14 (s, 4H), 2.53 (s, 4H), 2.24 (s, 3H). 13C NMR (101 MHz, DMSO-d6) δ 157.24, 138.91, 138.76, 131.93, 131.19, 130.95, 129.45, 128.30, 128.14, 128.08, 127.81, 126.69, 123.77, 120.47, 116.94, 54.11, 51.04, 45.92.
(E)-2-(((4-(1H-imidazol-1-yl)phenyl)amino)methyl)-4–(3,4-dichlorostyryl)phenol (A7)
Yellow solid, 70% yield; HRMS (ESI) m/z Cald for C24H18Cl2N3O [M–H]− = 434.0827, found 434.0840; 1H NMR (400 MHz, DMSO-d6) δ 9.94 (s, 1H), 7.97 (s, 1H), 7.82 (d, J = 1.8 Hz, 1H), 7.56 (d, J = 8.4 Hz, 1H), 7.54 − 7.46 (m, 3H), 7.36 (dd, J = 8.4, 2.0 Hz, 1H), 7.27 (t, J = 11.9 Hz, 3H), 7.02 (s, 1H), 6.94 (d, J = 16.4 Hz, 1H), 6.88 (d, J = 8.3 Hz, 1H), 6.69 (d, J = 8.9 Hz, 2H), 6.33 (t, J = 5.8 Hz, 1H), 4.24 (d, J = 5.7 Hz, 2H). 13C NMR (101 MHz, DMSO-d6) δ 156.07, 148.48, 139.03, 135.82, 131.89, 131.61, 131.12, 129.54, 129.21, 128.00, 127.98, 127.76, 126.78, 126.60, 126.29, 122.98, 122.49, 118.87, 115.84, 112.99, 41.95.
(E)-4–(3,4-dichlorostyryl)-2-(((4-morpholinophenyl)amino)methyl)phenol (A8)
Yellow solid, 76% yield; HRMS (ESI) m/z Cald for C25H23Cl2N2O2 [M–H]− = 454.1215, found 454.1208; 1H NMR (300 MHz, DMSO-d6) δ 9.86 (s, 1H), 7.81 (d, J = 1.7 Hz, 1H), 7.52 (dt, J = 13.1, 5.1 Hz, 3H), 7.33 (dd, J = 8.3, 2.0 Hz, 1H), 7.24 (d, J = 16.4 Hz, 1H), 6.93 (d, J = 16.4 Hz, 1H), 6.85 (d, J = 8.3 Hz, 1H), 6.74 (d, J = 8.9 Hz, 2H), 6.55 (d, J = 8.9 Hz, 2H), 5.59 (t, J = 5.4 Hz, 1H), 4.15 (d, J = 4.9 Hz, 2H), 3.76 − 3.62 (m, 4H), 2.96 − 2.81 (m, 4H). 13C NMR (101 MHz, DMSO-d6) δ 156.06, 143.48, 142.95, 139.06, 131.89, 131.68, 131.11, 129.17, 127.97, 127.91, 127.69, 126.96, 126.63, 126.54, 122.86, 118.01, 115.73, 113.66, 66.78, 50.97, 42.80.
(E)-4–(3,4-dichlorostyryl)-2-((phenylamino)methyl)phenol (A9)
White solid, 75% yield; HRMS (ESI) m/z Cald for C21H17Cl2NO [M]− = 369.0687, found 369.0568; 1H NMR (400 MHz, DMSO-d6) δ 9.89 (s, 1H), 7.82 (s, 1H), 7.60 − 7.45 (m, 3H), 7.35 (dd, J = 8.3, 1.6 Hz, 1H), 7.24 (d, J = 16.4 Hz, 1H), 7.06 (t, J = 7.8 Hz, 2H), 6.93 (d, J = 16.4 Hz, 1H), 6.86 (d, J = 8.3 Hz, 1H), 6.60 (d, J = 7.9 Hz, 2H), 6.52 (t, J = 7.2 Hz, 1H), 6.02 (t, J = 5.7 Hz, 1H), 4.19 (d, J = 5.6 Hz, 2H). 13C NMR (101 MHz, DMSO-d6) δ 156.04, 149.35, 139.04, 131.89, 131.64, 131.11, 129.31, 129.19, 127.97, 127.93, 127.76, 126.68, 126.64, 126.57, 122.90, 116.18, 115.77, 112.68, 41.96.
(E)-4–(3,4-dichlorostyryl)-2-((pyridin-3-ylamino)methyl)phenol (A10)
White solid, 72% yield; HRMS (ESI) m/z Cald for C20H17Cl2N2O [M + H]+ = 371.0718, found 371.0725; 1H NMR (400 MHz, DMSO-d6) δ 9.94 (s, 1H), 8.02 (s, 1H), 7.81 (d, J = 1.9 Hz, 1H), 7.75 (d, J = 3.6 Hz, 1H), 7.56 (d, J = 8.4 Hz, 1H), 7.51 (dd, J = 8.5, 1.9 Hz, 1H), 7.47 (d, J = 1.9 Hz, 1H), 7.36 (dd, J = 8.4, 2.1 Hz, 1H), 7.25 (d, J = 16.4 Hz, 1H), 7.06 (dd, J = 8.2, 4.6 Hz, 1H), 6.98 − 6.85 (m, 3H), 6.30 (t, J = 5.7 Hz, 1H), 4.22 (d, J = 5.8 Hz, 2H). 13C NMR (101 MHz, DMSO-d6) δ 156.10, 145.32, 139.02, 137.28, 135.90, 131.89, 131.53, 131.11, 129.22, 128.01, 127.98, 127.85, 126.93, 126.59, 125.95, 124.08, 123.00, 117.99, 115.88, 41.50.
(E)-4-((5–(3,4-dichlorostyryl)-2-hydroxybenzyl)amino)benzoic acid (A11)
White solid, 74% yield; HRMS (ESI) m/z Cald for C22H16Cl2NO3 [M–H]− = 412.0507, found 412.0512; 1H NMR (400 MHz, DMSO-d6) δ 12.01 (s, 1H), 9.95 (s, 1H), 7.82 (d, J = 1.8 Hz, 1H), 7.66 (d, J = 8.8 Hz, 2H), 7.56 (d, J = 8.4 Hz, 1H), 7.52 (dd, J = 8.5, 1.9 Hz, 1H), 7.42 (d, J = 1.7 Hz, 1H), 7.38 (dd, J = 8.4, 2.0 Hz, 1H), 7.25 (d, J = 16.4 Hz, 1H), 6.94 (d, J = 16.4 Hz, 1H), 6.87 (t, J = 6.8 Hz, 2H), 6.62 (d, J = 8.8 Hz, 2H), 4.26 (d, J = 5.6 Hz, 2H). 13C NMR (101 MHz, DMSO-d6) δ 167.96, 156.06, 153.06, 139.01, 131.88, 131.58, 131.51, 131.11, 129.22, 128.01, 127.99, 127.86, 126.91, 126.62, 125.78, 123.03, 117.47, 115.88, 111.48, 41.48.
(E)-4–(3,4-dichlorostyryl)-2-(((3-(trifluoromethyl)benzyl)amino)methyl)phenol (A12)
Yellow solid, 67% yield; HRMS (ESI) m/z Cald for C23H17Cl2F3NO [M–H]− = 450.0639, found 450.0652; 1H NMR (300 MHz, DMSO-d6) δ 7.82 (d, J = 1.7 Hz, 1H), 7.74 (s, 1H), 7.71 − 7.49 (m, 5H), 7.41 (s, 1H), 7.35 (d, J = 8.3 Hz, 1H), 7.27 (d, J = 16.4 Hz, 1H), 7.00 (d, J = 16.4 Hz, 1H), 6.78 (d, J = 8.3 Hz, 1H), 3.84 (s, 2H), 3.80 (s, 2H). 13C NMR (101 MHz, DMSO-d6) δ 157.77, 141.87, 139.14, 132.70, 131.90, 131.50, 131.16, 129.97, 129.73, 129.65, 129.34, 129.18, 129.03, 127.94, 127.82, 127.76, 127.33, 126.50, 126.18, 125.36, 125.00, 124.01, 123.47, 122.88, 116.10, 51.72, 49.47.
(E)-4–(3,4-dichlorostyryl)-2-(((pyridin-4-ylmethyl)amino)methyl)phenol (A13)
Yellow solid, 68% yield; HRMS (ESI) m/z Cald for C21H17Cl2N2O [M–H]− = 383.0718, found 383.0726; 1H NMR (400 MHz, DMSO-d6) δ 8.53 (d, J = 3.3 Hz, 2H), 7.83 (d, J = 1.9 Hz, 1H), 7.59 (d, J = 8.4 Hz, 1H), 7.53 (dd, J = 8.5, 1.9 Hz, 1H), 7.43 (d, J = 1.9 Hz, 1H), 7.38 (d, J = 5.6 Hz, 2H), 7.34 (dd, J = 8.4, 2.1 Hz, 1H), 7.28 (d, J = 16.4 Hz, 1H), 7.01 (d, J = 16.4 Hz, 1H), 6.78 (d, J = 8.3 Hz, 1H), 3.78 (d, J = 2.1 Hz, 4H). 13C NMR (101 MHz, DMSO-d6) δ 157.59, 149.98, 149.39, 139.14, 131.90, 131.50, 131.16, 129.18, 127.95, 127.84, 127.30, 126.53, 125.47, 123.54, 122.90, 116.06, 51.15, 49.31.
(E)-4–(3,4-dichlorostyryl)-2-(((4-(dimethylamino)phenyl)amino)methyl)phenol (A14)
Yellow solid, 62% yield; HRMS (ESI) m/z Cald for C23H21Cl2N2O [M–H]− = 411.1031, found 411.1043; 1H NMR (300 MHz, DMSO-d6) δ 9.86 (s, 1H), 7.81 (d, J = 1.6 Hz, 1H), 7.53 (dt, J = 12.1, 5.1 Hz, 3H), 7.33 (dd, J = 8.3, 1.9 Hz, 1H), 7.24 (d, J = 16.4 Hz, 1H), 6.93 (d, J = 16.4 Hz, 1H), 6.84 (d, J = 8.3 Hz, 1H), 6.62 (d, J = 8.9 Hz, 2H), 6.55 (d, J = 8.9 Hz, 2H), 5.39 (s, 1H), 4.14 (s, 2H), 2.70 (s, 6H). 13C NMR (101 MHz, DMSO-d6) δ 156.10, 143.47, 141.57, 139.07, 131.88, 131.69, 131.12, 129.15, 127.96, 127.88, 127.68, 127.08, 126.61, 126.55, 122.83, 115.71, 114.09, 43.15, 42.21.
(E)-4–(3,4-dichlorostyryl)-2-(((4–(4-methylpiperazin-1-yl)phenyl)amino)methyl)phenol (A15)
Yellow solid, 69% yield; HRMS (ESI) m/z Cald for C26H26N3OCl2 [M–H]− = 466.1453, found 466.1460; 1H NMR (300 MHz, DMSO-d6) δ 9.92 (s, 1H), 7.81 (s, 1H), 7.53 (dd, J = 18.0, 11.7 Hz, 3H), 7.33 (d, J = 8.3 Hz, 1H), 7.24 (d, J = 16.4 Hz, 1H), 6.89 (dd, J = 19.2, 12.3 Hz, 2H), 6.73 (d, J = 8.8 Hz, 2H), 6.54 (d, J = 8.8 Hz, 2H), 5.56 (s, 1H), 4.15 (s, 2H), 2.98 − 2.84 (m, 4H), 2.42 (m, 4H), 2.19 (s, 3H). 13C NMR (101 MHz, DMSO-d6) δ 156.12, 143.25, 142.99, 139.08, 131.88, 131.70, 131.11, 129.15, 127.97, 127.85, 127.66, 126.98, 126.60, 126.55, 122.82, 118.25, 115.74, 113.65, 55.37, 50.52, 46.25, 42.83.
(E)-2-(((1H-indol-5-yl)amino)methyl)-4–(3,4-dichlorostyryl)phenol (A16)
Red solid, 65% yield; HRMS (ESI) m/z Cald for C23H17Cl2N2O [M–H]− = 407.0718, found 407.0729; 1H NMR (400 MHz, DMSO-d6) δ 10.63 (s, 1H), 9.91 (s, 1H), 7.80 (d, J = 1.9 Hz, 1H), 7.52 (dt, J = 8.5, 5.2 Hz, 3H), 7.33 (dd, J = 8.3, 2.1 Hz, 1H), 7.23 (d, J = 16.4 Hz, 1H), 7.13 (t, J = 6.4 Hz, 2H), 6.93 (d, J = 16.3 Hz, 1H), 6.85 (d, J = 8.3 Hz, 1H), 6.63 (dd, J = 4.5, 2.2 Hz, 2H), 6.18 − 6.13 (m, 1H), 5.43 (s, 1H), 4.22 (s, 2H). 13C NMR (101 MHz, DMSO-d6) δ 156.20, 142.72, 139.07, 131.87, 131.72, 131.10, 130.18, 129.14, 128.84, 127.97, 127.89, 127.67, 127.20, 126.59, 126.54, 125.12, 122.82, 115.73, 112.08, 111.96, 101.22, 100.49, 43.74.
(E)-4–(3,4-dichlorostyryl)-2-(((pyridin-3-ylmethyl)amino)methyl)phenol (A17)
White solid, 72% yield; HRMS (ESI) m/z Cald for C21H17Cl2N2O [M–H]− = 383.0718, found 383.0727; 1H NMR (400 MHz, DMSO-d6) δ 8.55 (d, J = 1.1 Hz, 1H), 8.52 − 8.44 (m, 1H), 7.82 (d, J = 1.8 Hz, 1H), 7.77 (d, J = 7.8 Hz, 1H), 7.59 (d, J = 8.4 Hz, 1H), 7.53 (dd, J = 8.4, 1.8 Hz, 1H), 7.45 − 7.32 (m, 3H), 7.28 (d, J = 16.4 Hz, 1H), 7.01 (d, J = 16.4 Hz, 1H), 6.77 (d, J = 8.3 Hz, 1H), 3.80 (s, 2H), 3.77 (s, 2H). 13C NMR (101 MHz, DMSO-d6) δ 157.80, 149.99, 148.64, 139.15, 136.29, 135.62, 131.90, 131.51, 131.16, 129.18, 127.95, 127.84, 127.79, 127.30, 126.52, 125.29, 123.91, 122.90, 116.12, 49.75, 49.52.
(E)-N-(4-((5–(3,4-dichlorostyryl)-2-hydroxybenzyl)amino)phenyl)acetamide (A18)
Red solid, 70% yield; HRMS (ESI) m/z Cald for C23H19Cl2N2O2 [M–H]− = 425.0824, found 425.0830; 1H NMR (400 MHz, DMSO-d6) δ 9.87 (s, 1H), 9.52 (s, 1H), 7.82 (d, J = 1.8 Hz, 1H), 7.53 (dt, J = 8.5, 5.1 Hz, 2H), 7.47 (d, J = 1.9 Hz, 1H), 7.34 (dd, J = 8.4, 2.1 Hz, 1H), 7.29 − 7.21 (m, 3H), 6.93 (d, J = 16.4 Hz, 1H), 6.85 (d, J = 8.3 Hz, 1H), 6.54 (d, J = 8.9 Hz, 2H), 5.82 (t, J = 5.9 Hz, 1H), 4.17 (d, J = 5.8 Hz, 2H), 1.95 (s, 3H). 13C NMR (101 MHz, DMSO-d6) δ 167.66, 156.05, 145.54, 139.06, 131.88, 131.64, 131.11, 129.21, 129.18, 127.99, 127.93, 127.77, 126.72, 126.70, 126.57, 122.90, 121.30, 115.75, 112.61, 42.39, 24.15.
(E)-4–(3,4-dichlorostyryl)-2-(((3–(4-methylpiperazin-1-yl)phenyl)amino)methyl)phenol (A19)
Yellow solid, 66% yield; HRMS (ESI) m/z Cald for C26H26Cl2N3O [M–H]− = 466.1453, found 466.1464; 1H NMR (300 MHz, DMSO-d6) δ 9.97 (s, 1H), 7.78 (s, 1H), 7.50 (q, J = 8.2 Hz, 3H), 7.34 (d, J = 8.1 Hz, 1H), 7.22 (d, J = 16.3 Hz, 1H), 6.91 (t, J = 12.5 Hz, 3H), 6.15 (m, 3H), 5.80 (s, 1H), 4.22 (s, 2H), 3.03 (s, 4H), 2.41 (s, 4H), 2.19 (s, 3H). 13C NMR (101 MHz, DMSO-d6) δ 156.04, 152.40, 150.06, 139.06, 131.89, 131.64, 131.13, 129.63, 129.18, 127.97, 127.93, 127.87, 126.91, 126.80, 126.55, 122.86, 115.72, 104.60, 104.39, 100.40, 55.17, 48.72, 46.19, 42.03.
(E)-4–(3,4-dichlorostyryl)-2-(((2-methoxy-4–(4-methylpiperazin-1-yl)phenyl)amino)methyl)phenol (A20)
Red solid, 56% yield; HRMS (ESI) m/z Cald for C27H28Cl2N3O2 [M–H]− = 496.1559, found 496.1572; 1H NMR (300 MHz, CDCl3) δ 7.55 (d, J = 1.7 Hz, 1H), 7.32 (dt, J = 8.1, 5.1 Hz, 4H), 7.02 (d, J = 16.3 Hz, 1H), 6.82 (m, 3H), 6.55 (d, J = 2.2 Hz, 1H), 6.45 (dd, J = 8.5, 2.1 Hz, 1H), 4.39 (s, 2H), 3.85 (s, 3H), 3.21 − 3.06 (m, 4H), 2.63 (m, 4H), 2.38 (s, 3H). 13C NMR (101 MHz, DMSO-d6) δ 156.17, 147.76, 143.40, 139.07, 132.45, 131.88, 131.64, 131.10, 129.17, 127.98, 127.90, 126.94, 126.69, 126.58, 122.90, 115.81, 110.65, 108.52, 102.03, 55.82, 55.37, 50.51, 46.23, 43.26.
(E)-4–(3,4-dichlorostyryl)-2-(((4-((4-methylpiperazin-1-yl)methyl)phenyl)amino)methyl)phenol (A21)
Yellow solid, 67% yield; HRMS (ESI) m/z Cald for C27H28Cl2N3O [M–H]− = 480.1609, found 480.1622; 1H NMR (400 MHz, DMSO-d6) δ 10.04 (s, 1H), 7.80 (d, J = 1.8 Hz, 1H), 7.56 (d, J = 8.4 Hz, 1H), 7.50 (dd, J = 8.5, 1.8 Hz, 1H), 7.46 (d, J = 1.7 Hz, 1H), 7.33 (dd, J = 8.3, 1.9 Hz, 1H), 7.24 (d, J = 16.4 Hz, 1H), 7.00 − 6.84 (m, 4H), 6.54 (d, J = 8.4 Hz, 2H), 5.95 (s, 1H), 4.18 (s, 2H), 3.24 (s, 2H), 2.27 (s, 8H), 2.11 (s, 3H). 13C NMR (101 MHz, DMSO-d6) δ 156.19, 148.37, 139.06, 131.88, 131.69, 131.11, 130.20, 129.15, 127.95, 127.79, 127.69, 126.71, 126.55, 125.56, 122.79, 115.78, 112.38, 62.45, 55.23, 52.90, 46.23, 42.14.
(E)-4–(3,4-dichlorostyryl)-2-(((3-fluoro-4–(4-methylpiperazin-1-yl)phenyl)amino)methyl)phenol (A22)
Yellow solid, 63% yield; HRMS (ESI) m/z Cald for C26H25Cl2FN3O [M–H]− = 484.1359, found 484.1371; 1H NMR (400 MHz, DMSO-d6) δ 10.02 (s, 1H), 7.82 (d, J = 1.9 Hz, 1H), 7.57 (d, J = 8.4 Hz, 1H), 7.52 (dd, J = 8.5, 1.9 Hz, 1H), 7.44 (dd, J = 10.9, 2.0 Hz, 1H), 7.35 (dd, J = 8.4, 2.1 Hz, 1H), 7.25 (d, J = 16.4 Hz, 1H), 6.93 (d, J = 16.4 Hz, 1H), 6.86 (d, J = 8.3 Hz, 1H), 6.84 − 6.77 (m, 1H), 6.36 (ddd, J = 11.8, 11.1, 2.5 Hz, 2H), 6.00 (s, 1H), 4.14 (d, J = 3.1 Hz, 2H), 2.81 (s, 4H), 2.41 (s, 4H), 2.19 (s,3H). 13C NMR (101 MHz, DMSO-d6) δ 158.01, 156.11, 155.61, 146.13, 146.03, 139.05, 131.89, 131.62, 131.12, 129.78, 129.68, 129.19, 127.98, 127.91, 127.80, 126.76, 126.58, 126.45, 122.91, 121.02, 120.98, 115.82, 108.21, 108.19, 100.97, 100.74, 55.42, 51.46, 46.30, 42.21.
(E)-4–(3,4-dichlorostyryl)-2-(((4–(4-isopropylpiperazin-1-yl)phenyl)amino)methyl)phenol (A23)
Yellow solid, 71% yield; HRMS (ESI) m/z Cald for C28H30Cl2N3O [M–H]− = 494.1766, found 494.1782; 1H NMR (400 MHz, DMSO-d6) δ 9.87 (s, 1H), 7.81 (d, J = 1.8 Hz, 1H), 7.56 (d, J = 8.4 Hz, 1H), 7.51 (dd, J = 8.5, 1.9 Hz, 1H), 7.48 (d, J = 1.9 Hz, 1H), 7.33 (dd, J = 8.4, 2.1 Hz, 1H), 7.24 (d, J = 16.4 Hz, 1H), 6.93 (d, J = 16.4 Hz, 1H), 6.84 (d, J = 8.3 Hz, 1H), 6.72 (d, J = 8.9 Hz, 2H), 6.53 (d, J = 8.9 Hz, 2H), 5.55 (s, 1H), 4.15 (d, J = 1.7 Hz, 2H), 2.95 − 2.80 (m, 4H), 2.65 (dt, J = 12.5, 6.2 Hz, 1H), 2.54–2.50 (m, 4H), 0.99 (d, J = 6.5 Hz, 6H). 13C NMR (101 MHz, DMSO-d6) δ 156.07, 143.23, 143.12, 139.07, 131.89, 131.69, 131.11, 129.17, 127.98, 127.90, 127.68, 127.00, 126.61, 126.55, 122.85, 118.24, 115.72, 113.65, 54.18, 51.01, 48.72, 42.85, 18.70.
(E)-4–(3,4-dichlorostyryl)-2-(((4–(4-(methylsulfonyl)piperazin-1-yl)phenyl)amino)methyl)phenol (A24)
Yellow solid, 64% yield; HRMS (ESI) m/z Cald for C26H26Cl2N3O3S [M–H]− = 530.1072, found 530.1074; 1H NMR (300 MHz, DMSO-d6) δ 9.87 (s, 1H), 7.82 (s, 1H), 7.53 (dd, J = 19.2, 12.0 Hz, 3H), 7.34 (d, J = 8.2 Hz, 1H), 7.25 (d, J = 16.4 Hz, 1H), 6.93 (d, J = 16.4 Hz, 1H), 6.85 (d, J = 8.3 Hz, 1H), 6.78 (d, J = 8.5 Hz, 2H), 6.56 (d, J = 8.5 Hz, 2H), 5.66 (s, 1H), 4.16 (s, 2H), 3.21 (m, 4H), 2.99 (m, 4H), 2.91 (s, 3H). 13C NMR (101 MHz, DMSO-d6) δ 156.05, 144.00, 142.27, 139.05, 131.89, 131.68, 131.12, 129.18, 127.97, 127.92, 127.70, 126.91, 126.63, 126.56, 122.88, 119.21, 115.74, 113.54, 50.65, 46.07, 42.67, 34.17.
(E)-4–(3,4-dichlorostyryl)-2-(((4–(4,4-difluoropiperidin-1-yl)phenyl)amino)methyl)phenol (A25)
Yellow solid, 67% yield; HRMS (ESI) m/z Cald for C26H23N2OCl2F2 [M–H]− = 487.1155, found 487.1170; 1H NMR (300 MHz, DMSO-d6) δ 9.86 (s, 1H), 7.81 (d, J = 1.7 Hz, 1H), 7.56 (d, J = 8.4 Hz, 1H), 7.50 (dd, J = 13.9, 1.8 Hz, 2H), 7.34 (dd, J = 8.4, 1.9 Hz, 1H), 7.24 (d, J = 16.4 Hz, 1H), 6.93 (d, J = 16.4 Hz, 1H), 6.85–6.75 (m, 3H), 6.55 (d, J = 8.8 Hz, 2H), 5.64 (t, J = 5.2 Hz, 1H), 4.15 (d, J = 4.8 Hz, 2H), 3.12 − 2.99 (m, 4H), 2.03 (ddd, J = 19.9, 14.0, 5.7 Hz, 4H). 13C NMR (101 MHz, DMSO-d6) δ 156.05, 143.86, 141.81, 139.05, 131.89, 131.67, 131.11, 129.18, 127.97, 127.91, 127.70, 126.92, 126.65, 126.55, 123.25, 122.87, 119.50, 115.73, 113.56, 48.49, 48.44, 48.39, 42.69, 34.16, 33.94, 33.72.
(E)-4–(3,4-dichlorostyryl)-2-(((4–(4-methyl-1,4-diazepan-1-yl)phenyl)amino)methyl)phenol (A26)
Yellow solid, 59% yield; HRMS (ESI) m/z Cald for C27H28N3OCl2 [M–H]− = 480.1609, found 480.1607; 1H NMR (400 MHz, DMSO-d6) δ 9.95 (s, 1H), 7.81 (d, J = 1.9 Hz, 1H), 7.53 (dt, J = 11.4, 5.4 Hz, 3H), 7.32 (dd, J = 8.4, 2.1 Hz, 1H), 7.24 (d, J = 16.4 Hz, 1H), 6.93 (d, J = 16.4 Hz, 1H), 6.84 (d, J = 8.3 Hz, 1H), 6.52 (d, J = 3.5 Hz, 4H), 5.29 (s, 1H), 4.13 (s, 2H), 3.39 − 3.34 (m, 2H), 3.29 (t, J = 6.2 Hz, 2H), 2.59 − 2.53 (m, 2H), 2.47 − 2.38 (m, 2H), 2.23 (s, 3H), 1.88 − 1.78 (m, 2H). 13C NMR (101 MHz, DMSO-d6) δ 156.19, 141.95, 140.12, 139.09, 131.88, 131.72, 131.12, 129.15, 127.97, 127.86, 127.67, 127.17, 126.64, 126.53, 122.81, 115.72, 114.72, 113.50, 58.03, 56.92, 49.42, 48.84, 46.61, 43.56, 27.70.
(E)-4–(3,4-dichlorostyryl)-2-(((4–(3,5-dimethylpiperazin-1-yl)phenyl)amino)methyl)phenol (A27)
Yellow solid, 57% yield; HRMS (ESI) m/z Cald for C27H28Cl2N3O [M–H]− = 480.1609, found 480.1598; 1H NMR (400 MHz, DMSO-d6) δ 9.87 (s, 1H), 7.81 (d, J = 1.9 Hz, 1H), 7.56 (d, J = 8.4 Hz, 1H), 7.51 (dd, J = 8.5, 1.9 Hz, 1H), 7.48 (d, J = 2.0 Hz, 1H), 7.33 (dd, J = 8.4, 2.1 Hz, 1H), 7.24 (d, J = 16.4 Hz, 1H), 6.93 (d, J = 16.4 Hz, 1H), 6.84 (d, J = 8.3 Hz, 1H), 6.71 (d, J = 8.9 Hz, 2H), 6.54 (s, 2H), 5.53 (s, 1H), 4.14 (s, 2H), 3.65 − 3.56 (m, 1H), 3.20 (dd, J = 11.0, 1.9 Hz, 2H), 2.82 (ddd, J = 9.4, 6.3, 2.7 Hz, 2H), 1.96 (t, J = 10.7 Hz, 2H), 1.80 − 1.73 (m, 1H), 0.97 (d, J = 6.3 Hz, 6H). 13C NMR (101 MHz, DMSO-d6) δ 156.08, 143.27, 143.07, 139.06, 131.88, 131.68, 131.12, 129.15, 127.97, 127.87, 127.68, 127.00, 126.63, 126.55, 122.83, 118.34, 115.70, 113.68, 67.49, 57.98, 50.75, 42.85, 25.60, 19.97.
Molecular modeling
Potential energy surface scanning
The Dihedral Driver program in Chem 3D was used to calculate the 2D potential energy surfaces for compound A15. The MM2 force field was used for energy optimisation.
Molecular dockingCitation25
The molecular docking experiment was performed on Schrödinger software. The LigPrep module was used to minimise the energy of the compounds A1–A27, set the charge, add polar and non-polar hydrogen, generate possible ionisation state, and define rotatable chemical bonds. The OPLS3 force field was used for structural optimisation of these ligands. Then we downloaded the crystal structure of And1 (PDB code: 5GVA) from the protein database website ProteinDataBank (www.rcsb.org), and used the Protein Preparation Wizard program to hydrogenate the protein, remove solvents, and specify the bond level. The Ligand Docking module was used to dock between the generated receptor grid file and the ligand structure. The results were opened with Pymol for preview, analysis and graphing.
Biology
Cell line and cell CultureCitation26
The human tumour cell lines that used in this paper including A549 (catalog number: ZQ0003) and H460 (catalog number: ZQ0111) were purchased from Zhong Qiao Xin Zhou Biotechnology (Shanghai). All cells were cultured in DMEM medium (Gibco) containing 10% FBS (Biological Industries) and 1% penicillin − streptomycin antibiotic (Gibco) in the constant temperature incubator at 37 °C and 5% CO2.
Western blot AnalysisCitation26
Lung cancer cells (3 × 10⁵ cells/well) were seeded into six-well plates and treated with tested compounds for 48 h. The cells were harvested and lysed in 120 μL of RIPA lysis buffer (Beyotime, China). The protein concentration was measured using a BCA Protein Assay Kit (Beyotime, China) with a microplate reader. The lysis fluid was rotated and centrifuged to collect the supernatant. The tumour cells treated with SDS-PAGE Sample Loading Buffer, 5X (Beyotime, China) and denatured by heating at 100 °C for 10 min. Proteins were separated by 10% SDS − PAGE and transferred onto PVDF membranes (Millipore, USA). The membranes were blocked in PBST solution containing 5% non-fat milk for 90 min at room temperature, followed by incubation overnight with the primary antibody on a shaker at 4 °C. After washing with TBST three times for 6 min, the membranes were incubated with the secondary antibody for 90 min at room temperature, followed by two 6 min washes with PBST and one 6 min washes with PBS. Proteins were detected by Multifunctional Molecular Imaging System (UVITEC, UK) and analysed using Image J software. The ladder used for Western Blot experiments was purchased from Epizyme Biotech (Multicolor Prestained Protein Ladder, catalog number: WJ103). Information on the antibodies used in this study is provided below: Anti-WDHD1 antibody (Abcam, ab224221), Phospho-Histone H2A.X (Ser139) antibody (Cell Signalling Technology, #2577S), BRCA1 Polyclonal antibody (Proteintech, 22362–1-AP), BRCA2 Polyclonal antibody (Proteintech, 29450–1-AP), Mouse Anti-β actin mAb (ZSGB-BIO, TA-09), Horseradish enzyme labelled goat anti-rabbit IgG (H + L) (ZSGB-BIO, ZB-2301), Horseradish peroxidase labelled goat anti-mouse IgG (ZSGB-BIO, ZB-2305), Alexa Fluor 488 labelled goat anti-rabbit IgG (H + L) (Beyotime, A0423). All samples have three independent biological replicates.
Cellular viability assay for AntiproliferationCitation26
Cell Counting Kit-8 was used to evaluate the antiproliferative activity of the target compounds. H460 and A549 cells were seeded into 96-well platesat a density of 3000/well for 24 h. Different concentrations of tested compounds dissolved in 100 μL of culture medium were added and incubated at 37 °C with 5% CO2. After 48 h, 10 μL of the CCK8 reagent (Beyotime) was added to each well, and the plates were incubated in the incubator for 3 h. The absorbance values were measured at 571 nm with a microplate detector (TECAN), and IC50 values were calculated through GraphPad Prism 8.0 software. The experiment was carried out at least three independent experiments. All samples have three independent biological replicates.
Cellular viability assay for the growth CurveCitation26
H460 and A549 cells (2000 cells/well, 0.1 mL/well) were dispensed into 96-well plates and subjected to DMSO or tested compound treatment for 5 days, and 10 μL of the CCK8 reagent was then added. The absorbance was determined by a Synergy H1 (TECAN) every day, and the absorbance value was measured at 571 nm. The cell growth curves were plotted using GraphPad Prism (version 8.0). The experiment was repeated three times independently. All samples have three independent biological replicates.
Clone formation AssayCitation26
H460 and A549 cells (400 cells/well, 1 mL/well) were dispensed into 12-well plates. The cells were then treated with Olaparib, or DMSO, and the medium containing DMSO or compound was changed every 3 days. After 2 weeks of incubation, the cells were washed by PBS, fixed by 4% paraformaldehyde for 20 min, then stained by crystal violet staining solution (Beyotime) for 20 min, and finally photographed. The number of cell colonies was calculated by using ImageJ. All samples have three independent biological replicates.
Immunofluorescence assayCitation26
Cells cultured on cell slides were washed twice with PBS, then fixed with 4% paraformaldehyde (Solarbio, China) for 20 min. Followed by permeabilization with 0.2% of Triton X − 100 (Beyotime, China) in 20 min. Cells were then washed and incubated for 30 min in 5% BSA, then incubated with anti-Phospho-Histone H2AX antibody (CST, USA) overnight at 4 °C and Alexa Fluor488-conjugated anti-rabbit antibody (Beyotime, China) for detection. After stained with DAPI (Beyotime, China), samples were photographed with immunofluorescence microscopy. The results were analysed by ImageProplus 6.0. All samples have three independent biological replicates.
Author contributions
Yiliang Li and Wenbin Hou is responsible for conception and design of this study. Leyuan Chen and Zhonghao Ren performed the experiments and analysed the data. Leyuan Chen, Zhonghao Ren and Yunze Zhang performed molecular simulation and wrote the initial draft of the manuscript. All authors approved the final version of the manuscript.
Olaparib+A15-Merge.tif
Download TIFF Image (1.9 MB)A15-γH2AX- 7c.tif
Download TIFF Image (883.3 KB)Control-DAPI.tif
Download TIFF Image (1.2 MB)Olaparib-γ-H2AX.tif
Download TIFF Image (860.7 KB)Olaparib+A15-DAPI.tif
Download TIFF Image (975.3 KB)FigureS1B-And1.tif
Download TIFF Image (14.1 MB)FigureS1D-ª┬-actin.png
Download PNG Image (426.6 KB)
Figure3D-β-actin.tif
Download TIFF Image (14.1 MB)Olaparib+A15-Merge- 7c.tif
Download TIFF Image (2.1 MB)Control-Merge- 7c.tif
Download TIFF Image (1.4 MB)Olaparib-DAPI.tif
Download TIFF Image (978.5 KB)Figure3A-ª┬-actin.png
Download PNG Image (587.1 KB)
Figure3C-And1.tif
Download TIFF Image (14.1 MB)Olaparib+A15-γ-H2AX- 7c.tif
Download TIFF Image (1.2 MB)Control-DAPI- 7c.tif
Download TIFF Image (770.1 KB)A15-Merge- 7c.tif
Download TIFF Image (1.6 MB)FigureS1E-And1.tif
Download TIFF Image (14.1 MB)Figure4E-And1.tif
Download TIFF Image (14.1 MB)Figure7E-ª┬-actin.png
Download PNG Image (431.3 KB)
Figure4E-ª┬-actin.png
Download PNG Image (79.5 KB)
Control-γH2AX.tif
Download TIFF Image (1 MB)A15-DAPI- 7c.tif
Download TIFF Image (918.2 KB)FigureS1C-And1.tif
Download TIFF Image (14.1 MB)Olaparib-DAPI- 7c.tif
Download TIFF Image (857.4 KB)FigureS1D-And1.tif
Download TIFF Image (14.1 MB)A15-Merge.tif
Download TIFF Image (1.8 MB)Figure7E-BRCA2.tif
Download TIFF Image (14.1 MB)Figure7E-BRCA1.tif
Download TIFF Image (14.1 MB)Figure7E-And1.tif
Download TIFF Image (14.1 MB)FigureS1A-And1.tif
Download TIFF Image (14.1 MB)supplementary_data.docx
Download MS Word (9.5 MB)Figure3B-And1.tif
Download TIFF Image (14.1 MB)Figure3B-ª┬-actin.png
Download PNG Image (587.8 KB)
Olaparib-γ-H2AX- 7c.tif
Download TIFF Image (755.5 KB)Olaparib+A15-DAPI- 7c.tif
Download TIFF Image (1.1 MB)Control-Merge.tif
Download TIFF Image (2.1 MB)Figure7E-ª├-H2AX.tif
Download TIFF Image (14.1 MB)Figure3C-ª┬-actin.png
Download PNG Image (403.8 KB)
Figure3A-And1.tif
Download TIFF Image (14.1 MB)Olaparib+A15-γ-H2AX.tif
Download TIFF Image (1 MB)Figure3D-And-1.tif
Download TIFF Image (14.1 MB)Olaparib-Merge.tif
Download TIFF Image (1.7 MB)A15-γ-H2AX.tif
Download TIFF Image (912.4 KB)A15-DAPI.tif
Download TIFF Image (1.1 MB)FigureS1C-ª┬-actin.png
Download PNG Image (492.9 KB)
Olaparib-Merge- 7c.tif
Download TIFF Image (1.5 MB)FigureS1B-ª┬-actin.png
Download PNG Image (94.1 KB)
Control-γ-H2AX- 7c.tif
Download TIFF Image (690.8 KB)FigureS1A-ª┬-actin.png
Download PNG Image (564.1 KB)
FigureS1E-ª┬-actin.png
Download PNG Image (476.2 KB)
Acknowledgements
The authors thank Gaiting Liu, Wenfeng Gou, Zhenyu Peng, Mingwei Ma, Manjiang Wang, Yu Shi, Jiang Yu, Haikang Tang and Huiqiang Wei for help with literature survey, NMR testing, data collection, and analysis.
Disclosure statement
No potential conflict of interest was reported by the author(s).
Data availability statement
The datasets presented in the current study are available from the corresponding author upon reasonable request.
Additional information
Funding
References
- Kornepati AVR, Rogers CM, Sung P, Curiel TJ. The complementarity of DDR, nucleic acids and anti-tumour immunity. Nature. 2023;619(7970):475–486.
- Groelly FJ, Fawkes M, Dagg RA, Blackford AN, Tarsounas M. Targeting DNA damage response pathways in cancer. Nat Rev Cancer. 2023;23(2):78–94.
- Burdak-Rothkamm S, Rothkamm K. DNA damage repair deficiency and synthetic lethality for cancer treatment. Trends Mol Med. 2021;27(1):91–92.
- Thakur A, Rana M, Mathew J, Nepali S, Pan C-H, Liou JP, Nepali K. Ritika Small molecule tractable PARP inhibitors: Scaffold construction approaches, mechanistic insights and structure activity relationship. Bioorg Chem. 2023;141:106893.
- Zhou J, Du T, Wang X, Yao H, Deng J, Li Y, Chen X, Sheng L, Ji M, Xu B. Discovery of quinazoline-2,4(1H,3H)-dione derivatives containing a piperizinone moiety as potent PARP-1/2 inhibitors─design, synthesis, in vivo antitumor activity, and X-ray crystal structure analysis. J Med Chem. 2023;66(20):14095–14115.
- Sun Y, Yang H, Yuan J, Wang L, Song S, Chen R, Bao X, Jia L, Yang T, Zhang X, et al. YCH1899, a highly effective phthalazin-1(2H)-one derivative that overcomes resistance to prior PARP inhibitors. J Med Chem. 2023;66(17):12284–12303.
- Brown JS, O’Carrigan B, Jackson SP, Yap TA. Targeting DNA repair in cancer: beyond parp inhibitors. Cancer Discov. 2017;7(1):20–37.
- Zhang J, Gao Y, Zhang Z, Zhao J, Jia W, Xia C, Wang F, Liu T. Multi-therapies based on PARP inhibition: potential therapeutic approaches for cancer treatment. J Med Chem. 2022;65(24):16099–16127.
- Myers SH, Ortega JA, Cavalli A. Synthetic lethality through the lens of medicinal chemistry. J Med Chem. 2020;63(23):14151–14183.
- Köhler A, Schmidt-Zachmann MS, Franke WW. AND-1, a natural chimeric DNA-binding protein, combines an HMG-box with regulatory WD-repeats. J Cell Sci. 1997;110 (Pt 9)(9):1051–1062. :
- Zhu W, Ukomadu C, Jha S, Senga T, Dhar SK, Wohlschlegel JA, Nutt LK, Kornbluth S, Dutta A. Mcm10 and And-1/CTF4 recruit DNA polymerase alpha to chromatin for initiation of DNA replication. Genes Dev. 2007;21(18):2288–2299.
- Jaramillo-Lambert A, Hao J, Xiao H, Li Y, Han Z, Zhu W. Acidic nucleoplasmic DNA-binding protein (And-1) controls chromosome congression by regulating the assembly of centromere protein A (CENP-A) at centromeres. J Biol Chem. 2013;288(3):1480–1488.
- Li Y, Li Z, Wu R, Han Z, Zhu W. And-1 is required for homologous recombination repair by regulating DNA end resection. Nucleic Acids Res. 2017;45(5):2531–2545.
- Zhou Y, Chen JJ. STAT3 plays an important role in DNA replication by turning on WDHD1. Cell Biosci. 2021;11(1):10.
- Zhao F, Kim W, Kloeber JA, Lou Z. DNA end resection and its role in DNA replication and DSB repair choice in mammalian cells. Exp Mol Med. 2020;52(10):1705–1714.
- Mozaffari NL, Pagliarulo F, Sartori AA. Human CtIP: A ‘double agent’ in DNA repair and tumorigenesis. Semin Cell Dev Biol. 2021;113:47–56.
- Chen Y, Liu H, Zhang H, Sun C, Hu Z, Tian Q, Peng C, Jiang P, Hua H, Li X, et al. And-1 coordinates with CtIP for efficient homologous recombination and DNA damage checkpoint maintenance. Nucleic Acids Res. 2017;45(5):2516–2530.
- Ali SR, Jordan M, Nagarajan P, Amit M. Nerve density and neuronal biomarkers in cancer. Cancers (Basel)). 2022;14(19):4817–4832.
- Sato N, Koinuma J, Fujita M, Hosokawa M, Ito T, Tsuchiya E, Kondo S, Nakamura Y, Daigo Y. Activation of WD repeat and high-mobility group box DNA binding protein 1 in pulmonary and esophageal carcinogenesis. Clin Cancer Res. 2010;16(1):226–239.
- Zhou Y, Zhang Q, Gao G, Zhang X, Liu Y, Yuan S, Wang X, Chen JJ. Role of WDHD1 in human papillomavirus-mediated oncogenesis identified by transcriptional profiling of E7-expressing cells. J Virol. 2016;90(13):6071–6084.
- Wu JY, Lan XL, Yan DM, Fang YY, Peng YX, Liang FF, Jiang L, Huang SN, Mo M, Lin CX, et al. The clinical significance of transcription factor WD repeat and HMG-box DNA binding protein 1 in laryngeal squamous cell carcinoma and its potential molecular mechanism. Pathol Res Pract. 2022;230:153751.
- Ertay A, Liu H, Liu D, Peng P, Hill C, Xiong H, Hancock D, Yuan X, Przewloka MR, Coldwell M, et al. Correction: WDHD1 is essential for the survival of PTEN-inactive triple-negative breast cancer. Cell Death Dis. 2021;12(3):269.
- Wu JY, Niu YT, Huang SN, Tan YM, Yang ZD, Fang YY, Jiang L, Zhang TT, Zeng XF, Peng YX, et al. WDHD1 is over-expressed in nasopharyngeal carcinoma and may control the expression of ITGAV. FEBS Open Bio. 2023;13(1):102–117.
- Wu Y, Villa F, Maman J, Lau YH, Dobnikar L, Simon AC, Labib K, Spring DR, Pellegrini L. Targeting the genome-stability Hub Ctf4 by stapled-peptide design. Angew Chem Int Ed Engl. 2017; 56(42):12866–12872.
- Li J, Zhang Y, Sun J, Chen L, Gou W, Chen CW, Zhou Y, Li Z, Chan DW, Huang R, et al. Discovery and characterization of potent And-1 inhibitors for cancer treatment. Clin Transl Med. 2021;11(12):e627.
- Gou W, Yu X, Wu S, Wu H, Chang H, Chen L, Wei H, Bi C, Ning H, Wu Y, et al. Targeted inhibition of acidic nucleoplasmic DNA-binding protein 1 enhances radiosensitivity of non-small cell lung cancer. Cancer Lett. 2022;530:100–109.
- Whittleston WG. The synthesis of 1, 2, 4-trimethyl-7-isopropylindene. J Am Chem Soc. 1937;59(5):825–826.
- Cappellacci L, Barboni G, Palmieri M, Pasqualini M, Grifantini M, Costa B, Martini C, Franchetti P. Ribose-modified nucleosides as ligands for adenosine receptors: synthesis, conformational analysis, and biological evaluation of 1’-C-methyl adenosine analogues. J Med Chem. 2002;45(6):1196–1202.
- Gabai VL, Mosina VA, Budagova KR, Kabakov AE. Spontaneous overexpression of heat-shock proteins in Ehrlich ascites carcinoma cells during in vivo growth. Biochem Mol Biol Int. 1995;35(1):95–102.
- Xiong J, Barayan R, Louie AV, Lok BH. Novel therapeutic combinations with PARP inhibitors for small cell lung cancer: a bench-to-bedside review. Semin Cancer Biol. 2022;86(Pt 2):521–542.
- Nambiar DK, Mishra D, Singh RP. Targeting DNA repair for cancer treatment: Lessons from PARP inhibitor trials. Oncol Res. 2023;31(4):405–421.
- Wang M, Xie C. DNA damage repair and current therapeutic approaches in gastric cancer: a comprehensive review. Front Genet. 2022;13:931866.