
 ?Mathematical formulae have been encoded as MathML and are displayed in this HTML version using MathJax in order to improve their display. Uncheck the box to turn MathJax off. This feature requires Javascript. Click on a formula to zoom.
ABSTRACT
The purpose of the present study was to investigate differences between front crawl and backstroke swimming in hydrodynamic (produced by swimmers) and buoyant torque around the transverse axis. Ten swimmers performed 50 m front crawl and backstroke at four selected velocities (same velocities for both techniques). All trials were recorded by four underwater and two above-water cameras to collect data for three-dimensional whole-body motion during one stroke cycle (defined as a period between two consecutive wrist entries to the water). The inverse dynamics approach was applied to obtain buoyant and hydrodynamic torque around the transverse axis. The differences between front crawl and backstroke techniques across four levels of velocity were assessed with a two-way repeated-measures ANOVA. There was a main effect of technique on the mean buoyant and hydrodynamic torque, with 30–40 % larger leg-raising buoyant torque and leg sinking hydrodynamic torque in front crawl than in backstroke (p ≤ 0.001). The time-series data revealed that the hydrodynamic leg-sinking torque had its peaks during the first half of the underwater upper-limb motion in front crawl, but that was not observed in backstroke, implying that the strategy of counterbalancing the buoyant torque is different between the techniques.
Introduction
In the aquatic environment, the human body is exposed to two vertical forces with opposite direction, namely gravity and buoyancy. When a human holds a horizontal static position in the water, the centre of mass (CM) is located about 2 cm more caudally (towards the legs) than the centre of buoyancy (CB) (Watanabe et al., Citation2017), thereby producing a rotational torque (buoyant torque) that causes the lower-limbs to sink (Gagnon & Montpetit, Citation1981; Kjendlie et al., Citation2004; Payton & Reid, Citation2014).
In the past, this phenomenon was also considered to occur during whole-body swimming (swimming with both upper- and lower-limb propulsive motions) and applied as a background assumption in research (McLean & Hinrichs, Citation1998; Pendergast et al., Citation1977). However, contrary to that belief, evidence established in the 21st century has suggested that the couple formed by the gravitational and buoyant forces does not cause the legs to sink during whole-body swimming. Due to the continuous forward and backward motion of the limbs and a large part of the upper-limbs being above the water, CM and CB locations constantly shift, which result in the couple producing leg-raising torque during most part of the stroke cycle and the mean torque during the whole cycle also being leg-raising rather than leg-sinking (Cohen, Cleary, Harrison, Mason & Pease, Citation2014; Psycharakis & Yanai, Citation2018; Yanai, Citation2001).
During the period in which CB is behind CM and produces leg-raising torque, swimmers should produce leg-sinking torque by limb motions (defined as the hydrodynamic torque in the current study) so that the mean torque in one stroke cycle becomes zero. It has been suggested that this leg-sinking hydrodynamic torque is produced due to the hydrodynamic forces acting on the hand, especially around the first half of the underwater upper limb motion (Psycharakis & Yanai, Citation2018; Yanai, Citation2001). However, this hypothesis has not been explored.
Due to the difficulty in measuring hydrodynamic forces directly in an aquatic environment, investigating the rotational effect produced by the limbs is a challenging task. One solution is the inverse dynamics approach, which is the process of indirectly determining forces and torques from kinematics and inertial properties of moving bodies. As the obtainable variables with this method are net force and net torque (Sanders et al., Citation2015, Citation2016), it is not possible to assess forces and torques produced by each limb. However, the total hydrodynamic torque can be calculated by subtracting the buoyant toque from the net torque, and the buoyant toque can be assessed using a kinematic approach, as has been done previously (Yanai, Citation2001, Citation2003, Citation2004). The buoyant torque depends on the magnitude of gravity and buoyancy and the location of CM and CB, which can be estimated by a three-dimensional motion analysis (Yanai, Citation2001, Citation2004).
Currently, knowledge of the buoyant torque during swimming and its effect on the body rotation around the transverse axis is limited to front crawl swimming (Psycharakis & Yanai, Citation2018; Yanai, Citation2001). There is one simulation study that investigated the buoyant torque around the transverse axis in the four swimming techniques (Cohen et al., Citation2014). However, the reported simulation data were based on only two swimmers (one male and one female) for each technique, and it was unclear whether the observed results reflected characteristics of each technique or largely affected by individual skills.
Furthermore, in the study by Cohen et al. (Citation2014), the water level relative to the body was only determined visually. As a slight misestimation of the water level could cause an over- or under-estimation of the underwater body volume (and consequently, the location of CB and the magnitude of the buoyancy), it is possible that there were some errors in their simulation. Therefore, buoyant torque assessment with a larger number of samples with 3D global coordinate information is required for butterfly, backstroke, and breastsroke in a similar manner to the experimental front crawl studies (Psycharakis & Yanai, Citation2018; Yanai, Citation2001).
Among the three swimming techniques other than front crawl, backstroke swimming is especially interesting to compare with front crawl because both techniques involve alternating motions of the right and left upper limbs and flutter kicking. Since swimmers move their left and right upper limb back and forth alternatively in front crawl and backstroke, a similar CM shift pattern along the cephalic-caudal direction could be expected in both techniques. On the other hand, the mean underwater volume of swimmers is larger in backstroke than in front crawl (Gonjo et al., Citation2020), presumably due to a larger net upward hydrodynamic force acting on swimmer’s body (produced by upper- and lower-limb motions such as down-sweep and downward kicking) in front crawl than in backstroke that cases higher body position in front crawl. This implies that the magnitude of CB shift might be different between the two techniques.
From a perspective of propulsive efficiency, swimmers should maximise the kinetic energy that directly contributes to the forward motion while minimising the energy ‘wasted’ for other purposes (Zamparo et al., Citation2011), such as sideways motion or excessive body rotation. Therefore, having a large amount of buoyant torque would be a disadvantage regardless of whether it has a leg-raising or -sinking effect, because swimmers would have to produce an equal amount of hydrodynamic torque (in other words, a large amount of kinetic energy that does not directly contribute to propulsion) to counterbalance it. Given that backstroke is less efficient than front crawl (Gonjo et al., Citation2018), it could be hypothesised that swimmers would have a larger magnitude of buoyant torque around the transverse axis in the former technique than the latter. The purpose of the current study was to investigate differences in the buoyant and hydrodynamic torque around the transverse axis between front crawl and backstroke swimming to test this hypothesis.
Materials and methods
Participants
The same dataset as Gonjo et al. (Citation2020), which was composed of 80 swimming trials (10 male swimmers × two swimming techniques × four swimming velocities), was used in the present study. The participants (mean ± standard deviation) were 17.5 ± 1.0 years, with 1.79 ± 0.05 m height and 69.9 ± 6.5 kg body mass. More details of the participants are described in Gonjo et al. (Citation2020). Before the testing session, participants were informed about the procedure, benefits, and potential risks of the study, which were approved by the ethics committees of the University, and written informed consent was then obtained from each of them.
Testing protocol
Participants were marked on 19 anatomical landmarks using black oil and wax-based cream (Grimas Créme Make-Up) as described previously (Gonjo et al., Citation2020). They were photographed from front and side views simultaneously by two digital cameras (Lumix DMC-FZ40, Panasonic, Osaka, Japan), which were manually digitised to obtain personalised body segment parameters by the elliptical zone method (Jensen, Citation1978). The mass, volume, location of the mass centre, and moments of inertia of each segment were obtained using the ‘E-Zone’ software (Deffeyes & Sanders, Citation2005; R. Sanders et al., Citation2015).
Swimmers performed their individual warm-ups, with the distance and intensity being identical on both front crawl and backstroke testing days. The testing consisted of four 50 m trials for each technique with about 83, 88, 93, and 100 % of their backstroke maximum swimming velocity (vBS83, vBS88, vBS93, and vBS100; the absolute mean velocity of 1.26 ± 0.09, 1.36 ± 0.08, 1.43 ± 0.09, and 1.55 ± 0.07 m/s). These testing velocities were not only used for backstroke but also in front crawl trials to compare the outcome variables at the same swimming velocity. The trials for front crawl and backstroke were conducted on different days with 24–48 h separation, and the order of sessions and trials was fully randomised. The testing velocity was instructed to swimmers using a visual light pacer [Pacer2Swim, KulzerTEC, Santa Maria da Feira, Portugal; details of the system and the setting are described in Gonjo et al. (Citation2019)].
Data collection
The centre lane of a 25 m indoor pool (water and air temperature of 27 and 28 °C, respectively) was calibrated using a calibration frame with 6 m length aligned with the swimming direction (X), 2.5 m height (Y), and 2 m width (Z) (De Jesus et al., Citation2015) with 64 control points (calibration volume of 9.6 m3 and 20.4 m3 with 26 and 46 control points for in-air and underwater calibratioin, respectively. Eight cotrol points were located at the surface of the water), which were used as input to a 3D direct linear transformation reconstruction. The reconstruction errors were less than 0.1, 0.3, and 0.4 % in the X-, Y-, and Z-direction, respectively. The calibrated space was captured by four underwater and two above-water cameras (HDR-CX160E, Sony, Tokyo, Japan), which were synchronised using a light-emitting diode system, at a sampling frequency of 50 Hz.
During the testing, swimmers were instructed not to breathe in the calibrated area in front crawl to avoid breathing motions affecting their upper-limb kinematics (Figueiredo et al., Citation2013; McCabe et al., Citation2015). Swimmers were also required to avoid underwater kicking after the push-off to ensure the calibrated space was covered entirely by their whole-body swimming motion without the influence of the underwater locomotion. Moreover, the latter half of 50 m was selected for the analysis to minimise the effect as some swimmers travelled longer underwater in the first lap than the second one.
Data processing and analysis
The period between the wrist entry of one upper limb to the subsequent entry of the same wrist was defined as one stroke cycle. The Ariel Performance Analysis System (APAS-2000 Ariel Dynamics, San Diego, CA) software was used to manually digitise the 19 anatomical landmarks in every second video field that yield the 3D landmark coordinates with a sampling frequency of 25 Hz (Gonjo et al., Citation2019). The coordinate data were then smoothed using a 4th order Butterworth filter with a 4 Hz cut-off frequency, as the Fourier spectral analysis on the raw coordinates data showed little power contained in frequencies above 4 Hz (<1%). Using the landmark coordinate data and body segment parameters obtained by e-Zone, whole-body CM of swimmers were computed for each field. The 3D coordinate data were converted to 101 points representing stroke cycle percentiles for a greater temporal resolution of the coordinate data than the original dataset using Fourier transform and inverse transform.
The buoyant torque was obtained by the cross product of the position vector from the CM to CB and the buoyant force acting through the CB. The buoyancy force was computed as the volume of the body below the water surface (Y = 0) multiplied by the specific weight of the water with 27 °C (9.77 kN·m−3). The underwater volume of each segment was computed in the same manner reported in a previous study (Gonjo et al., Citation2020), and the location of the CB was computed as the weighted average of the centre of wetted volume of the segments. The net torque was computed as the time derivative of the whole body angular momentum using the same procedure described by Sanders et al. (Citation2016). Both buoyant and net torques were obtained for each percentile time point, and the torque component parallel to the Z-axis was used in the current study. The hydrodynamic torque around the transverse axis was obtained by subtracting the buoyant torque from the net torque data at the corresponding time-series data frame.
Since it has been suggested that the hydrodynamic torque produced by the hand might affect the magnitude of trunk incline (Zamparo et al., Citation2009), the trunk angle (θ) relative to the horizontal line on the X-Y plane was computed as:
Where TVxi and TVyi are the X and Y components of the trunk vector (the position vector of the midpoint of the shoulders with respect to the midpoint of the hips) at ith time percentile. The mean Y-displacement of the mid-shoulder, mid-hip, and CM during the stroke cycle was also computed because the shoulder and hip displacements are the determinants of the trunk θ, and the absolute displacement of those body parts are related to the CM position.
The analysed cycle was divided into five phases to interpret the obtained time-series torque data in relation to swimmers’ upper limb motion, namely: the entry phase, defined as the time from the instant of wrist entry until the wrist started moving backwards relative to the external reference frame; pull and push phases, determined as the period when the wrist maintained its backward motion, which was divided into the respective phases when the wrist vertically aligned with the shoulder; release phase, established as the period between the end of the push phase until the instant the wrist exited the water; and recovery phase, being the period during which the wrist was above the water.
Statistical analysis
A two-way repeated-measures analysis of variance (ANOVA) was used to assess the effect of the technique (front crawl and backstroke) and velocity (vBS83, vBS88, vBS93, and vBS100) on the analysed variables. Sphericity of the data was checked with Mauchly’s test, and the F-value was adjusted according to the Greenhouse-Geisser procedure when the assumption of sphericity was not met. When significant main effects were observed, multiple comparisons between each velocity in a single technique or between the two techniques at each testing velocity were performed with a paired-sample t-test with adjusting the alpha-level by the Holm-Bonferroni procedure (Holm, Citation1979).
Before the ANOVA test, the normality of data was checked using the Shapiro-Wilk test and confirmed in all variables apart from trunk θ at vBS83 in front crawl and the mean buoyant torque at vBS100 in backstroke. For statistical tests related to these two non-normally distributed variables, datasets were converted using the Box-Cox transformation (Osborne, Citation2010) to apply parametric testing methods. The ANOVA and Shapiro-Wilk tests were performed with IBM SPSS Statistics 24 (IBM Corporation, Somers, NY, USA) with the statistical significance level of p < 0.05. The Holm-Bonferroni correction and the Box-Cox transformation were completed with a purpose-made programme on MATLAB R2019a (MathWorks, Inc., Natick, MA, USA)
Results
Descriptive statistics and the results from the ANOVA test are summarised in . No interaction between the technique and velocity effects were observed in all analysed variables. Swimmers showed main effect of technique on the mean buoyant and hydrodynamic torque (both p < 0.001) with front crawl having a larger buoyant torque (larger leg-raising torque) and a smaller hydrodynamic torque (larger leg-sinking torque) at all trials (p ≤ 0.001). There was no main effect of velocity observed in the mean torques. A main effect of technique was also observed in the Y-displacement of the mid-shoulder and CM (p ≤ 0.008), in which swimmers exhibited larger Y-displacement (closer to the water surface) in front crawl than in backstroke at all trials (p ≤ 0.03). On the other hand, there was no main effect of technique in the trunk θ and Y-displacement of the mid-hip. There was a main effect of velocity on the three Y-displacement variables (p < 0.001) and the trunk θ (p = 0.03), with the Y-displacement variables tending to increase as the velocity increased. However, despite the significance of velocity effect on the trunk θ, multiple comparisons did not detect any differences in this variable between the trials (p ≥ 0.11).
Table 1. Mean ± standard deviation of the analysed variables and the results from the ANOVA test.
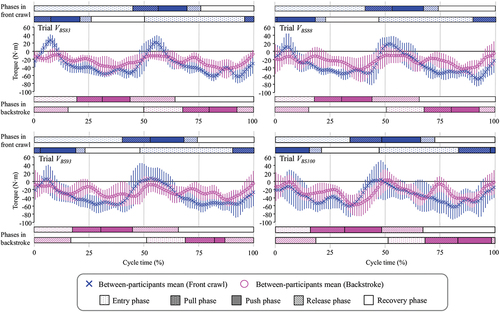
The mean time-series buoyant and hydrodynamic torque data with the phase information of both upper limbs are displayed in , respectively. In both front crawl and backstroke, swimmers showed two buoyant torque peaks (peak leg-raising torque) when one upper-limb was performing its recovery motion. In front crawl, the participants showed the same tendency in the hydrodynamic torque, in which they exhibited two negative peaks (peak leg-sinking torque) when each upper limb was in the entry or pull phase. However, they exhibited several small hydrodynamic torque peaks in backstroke instead of clear two peaks.
Figure 1. Time-series buoyant torque during the analysed stroke cycle in front crawl and backstroke (the vertical line on each data point shows between-participant standard deviation).
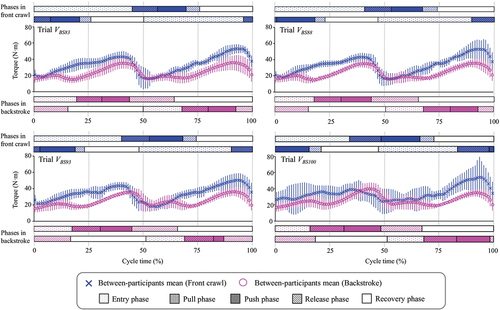
Figure 2. Time-series hydrodynamic torque during the analysed stroke cycle in front crawl and backstroke (the vertical line on each data point shows between-participant standard deviation).
Discussion and implications
The purpose of the present study was to investigate differences in the buoyant and hydrodynamic torque around the transverse axis between front crawl and backstroke swimming, and it was hypothesised that swimmers would show a larger magnitude of buoyant torque around the transverse axis in backstroke than in front crawl. A larger positive buoyant torque in front crawl than in backstroke at all trials clearly indicated that the leg-raising effect due to the buoyant torque is larger in front crawl regardless of the swimming velocity. Accordingly, swimmers produced a smaller negative hydrodynamic torque (a larger leg-sinking hydrodynamic torque) in front crawl than in backstroke to counterbalance the leg-raising buoyant torque. These results were counter to our initial hypothesis, and consequently, differences in the buoyant and hydrodynamic torque are not an explanation for a lower propulsive efficiency in backstroke than in front crawl (Gonjo et al., Citation2018, Citation2020).
In the current study, breathing during the testing was controlled only in front crawl but not in backstroke, and it should be noted that it is a limitation of the study that lung volume was considered to be equal between front crawl and backstroke conditions. However, this lack of consideration should not have affected the results to a large exrtent. It has been reported that the peak tidal volume of competitive swimmers during exercise is around 3.1 litre (Rosser-Stanford et al., Citation2019). Accoring to Yanai (Citation2001), 3 litre difference in the lung volume would cause less than 5 Nm buoyant torque calculation. Given that the difference in the buoyant torque between front crawl and backstroke was approximately 7.6–9.4 Nm, it is unlikely that the equal lung volume assumption biased the results obtained in the current study.
Despite the difference in the magnitude, the pattern of the buoyant torque in front crawl and backstroke was similar. In both techniques, swimmers showed a clear two-peaks buoyant torque pattern, with the peaks corresponding to the timing when each upper limb was performing the recovery motion due to a part of the upper body being above the water that shifted the CB caudally. This was in agreement with a previous study that showed large buoyant leg-raising torque peaks when one arm was above the water in front crawl swimming (Yanai, Citation2001). The similarity in the buoyant torque pattern between the front crawl and backstroke was reasonable since swimmers perform an alternating left and right upper limbs in both techniques.
Conversely, the hydrodynamic torque showed distinct patterns between the two techniques. In front crawl, swimmers had a two-peaks pattern with the leg-sinking torque peaks occurring when each arm was in the entry or pull phase. The large hydrodynamic torque during the first half of the underwater upper-limb motion has been suggested as a possibility in previous studies (Psycharakis & Yanai, Citation2018; Yanai, Citation2001), which is now supported by the results in the current study. Yanai (Citation2001) also speculated that the latter half of the underwater upper limb motion (push and release phase) might also produce a large leg-sinking torque due to potential upward forces produced by the hand behind CM location. However, our results did not exhibit large hydrodynamic leg-sinking torque during these phases.
On the other hand, in backstroke, swimmers did not clearly show two hydrodynamic leg-sinking torque peaks. This implies that swimmers utilise a different strategy to produce the leg-sinking hydrodynamic torque. One possibility is that swimmers rely more on the lower limb motion than the upper limb to produce the leg-sinking torque in backstroke. It has been reported that kicking with the dorsal side of the foot produces a larger hydrodynamic force than kicks with the plantar side (Ichikawa et al., Citation2014). In backstroke, kicking motion with the dorsal side of the foot corresponds to the upward kick due to the supine position of the body, and therefore each kick should create leg-sinking torque. This hypothesis might explain why swimmers have many small hydrodynamic leg-sinking torque peaks in backstroke, as expert swimmers commonly perform six kicks in one stroke cycle (Lerda & Cardelli, Citation2003).
The difference in the magnitude of the hydrodynamic leg-sinking torque and the potential difference with the strategy also could explain why the vertical (Y) displacement of the CM and shoulder are higher in front crawl than in backstroke. Based on the hypothesis presented above, swimmers produce the leg-sinking hydrodynamic torque with upward and downward forces in front crawl and backstroke, which should contribute to raise and lower the vertical displacement of CM, respectively. Especially, the hydrodynamic force produced by the hand during the entry and pull phase should create upward force, and its moment around the transverse axis causes a leg-sinking effect (i.e., raising the head and shoulder). Therefore, it is logical to conclude that the hydrodynamic force produced by the upper-limbs in the first half of the underwater stroke is a probable explanation of the higher vertical shoulder displacement in front crawl than in backstroke, which consequently results in a higher vertical CM displacement in the former technique than the latter.
These possibilities could explain why front crawl has a higher Froude efficiency and smaller underwater body volume than in backstroke, which has been established by a study with the same dataset as the present one (Gonjo et al., Citation2020). Despite the fact that swimmers produce a larger leg-sinking torque in front crawl by the hand, the hand motion also contributes to elevating the body position in front crawl, which results in a smaller underwater body volume and thereby reducing the active drag and enhances the efficiency. Nevertheless, the effect of the forces produced by the upper and lower limbs should be further investigated to fully support this hypothesis.
In conclusion, swimmers produce a larger hydrodynamic leg-sinking torque in front crawl than in backstroke to compensate for a greater leg-raising buoyant torque. The source of the hydrodynamic torque is likely different between the two techniques, which implies that swimmers and coaches should not consider the role of the limb motion to be similar between the techniques. More specifically, kick motion might be more important in backstroke from a perspective of controlling the rotational torque around the transverse axis. The smaller underwater volume in front crawl than in backstroke reported in a previous study is likely due to the higher CM position in front crawl. A potential source of the high CM position in front crawl is a vertical hydrodynamic force produced by the hand and its moment around the transverse axis of the body at the beginning of the underwater stroke motion, which, in theory, especially elevate the shoulder position of the swimmer.
Disclosure statement
No potential conflict of interest was reported by the author(s).
Correction Statement
This article has been republished with minor changes. These changes do not impact the academic content of the article.
Additional information
Funding
References
- Cohen, R. C., Cleary, P. W., Harrison, S. M., Mason, B. R., & Pease, D. L. (2014). Pitching effects of buoyancy during four competitive swimming strokes. Journal of Applied Biomechanics, 30(5), 609–618. https://doi.org/10.1123/jab.2013-0260
- De Jesus, K., De Jesus, K., Figueiredo, P., Vilas-boas, J. P., Fernandes, R. J., & Machado, L. J. (2015). Reconstruction accuracy assessment of surface and underwater 3D motion analysis: A new approach. Computational and Mathematical Methods in Medicine, 2015, 1–8. https://doi.org/10.1155/2015/269264
- Deffeyes, J., & Sanders, R. (2005). Elliptical zone body segment modeling software-Digitising, modeling and body segment parameter calculation. Proceedings of the 23rd international symposium on biomechanics in sports.
- Figueiredo, P., Sanders, R., Gorski, T., Vilas-Boas, J. P., & Fernandes, R. J. (2013). Kinematic and electromyographic changes during 200 m front crawl at race pace. International Journal of Sports Medicine, 34(1), 49–55. https://doi.org/10.1055/s-0032-1321889
- Gagnon, M., & Montpetit, R. (1981). Technological development for the measurement of the center of volume in the human body. Journal of Biomechanics, 14(4), 235–241. https://doi.org/10.1016/0021-9290(81)90068-3
- Gonjo, T., McCabe, C., Coleman, S., Soares, S., Fernandes, R. J., Vilas-Boas, J. P., & Sanders, R. (2019). Do swimmers conform to criterion speed during pace-controlled swimming in a 25-m pool using a visual light pacer? Sports Biomechanics / International Society of Biomechanics in Sports, 1–14. https://doi.org/10.1080/14763141.2019.1572781
- Gonjo, T., McCabe, C., Sousa, A., Ribeiro, J., Fernandes, R. J., Vilas-Boas, J. P., & Sanders, R. (2018). Differences in kinematics and energy cost between front crawl and backstroke below the anaerobic threshold. European Journal of Applied Physiology, 118(6), 1107–1118. https://doi.org/10.1007/s00421-018-3841-z
- Gonjo, T., Narita, K., McCabe, C., Fernandes, R. J., Vilas-Boas, J. P., Takagi, H., & Sanders, R. (2020). Front crawl is more efficient and has smaller active drag than backstroke swimming: kinematic and kinetic comparison between the two Techniques at the same swimming speeds. Frontiers in Bioengineering and Biotechnology, 8, 570657. https://doi.org/10.3389/fbioe.2020.570657
- Holm, S. (1979). A simple sequentially rejective multiple test procedure. Scandinavian Journal of Statistics, 65–70. https://www.jstor.org/stable/4615733
- Ichikawa, H., Kuriki, A., Taba, S., & Taguchi, M. (2014). Difference of hydrodynamic force on foot between front crawl six-beat and flutter kicking [Paper presentation]. XIIth international symposium for biomechanics and medicine in swimming, Canberra, Australia.
- Jensen, R. K. (1978). Estimation of the biomechanical properties of three body types using a photogrammetric method. Journal of Biomechanics, 11(8–9), 349–358. https://doi.org/10.1016/0021-9290(78)90069-6
- Kjendlie, P. L., Stallman, R. K., & Stray-Gundersen, J. (2004). Passive and active floating torque during swimming. European Journal of Applied Physiology, 93(1–2), 75–81. https://doi.org/10.1007/s00421-004-1165-7
- Lerda, R., & Cardelli, C. (2003). Analysis of stroke organisation in the backstroke as a function of skill. Research Quarterly for Exercise and Sport, 74(2), 215–219. https://doi.org/10.1080/02701367.2003.10609083
- McCabe, C. B., Sanders, R., & Psycharakis, S. G. (2015). Upper limb kinematic differences between breathing and non-breathing conditions in front crawl sprint swimming. Journal of Biomechanics, 48(15), 3995–4001. https://doi.org/10.1016/j.jbiomech.2015.09.012
- McLean, S. P., & Hinrichs, R. N. (1998). Sex differences in the centre of buoyancy location of competitive swimmers. Journal of Sports Sciences, 16(4), 373–383. https://doi.org/10.1080/02640419808559365
- Osborne, J. (2010). Improving your data transformations: Applying the Box-Cox transformation. Practical Assessment, Research, and Evaluation, 15, Article 12. https://doi.org/10.7275/qbpc-gk17
- Payton, C. J., & Reid, A. K. (2014). Buoyant (leg-sinking) torque in able-bodied swimmers and swimmers with impaired leg functions [Pape presentation]. XIIth international symposium for biomechanics and medicine in swimming, Canberra, Australia.
- Pendergast, D. R., Di Prampero, P. E., Craig, A. B., Wilson, D. R., & Rennie, D. W. (1977). Quantitative analysis of the front crawl in men and women. Journal of Applied Physiology: Respiratory, Environmental and Exercise Physiology, 43(3), 475–479. https://doi.org/10.1152/jappl.1977.43.3.475
- Psycharakis, S. G., & Yanai, T. (2018). How does buoyancy affect performance during a 200m maximum front crawl swim? Journal of Sports Sciences, 36(18), 2061–2067. https://doi.org/10.1080/02640414.2018.1436188
- Rosser-Stanford, B., Backx, K., Lord, R., & Williams, E. M. (2019). Static and dynamic lung volumes in swimmers and their ventilatory response to maximal exercise. Lung, 197(1), 15–19. https://doi.org/10.1007/s00408-018-0175-x
- Sanders, R., Chiu, C. Y., Gonjo, T., Thow, J., Oliveira, N., Psycharakis, S., Payton, C.J., & McCabe, C. (2015). Reliability of the elliptical zone method of estimating body segment parameters of swimmers. Journal of Sports Science & Medicine, 14(1), 215–224. https://www.jssm.org/jssm-14-215.xml%3EFulltext
- Sanders, R. H., Gonjo, T., & McCabe, C. B. (2015). Reliability of three-dimensional linear kinematics and kinetics of swimming derived from digitized video at 25 and 50 hz with 10 and 5 frame extensions to the 4 th order butterworth smoothing window. Journal of Sports Science & Medicine, 14(2), 441–451. https://www.jssm.org/jssm-14-441.xml%3EFulltext
- Sanders, R. H., Gonjo, T., & McCabe, C. B. (2016). Reliability of three-dimensional angular kinematics and kinetics of swimming derived from digitized video. Journal of Sports Science & Medicine, 15(1), 158–166. https://www.jssm.org/jssm-15-158.xml%3EFulltext
- Watanabe, Y., Wakayoshi, K., & Nomura, T. (2017). New evaluation index for the retainability of a swimmer’s horizontal posture. PLoS One, 12(5), e0177368. https://doi.org/10.1371/journal.pone.0177368
- Yanai, T. (2001). Rotational effect of buoyancy in frontcrawl: Does it really cause the legs to sink? Journal of Biomechanics, 34(2), 235–243. https://doi.org/10.1016/s0021-9290(00)00186-x
- Yanai, T. (2003). Stroke frequency in front crawl: Its mechanical link to the fluid forces required in non-propulsive directions. Journal of Biomechanics, 36(1), 53–62. https://doi.org/10.1016/s0021-9290(02)00299-3
- Yanai, T. (2004). Buoyancy is the primary source of generating bodyroll in front-crawl swimming. Journal of Biomechanics, 37(5), 605–612. https://doi.org/10.1016/j.jbiomech.2003.10.004
- Zamparo, P., Capelli, C., & Pendergast, D. (2011). Energetics of swimming: A historical perspective. European Journal of Applied Physiology, 111(3), 367–378. https://doi.org/10.1007/s00421-010-1433-7
- Zamparo, P., Gatta, G., Pendergast, D., & Capelli, C. (2009). Active and passive drag: The role of trunk incline. European Journal of Applied Physiology, 106(2), 195–205. https://doi.org/10.1007/s00421-009-1007-8