
ABSTRACT
The effects of an eight-week off-season strength training program upon lower-body strength, power, eccentric capacity, front foot contact (FFC) kinetics, and ball release speed (BRS) in pace bowlers were investigated. Ten elite-academy pace bowlers completed the intervention, and pre- and post-testing. Pre- and post-testing included: double (DLDL) and single leg (SLDL) drop landings; isometric mid-thigh pull (IMTP); countermovement jump; and pace bowling performance (two-over bowling spell measuring BRS and FFC kinetics). Changes from pre- to post-testing were assessed with paired sample t tests (p≤ 0.01), effects sizes and statistical parametrical mapping. Post-testing revealed a significant decrease in peak normalised vertical force during DLDL and SLDL with large effects and a significant, moderate effect increase in IMTP. There was no significant changes in BRS. Concomitantly, neither discrete scalar (p= 0.15-0.58) nor vector field analysis kinetics during FFC indicated significant changes. No significant alterations in FFC kinetics may explain the lack of improvement in BRS (pre = 31.55 ± 1.44 m/s; post = 31.79 ± 1.33 m/s). This study indicated an eight-week strength training program can improve strength and eccentric capacity in pace bowlers, and these changes when developed in the absence of skills training neither improved nor decreased pace bowling performance.
Introduction
The objective of pace bowling in cricket is to dismiss a batter for as few runs as possible. One strategy pace bowlers will adopt is to maximise ball release speed (BRS) so as to decrease the decision-making and stroke execution time of the opposing batters. To generate a high BRS, pace bowlers will complete the run-up before an explosive leap into the delivery stride. The delivery stride comprises high vertical and braking ground reaction forces (GRF) experienced at rear and front foot contact (FFC). This occurs while the upper body undergoes rapid lateral trunk flexion and hyperextension into ball release (Bartlett et al., Citation1996; Elliott, Citation2000; Glazier et al., Citation2000; Hurrion et al., Citation2000; Portus et al., Citation2004). Pace bowlers will complete these specific movements during each delivery of training and match-play, interspersed by periods of high- and low-intensity running and athletic movement (i.e., jumping, diving and throwing).
Research on the relationship between BRS and GRF during FFC for pace bowlers has suggested that in elite and high-performance male pace bowlers, increased BRS is associated with higher peak vertical and braking forces (Callaghan et al., Citation2021; Phillips et al., Citation2010; Portus et al., Citation2004). However, King et al. (Citation2016) outlined no significant relationship between BRS and peak GRFs but rather suggested a large braking impulse during FFC was the best predictor of BRS for elite male pace bowlers. Despite this conjecture, it would appear evident that the GRFs expressed during FFC play a pivotal role in BRS for pace bowlers. Therefore, pace bowlers must ensure they have the necessary lower-limb strength and neuromuscular control to appropriately attenuate and utilise the forces experienced during FFC.
Despite the recommendations within the literature about the importance of strength training for pace bowlers (Mukandi et al., Citation2014; Stronach et al., Citation2014), the wide use of strength training within professional cricket to improve performance (Weldon et al., Citation2020), and the potential link between physical capacity (strength) and expressions of force (GRF at FFC) (Suchomel et al., Citation2016), there has been limited analysis of training interventions in pace bowlers to improve BRS. Furthermore, the lack of research into strength training for pace bowlers, is in spite of strength training being shown to improve similar skills such as throwing (Hermassi et al., Citation2011), as well as links between physical capacities that should contribute to pace bowling performance, such as lower-limb unilateral strength (McCurdy et al., Citation2005) and neuromuscular control (Herman et al., Citation2009; Hewett et al., Citation1996). These key physical qualities are also expected to be necessary for the utilisation of GRFs during FFC to optimise BRS. Neuromuscular control refers to the ability to appropriately attenuate high GRFs (Herman et al., Citation2009; Hewett et al., Citation1996), and within this study was assessed by measures of eccentric capacity (e.g., GRF attenuation during drop landings). Lower-limb strength and eccentric capacity are of great importance to pace bowlers due to the high loads experienced during FFC that require rapid deceleration of the gained momentum from the run-up. However, the extent to which FFC GRFs can be modified via resistance training enhancing BRS has yet to be investigated.
Pace bowling coaching interventions have previously focussed upon changing technical factors associated with injury. Specifically, Elliott and Khangure (Citation2002) and Ranson et al. (Citation2009) could significantly reduce the amount of shoulder counter-rotation during the delivery stride among adolescent pace bowlers, a variable typically associated with lower back injuries (Elliott, Citation2000). However, a similar result has not been achieved when attempting to modify technical characteristics associated with a higher BRS, such as lower-limb kinematics during the delivery stride (Ranson et al., Citation2009). Importantly, the coaching interventions of the previously discussed studies (Elliott, Citation2000; Ranson et al., Citation2009) did not appropriately incorporate techniques that target GRF production. This is important because if a pace bowler does not have the necessary lower-limb strength or eccentric capacity to attenuate the high forces experienced during FFC, no change in performance would be anticipated, regardless of the coaching cues and techniques adopted. Potentially, increases in lower-limb strength and eccentric capacity may be necessary before undertaking a coaching intervention to elicit meaningful biomechanical changes; however, further research is needed to assess this hypothesis.
To date, only Feros et al. (Citation2020), Wickington and Linthorne (Citation2017), and Petersen et al. (Citation2004) have investigated the implications of strength training upon BRS among pace bowlers. Both Wickington and Linthorne (Citation2017) and Petersen et al. (Citation2004) found that a special resistance training programme, utilising underweight and overweight cricket balls, failed to significantly improve BRS in well-trained and senior club cricketers. Interestingly, Feros et al. (Citation2020) reported a ‘clear moderate’ (mean difference ± 95% CLs; 1.2 ± 1.5 m/s) increase in peak BRS for a combined resistance training group, with the traditional cricket training group outlining an ‘unclear’ (mean difference ± 95% CLs; 0.2 ± 1.3 m/s) change in BRS between pre- and post-testing. However, the use of a combined resistance training design of a single upper-body exercise (pull-ups), sprint training (resisted and free sprinting), and fast bowling training, while very practical, may not allow for the determination of whether strength and eccentric capacity changes can contribute to an increase in BRS. Therefore, this research aimed to determine the effects of an 8-week strength training intervention upon BRS in current and previous state pathway pace bowlers. The effects of strength training upon lower-limb strength and power, and lower-limb bilateral and unilateral eccentric capacity were also determined. It was hypothesised that the 8-week training intervention would increase strength, power, and eccentric capacity measures, leading to alterations in GRF during FFC. It was further hypothesised that these changes would result in an increase in BRS for pace bowlers.
Materials and methods
Participants
A convenience sample of 10 healthy male cricketers was recruited for this study (age = 21.2 ± 4.6 years; height = 1.85 ± 0.05 m; body mass = 83.2 ± 7.4 kg; resistance training age = 2.4 ± 1.7 years). The sample size was based upon previous strength training studies in athletic populations (Nimphius et al., Citation2012; Petersen et al., Citation2004). Importantly, the recruitment of specific sub-populations within cricket of an elite-academy standard inclusion criteria included: current or previous involvement in an Australian state cricket development pathway, currently playing first or second grade in an Australian state premier league, greater than 17 years of age, and free of any existing medical conditions that were contrary to participation. Four left- and six right-arm pace bowlers participated in the study. All participants (and guardians of participants under 18 years of age) received a clear explanation of the study, including the risks and benefits of participation, and provided written informed consent prior to participation. The research was approved by the institutional ethics committee (Approval 11948).
Procedures
The study examined the effects of a strength training intervention upon pace bowling FFC kinetics and BRS via a longitudinal analysis of high-level cricket pace bowlers. Participants undertook pre- and post-testing separated by an 8-week off-season training intervention. Prior to the commencement of data collection, the participant’s chronological age, resistance training age, height, and body mass were recorded. Height was measured barefoot using a stadiometer (Ecomed Trading, Seven Hills, Australia). Body mass was recorded using digital scales (Tanita Corporation, Tokyo, Japan). The physical capacity assessments included: double- and single-leg drop landings; countermovement jump (CMJ); and isometric mid-thigh pull (IMTP) and were all performed on a calibrated portable force plate (400 Series Performance Force Plate, Fitness Technology, Adelaide, Australia) measuring vertical force at 600 Hz. The pace bowling assessment required participants to complete a two-over bowling spell as if under match conditions. FFC GRFs and BRS were calculated for each delivery. A standardised warm-up, consisting of general and specific exercises was used for all participants. Following pre-testing, participants began the training intervention, which involved two 1-hour sessions per week, on non-consecutive days, for 8 weeks (Feros et al., Citation2020; McBride et al., Citation2002; Nimphius et al., Citation2012). Participants adhered to 100% of the sessions, and post-testing was conducted within a week of the participant’s final training session using the same procedures as pre-testing.
Drop landing
The double- and single-leg drop landings, measures of lower-limb eccentric capacity, were chosen to provide a quantitative measure of neuromuscular control (Decker et al., Citation2003). Improvements in double- and single-leg drop landing performance, shown by decreased vertical GRF, would represent an enhanced ability to appropriately attenuate the high forces upon landing (Decker et al., Citation2003). In pace bowling, an enhanced ability to attenuate and utilise the high GRFs experienced at FFC is critical to optimising the technique and ultimately BRS (King et al., Citation2016; Middleton et al., Citation2016; Phillips et al., Citation2010; Portus et al., Citation2004). The double- and single-leg drop landing performance was assessed using established procedures (Hargrave et al., Citation2003; Sheppard et al., Citation2013; Tran et al., Citation2015). Participants were familiarised with both the double- and single-leg drop landing assessments by performing three or more practice trials of each prior to data collection. Participants performed three trials of the double-leg drop landing, stepping forwards from a box height of 0.5 m with hand on hips. Participants were instructed to land as ‘soft as possible’ on both feet (Tran et al., Citation2015).
The single-leg drop landing assessment included three trials on each of the left and right feet (six in total) from a box height of 0.3 m (Hargrave et al., Citation2003). The order (left or right first) was randomised for each participant. In the single-leg drop landing, participants were instructed to step forward off the box with their landing leg with all other instructions identical to the double-leg drop landing. A 1-minute rest period was instituted between trials for both the double- and single-leg drop landings, with a 3-minute rest interval between practice trials and recorded test trials, as well as between test conditions. Peak landing vertical force was recorded for all trials. Single-leg drop landing results were classified as front and back foot based upon each participant’s landing pattern during their pace bowling delivery stride. All measures were normalised to body weight (BW) and the average of three trials was used for analysis.
Countermovement jump
The CMJ was used as a measure of lower-limb (system) power in the vertical plane. Participants were familiarised with the CMJ by performing three or more practice trials prior to data collection. The CMJ was performed with a carbon fibre rod (0.25 kg) held at the base of the neck and with procedures previously described (Secomb et al., Citation2015). Briefly, participants performed three trials with a 1-minute rest between trials. Participants were instructed to jump as high as possible, and no restrictions were placed on the countermovement range during the eccentric phase of the jump (Nimphius et al., Citation2012). Customised computer software (Ballistic Measurements System, Fitness Technology, Adelaide, Australia) was utilised to determine peak power normalised to BW. The average of the three trials was used for analysis.
Isometric mid-thigh pull
The IMTP is a reliable test of lower-limb strength and is also part of the Cricket Australia testing battery (Secomb et al., Citation2015). The procedures used to perform the IMTP have been previously described and was completed on the aforementioned force plate within a customised power rack. The customised power rack allowed the bar to be fixed for each participant. Participants were instructed to grip the bar in a position similar to that of a second pull of a power clean (Secomb et al., Citation2015), with an upright trunk position so that their shoulders were in line with the bar, in their preferred position for the pull (Comfort et al., Citation2015). Wrist straps were utilised for all participants to ensure that grip strength was not a limiting factor for the measurement of lower-limb strength. Participants were instructed to pull as hard as possible on the bar while driving their feet as hard as possible into the force plate (Secomb et al., Citation2015; Sheppard et al., Citation2013). Each participant was required to complete two trials of the IMTP, with a 2-minute rest between trials. A third trial was performed in the event that a difference in the vertical peak force between the two trials was greater than 250 N (Secomb et al., Citation2015). The average of all completed trials for each participant normalised to BW was used for analysis.
Pace bowling performance testing
The dimensions of the laboratory allowed each participant to use their normal full-length run-up and follow-through while bowling deliveries on the equivalent of a standard-sized cricket pitch. An in-ground three-dimensional force plate (9287CA, Kistler Group, Winterthur, Switzerland) sampling at 960 Hz was used to collect GRF data during the FFC of the delivery stride. FFC corresponded to the first instance at which the vertical GRF exceeded 20 N (Callaghan et al., Citation2019; Nedergaard et al., Citation2017). The flooring surface (Mondo S.p.A., Alba, Italy) of the laboratory and on-top of the force platform was consistent. All trials were filmed with a high-speed iPhone camera (Apple Inc., Cupertino, USA) at 240 Hz from a position perpendicular to the delivery stride to sync FFC on the force plate and ball release using video analysis software (Kinovea—0.8.15, Kinovea, France). Ball release was determined as the first visible frame where the ball had left the hand (Feros et al., Citationin press; Glazier et al., Citation2000; Portus et al., Citation2000). A Stalker Pro ΙΙ speed radar gun (Stalker Radar, Oregon, USA) was located behind the batting stumps net and aimed at the ball release point to measure BRS. A two-over spell, comprising 12 deliveries on a standard sized cricket pitch, was performed by each participant. Participants were instructed to target different delivery lengths (short, 7–10 m; good, 4–7 m; and full, 0–4 m from the batter’s stumps) in a randomised order to replicate the different delivery lengths within match-play (Callaghan et al., Citation2020). Participants delivered each ball as if under match conditions and hence a self-selected active recovery (i.e., walking back to their bowling mark) was permitted between deliveries. A 4-minute rest period was provided between the first and second overs, as this is the approximate duration of an over within match-play (Portus et al., Citation2000). Although atypical of match-play, no batter was present during testing as the focus of the study was on BRS as a measure of performance and not accuracy or batter dismissal. All bowlers used a red kookaburra four-piece cricket ball (156 g) (Thompson Pty. Ltd., Australia) and wore their own bowling spikes during testing.
The FFC GRF data were treated with a fourth order, zero-phase, Butterworth digital filter with a cut-off frequency of 50 Hz was applied to the data using MATLAB R2015b (The MathWorks Inc., Massachusetts, USA) program (Schaefer et al., Citation2017). The cut-off frequency of 50 Hz was determined by a fast Fourier transformation. Following this, the discrete kinetic variables were measured from FFC to ball release, and included the following:
Peak vertical—maximum force measured in the vertical direction.
Peak braking—maximum force measured in the posterior direction.
Vertical impulse—calculated as the area under the vertical force time curve.
Braking impulse—calculated as the area under the braking/propulsive force time curve.
The force platform software (Bioware 5.3.0.7, Winterthur, Switzerland) was used for analysis of discrete scalar variables for each delivery bowled. All kinetic variables were normalised to BW. The continuous, filtered, force-time curve of the entire FFC in both the vertical and braking/propulsive planes was further assessed as a vector, described in the SPM analysis section with time-series data normalised to 100% of FFC stance phase. All BRS and GRF variables were pooled and analysed irrespective of delivery length as previous research has indicated that changes in delivery length do not significantly affect BRS or FFC GRF (Callaghan et al., Citation2019; S.J. Callaghan et al., Citation2020).
Training program
The off-season strength training programme required two supervised 1-hour sessions per week, on non-consecutive days, for 8 weeks. Due to the off-season phase of competition, participants were not undertaking pace bowling training during the intervention. Although the inclusion of a control, non-training group would have been beneficial, this was not feasible due to the high-level participants and specialised sub-discipline of cricket players (i.e., pace bowlers) recruited for this study. An 8-week training programme has been previously shown to be a sufficient time period to induce changes in lower-limb strength (McBride et al., Citation2002; Wirth et al., Citation2016) and eccentric capacity (Hewett et al., Citation1996) and has also been used when attempting to increase BRS among pace bowlers (Feros et al., Citation2020). All sessions were conducted in the gym of an Australian state cricket organisation and supervised by a certified strength and conditioning coach.
The programme featured exercises specifically recommended for developing upper- (e.g., bench press and prone row) and lower-body strength (e.g., back squat and deadlift) (Fisher et al., Citation2013; Nimphius et al., Citation2012), and eccentric capacity (e.g., double- and single-leg altitude landings and squat jumps) (Herman et al., Citation2009; Hewett et al., Citation1996; Joyce & Lewindon, Citation2014). Furthermore, all exercises were based upon previous research (Fisher et al., Citation2013; Joyce & Lewindon, Citation2014; McBride et al., Citation2002; Nimphius et al., Citation2012) and current strength and conditioning coach practices at the professional level (Weldon et al., Citation2020) (see Appendix A, which outlines the specific training programme undertaken by participants). The training programme was periodised by adjusting the technical complexity and intensity of the exercises from week-to-week (Buford et al., Citation2007; Haff & Nimphius, Citation2012). The weight to be lifted in each exercise for each participant was calculated from their estimated one-repetition maximum for the exercise as determined by the participant’s previous experiences, and adjusted where necessary. Participants were instructed to complete the concentric phase of each exercise as fast as possible for every repetition. Structured warm-up sets within each training session were undertaken by each participant following the general warm-up to reduce the risk of injury.
Statistical analyses
Descriptive statistics (mean ± standard deviation) were used to describe each variable. Mean difference and 95% confidence limits (CL) were also determined between pre- and post-test measures. Normality of data was assessed by visual analysis of the Q–Q plot (Callaghan et al., Citation2018). To assess the reliability of all discrete pre- and post-testing variables, intraclass correlation coefficient (ICC) and coefficient of variance (CV) were determined. An ICC ≥ 0.70 and a CV ≤ 10% was deemed acceptable (Callaghan et al., Citation2018). Paired samples two-tailed t tests determined significant changes between pre- and post-testing measures. Due to this statistical approach and to decrease the chances of making a Type 1 error, the criterion for significance was set at p ≤ 0.01 (Feise, Citation2002). These statistics were computed using the Statistics Package for Social Sciences Version 23.0 (IBM, Armonk, United States of America). Due to the small sample size, Hedges’ g effect sizes were used for the pre- and post-testing comparisons. The effect magnitude was assessed on the following scale: less than 0.2 was considered a trivial effect; 0.2 to 0.49 a small effect; 0.5 to 0.79 a medium effect; and greater than 0.8 a large effect (Cohen, Citation1992; Middleton et al., Citation2016). These statistics were computed within a customised Excel (Microsoft Corporation, Washington, United States of America) spreadsheet.
SPM was used to evaluate if significant changes (α = 0.05) from pre- to post-training occurred over any section of the GRF curve during FFC. SPM specifically reduces two biases that occur with the more common ‘scalar extraction’ analysis: (1) reduces the bias of discrete extraction (e.g., analysis of only peak values) by examining the GRF with respect to the time domain (the entire curve) and (2) deals with the most commonly overlooked bias in scalar extraction-based analysis through assessing the GRF as a vector instead of reduction to scalar components which fails to consider the covariance between components, in this research, between vertical and braking/propulsive GRF (Pataky et al., Citation2013). The SPM analysis required four steps, and these are outlined in De Ridder et al. (Citation2013). Briefly, SPM uses random field theory to objectively identify field regions which co-vary significantly with the experimental design (Pataky et al., Citation2013). A paired Hotelling’s T2 test was used to test if a change occurred from pre- to post-testing in the two-component (vertical and braking/propulsive) GRF trajectory. For simplicity, a mean GRF trajectory for each participant was used for analysis for each variable. This approach is considered the equivalent of the full model involving intra-trial variability when the residuals are normally distributed (Friston et al., Citation2011; Pataky et al., Citation2013). Post hoc analysis of the individual vector components’ trajectories was not required as the Hotelling’s T2 did not reach significance. All SPM analyses were implemented in Python 2.7 using Enthought Canopy 1.5.2 (Enthought Inc., Austin, USA), using the open-source package ‘rft1d’ located at https://www.spm1d.org/ (Pataky, Citation2016).
Results
All investigated pre- and post-testing variables were deemed to be normally distributed as determined by the Q–Q plot analysis. There was no significant change in body mass from pre- (82.7 ± 7.7 kg) to post-testing (83.2 ± 7.8 kg; p = 0.44; g = 0.06). All ICCs (0.70–0.98) and CVs (0.63–9.31%) for pre- and post-testing discrete measures were deemed acceptable. displays the BW normalised changes between pre- and post-testing for double- and single-leg drop landing, CMJ and IMTP. A significant 19% decrease in double-leg drop landing peak vertical force was demonstrated following the training intervention. Front-foot and back-foot single-leg drop landing peak vertical forces significantly decreased between pre- and post-testing by 14% and 15%, respectively. IMTP peak force significantly increased by 9%. No significant changes in CMJ variables were found between pre- and post-testing.
Table 1. The relative pre- and post-testing (mean ± standard deviation) and difference (mean difference ± 95% confidence limits [CL]) results for double-leg drop landing (DLDL), single-leg drop landing (SLDL), countermovement jump (CMJ) and isometric mid-thigh pull (IMTP), in cricket pace bowlers (n = 10).
There was no significant change (p = 0.11; g= 0.17; mean difference ± 95% CL = −0.87 ± 1.09 m/s) in BRS between pre- (31.55 ± 1.44 m/s) and post-testing (31.79 ± 1.33 m/s) measures, with only a trivial effect present. There were no significant differences in any of the BW normalised discrete kinetic variables measured between pre- and post-testing (). depict the effects of the training intervention as assessed by SPM for changes in the vector field GRF. The critical threshold of T2 = 40.507 with a family-wise error rate of α = 0.05 was not exceeded (p= 1.0) therefore no post hoc scalar field SPM was performed.
Figure 1. Displays the Hotellings T2 trajectory SPM (T2). The T2 statistic as a function of time, describing the strength and slope of the relationship between pre- and post-testing measures. The dotted horizontal line indicates the critical random field theory thresholds for significance of T2 = 40.507 with a family wise error rate of α = 0.05. No portion of the trajectory exceeded the threshold therefore no follow-up tests were performed for scalar field analysis.
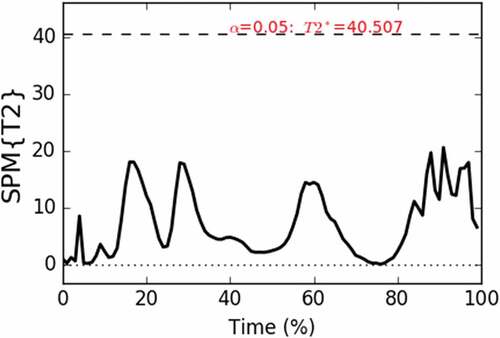
Figure 2. (a) The braking/propulsive GRF (GRFy;) and (b) vertical GRF (GRFz) pre- and post-training represented as the cross-participant mean trajectory with a standard deviation cloud. The pre-training is depicted with a black line and dark grey cloud while post-training is depicted using a dashed grey line with light grey cloud.
Table 2. Relative peak vertical force, braking force and vertical and braking impulse between pre- and post-testing (mean ± standard deviation) and difference (mean difference ± 95% confidence limits [CL]) during front foot contact in cricket pace bowlers (n = 10).
Discussion and implications
This is the first study to investigate the effects of an 8-week general strength training intervention, with a focus on lower-limb strength and eccentric capacity, on BRS among high-level cricket pace bowlers. The results reinforced that a periodised strength training intervention can improve measures of strength and eccentric capacity. However, this did not translate to significant changes in FFC GRF, which may explain the lack of improvement in BRS. Nonetheless, increase in strength and eccentric capacity have previously been shown to enhance other factors important to cricket. For example, acceleration performance (Lockie et al., Citation2012; Suchomel et al., Citation2016), maximal velocity sprinting (Rumpf et al., Citation2015), and change of direction ability (Spiteri et al., Citation2013), which are all critical components of fielding within cricket as well as reduced injury risk (Suchomel et al., Citation2016). Consequently, any improvements in lower-body strength for a pace bowler, which does not negatively influence pace bowling performance or technique, could be ultimately viewed as beneficial.
The BRS reported for participants in this study were similar to those of high-performance state association level pace bowlers previously reported within the literature (Middleton et al., Citation2016; Phillips et al., Citation2010). The results indicated that there was no significant difference in BRS between pre- and post-testing, despite significant improvements in lower-limb strength and eccentric capacity. This was counter to the study hypothesis; however, this finding is in accordance with previous research which investigated the implications of special resistance training interventions upon BRS among pace bowlers (Petersen et al., Citation2004; Wickington & Linthorne, Citation2017). Furthermore, the higher level of participants recruited for the current investigation may have limited the extent to which BRS could have been improved. Therefore, it may prove beneficial if future investigation looked to determine the effects of strength training upon BRS among amateur pace bowlers, where greater potential for improvement is present, to more globally determine the influence of strength training upon BRS. Nonetheless, smaller changes in BRS for higher level pace bowlers may prove to be more impactful to the applied setting. Hence, continued research in this area is warranted.
There are several reasons which may explain the lack of significant change in BRS following the training intervention. The transfer of training effect principle evaluates the time necessary or ‘lag time’ for motor learning strategies to manifest improvements in strength into performance (Stone et al., Citation2003; Suchomel et al., Citation2016). Morin, Capelo-Ramirez et al. (In Press) investigated the adaptation window following a high-resistance sprint training programme upon maximal horizontal power among trained sprinters. The results demonstrated a highly individual response, with most participants (7/22) recording peak power 4 weeks following the training intervention. Consequently, the 1-week period between the completion of the strength training intervention and post-testing may not have been sufficient time to actualise increases in strength into enhanced BRS. This possible limitation may have been compounded by the off-season phase of competition, as the participants were not undertaking pace bowling practice. Due to the complex sequencing of movements associated with pace bowling, a longer length of time may be required to allow athletes to learn how to utilise any enhanced capacities within this skilled movement. As such, pace bowling may also necessitate a combined approach of coaching and strength training to optimise performance. Clearly, there is a need for future research to assess the ability of a combined strength and movement pattern coaching intervention upon BRS among pace bowlers.
The results from this study also indicated no significant changes in GRF during FFC when assessing discrete and continuous measures. This may have contributed to the lack of change in BRS as previous research has established the importance of vertical and braking GRFs (Callaghan et al., Citation2021; Phillips et al., Citation2010; Portus et al., Citation2004) and braking impulse (King et al., Citation2016) to higher BRS. Perhaps, a more specific eccentric training modality which more closely replicates the high magnitude and rate of force developed experienced at FFC is required to elicit changes in a pace bowler’s FFC GRFs. Furthermore, recent research has also highlighted an individualised development of GRF during FFC for pace bowlers (Callaghan et al., Citation2021). The use of different movement strategies underpinned by the various physical strengths and weaknesses of a pace bowler may necessitate a more individualised training intervention to elicit alterations in FFC GRFs and ultimately BRS. However, additional research is needed to test these hypotheses.
It could be surmised that a pace bowler who possesses greater lower-limb strength may be better equipped to efficiently transfer the linear kinetic energy of their run-up into their bowling action, assuming a correct sequencing of movements (King et al., Citation2016; Mukandi et al., Citation2014; Stronach et al., Citation2014). The pre- and post-testing results demonstrated improvements in lower-limb strength and eccentric capacity as there was a significant improvement in the IMTP, double- and single-leg drop landing. The 9% increase in BW normalised peak vertical force for the IMTP helped validate that an appropriately designed training programme during the cricket off-season, where an absence of skills specific training occur, can provide enhanced foundational physiological capacities prior to a training emphasis that will shift to a skills focus during the season (Joyce & Lewindon, Citation2014). Furthermore, despite the lack of significant changes in BRS between pre- and post-testing measures, the aforementioned physiological adaptations may set the foundation for changes in GRF and subsequently BRS if performed in conjunction with bowling specific drills or if changes in BRS are examined for a lag effect (delayed transfer of training). Practically, the improvements in lower-limb strength and eccentric capacity could also suggest that the pace bowlers may be more physically capable of tolerating the high loads experienced at FFC during match-play and training (Callaghan et al., Citation2020). However, this perspective was not investigated within the current study.
The enhanced lower-limb eccentric capacity derived from the drop landings could have some impact on pace bowling biomechanics, despite no change in BRS. Improved drop landing performance could be indicative of an improved anticipatory pre-activation of lower-limb musculature, which is representative of enhanced neuromuscular control and may prevent joint collapse immediately after ground contact (Horita et al., Citation2002). This is particularly important to pace bowlers as not only are they required to efficiently absorb and utilise the high GRFs experienced at FFC but also it has previously been shown that a more extended front knee at FFC is associated with an increased BRS (Portus et al., Citation2004; Worthington et al., Citation2013). Consequently, improvements in lower-limb eccentric capacity may assist pace bowlers in adopting techniques associated with an increased BRS. However, future research is needed to assess this perspective as kinematic variables were beyond the scope of the current investigation. Practically, the improved lower-limb eccentric capacity may also indicate that despite the well-established high braking and vertical GRFs at FFC (King et al., Citation2016; Middleton et al., Citation2016; Portus et al., Citation2004), and the repetitive nature of pace bowling during match-play and training, this is an area that can still be improved via appropriate conditioning. This was pertinent as these changes occurred during the off-season period for the bowlers in this study, which is where certain physiological characteristics can be targeted with specific training.
There was no significant improvement in CMJ normalised peak power. The lack of improvement in CMJ performance may in part be attributed to the lower-limb strength and eccentric capacity focus of the training intervention, and the limited number of specific power- and jumping-based exercises implemented within the programme (see Appendix A, which outlines the specific training programme undertaken by participants). Lockie et al. (Citation2012) also found no significant improvement in lower-limb vertical power as measured by CMJ height following a 6-week strength training intervention in field sport athletes. Due to the skill requirements of the CMJ, perhaps specific jump or plyometric training is necessary to improve CMJ peak power among cricket pace bowlers, although future research is needed to assess this perspective.
There are certain limitations for this study. No kinematic data were collected and therefore future research should assess whether a periodised strength training programme can elicit changes in a pace bowler’s kinematics or more specifically the use of joint kinematics in conjunction with GRF to calculate joint kinetics. Additionally, the participant numbers utilised in this study are low; however, they are similar to previous strength training studies in athletic populations (Nimphius et al., Citation2012; Petersen et al., Citation2004). As previously mentioned, the inclusion of a control group would have been advantageous and allowed further insights into the effects of the training intervention. However, as noted, high-level athletes are required to still be undertaking some form of resistance training during the off-season, making a non-training control group unfeasible. Furthermore, previous research has also not utilised a control group when undertaking a training intervention (Nimphius et al., Citation2012). Of most concern to many resistance training studies attempting to demonstrate the efficacy and transfer to a skilled performance, there may have been insufficient time to develop the necessary motor learning strategies to allow improvements in strength to manifest in performance (Stone et al., Citation2003; Suchomel et al., Citation2016). Consequently, additional research is required to determine if concurrent skills training could alleviate this limitation and encourage greater adaptations. As this would provide the opportunity for pace bowlers to actualise improvements in strength and eccentric capacity into their pace bowling technique.
Conclusion
The 8-week strength training intervention led to improvements in eccentric capacity (i.e., drop landings) and lower-body strength (i.e., IMTP) for pace bowlers. However, this did not translate to an increased BRS. Importantly, increases in lower-limb strength and eccentric capacity would be anticipated to enhance other areas of match-play (i.e., sprinting and changing direction). It is also pertinent that these changes occurred during the off-season phase of competition, illustrating that these foundational physiological requirements for match-play and training resilience of pace bowlers can be targeted and improved with specific training.
Acknowledgments
We would like to acknowledge our participants for their contribution, time, and effort to this study. Many thanks also to the Western Australian Cricket Association, with whom this research could not have been possible.
Disclosure statement
No potential conflict of interest was reported by the author(s).
References
- Bartlett, R. M., Stockill, N. P., Elliott, B. C., & Burnett, A. F. (1996). The biomechanics of fast bowling in men’s cricket: A review. Journal of Sports Sciences, 14(5), 403–424. https://doi.org/10.1080/02640419608727727
- Buford, T. W., Rossi, S. J., Smith, D. B., & Warren, A. J. (2007). A comparison of periodization models during nine weeks with equated volume and intensity for strength. Journal of Strength and Conditioning Research, 21(4), 1245–1250. https://doi.org/10.1519/R-20446.1
- Callaghan, S. J., Govus, A. D., Lockie, R. G., Middleton, K. J., & Nimphius, S. (2021). Not as simple as it seems: Front foot contact kinetics, muscle function and ball release speed in cricket pace bowlers. Journal of Sports Sciences. https://doi.org/10.1080/02640414.2021.1898192
- Callaghan, S. J., Lockie, R. G., Andrews, W. A., Chipchase, R. F., & Nimphius, S. (2018). The relationship between inertial measurement unit-derived ‘force signatures’ and ground reaction forces during cricket pace bowling. Sports Biomechanics, 19. https://doi.org/10.1080/14763141.2018.1465581
- Callaghan, S. J., Lockie, R. G., Andrews, W. A., Yu, W., Chipchase, R. F., & Nimphius, S. (2019). The effects of an eight over cricket bowling spell upon pace bowling biomechanics and performance within different delivery lengths. Sports, 7(200). https://doi.org/10.3390/sports7090200
- Callaghan, S. J., Lockie, R. G., Yu, W., Andrews, W. A., Chipchase, R. F., & Nimphius, S. (2020). Does delivery length impact measures of whole-body biomechanical load during pace bowling? International Journal of Sport Physiology and Performance, 15(10), 1485–1489. https://doi.org/10.1123/ijspp.2019-0622
- Cohen, J. (1992). Psychological Bulletin. 112(1), 155–159. https://doi.org/10.1037//0033-2909.112.1.155
- Comfort, P., Jones, P. A., McMahon, J. J., & Newton, R. (2015). Effect of knee and trunk angle on kinetic variables during the isometric midthigh pull: Test-retest reliabilty. International Journal of Sports Physiology & Performance, 10(1), 58–63. https://doi.org/10.1123/ijspp.2014-0077
- De Ridder, R., Willems, T., Vanrenterghem, J., Robinson, M., Pataky, T., & Roosen, P. (2013). Gait kinematics of subjects with ankle instability using a multisegmented foot model. Medicine and Science in Sports and Exercise, 45(11), 2129–2136. https://doi.org/10.1249/MSS.0b013e31829991a2
- Decker, M. J., Torry, M. R., Wyland, D. J., Sterett, W. I., & Steadman, J. R. (2003). Gender differences in lower extremity kinematics, kinetics and energy absorption during landing. Clinical Biomechanics, 18(7), 662–669. https://doi.org/10.1016/S0268-0033(03)00090-1
- Elliott, B. (2000). Back injuries and the fast bowler in cricket. Journal of Sports Sciences, 18(12), 983–991. https://doi.org/10.1080/026404100446784
- Elliott, B., & Khangure, M. (2002). Disk degeneration and fast bowling in cricket: An intervention study. Medicine & Science in Sports & Exercise, 34(11), 1714–1718. https://doi.org/10.1097/00005768-200211000-00004
- Feise, R. J. (2002). Do multiple outcome measures require p-value adjustment? BMC Medical Research Methodology, 2(1), 8–8. https://doi.org/10.1186/1471-2288-2-8
- Feros, S. A., Young, W. B., & O’Brien, B. J. (2020). Efficacy of combined general, special, and specific resistance training on pace bowling in club-standard crickters. Journal of Strength & Conditioning Research, 34(9), 2596–2607. https://doi.org/10.1519/JSC.0000000000002940
- Feros, S. A., Young, W. B., & O’Brien, B. J. (In Press). Relationship between selected physical qualities, bowling kinematics and pace bowling skill in club-standard cricketers. Journal of Strength and Conditioning Research, 33(10), 2812–2825. https://doi.org/10.1519/JSC.0000000000002587
- Fisher, J., Steele, J., & Smith, D. (2013). Evidence-based resistance training recommendations for muscular hypertrophy. Medicina Sportiva, 17(4), 217–235. https://doi.org/10.2478/v10036-011-0025-x
- Friston, K. J., Ashburner, J. T., Kiebel, S. J., Nichols, T. E., & Penny, W. D. (2011). Statistical parametric mapping: The analysis of functional brain images. Elsevier/Academic Press.
- Glazier, P. S., Paradisis, G. P., & Cooper, S.-M. (2000). Anthropometric and kinematic influences on release speed in men’s fast-medium bowling. Journal of Sports Sciences, 18(12), 1013–1021. https://doi.org/10.1080/026404100446810
- Haff, G. G., & Nimphius, S. (2012). Training principles for power. Strength & Conditioning Journal, 34(6), 2–12. https://doi.org/10.1519/SSC.0b013e31826db467
- Hargrave, M. D., Carcia, C. R., Gansneder, B. M., & Shultz, S. J. (2003). Subtalar pronation does not influence impact forces or rate of loading during a single-leg landing. Journal of Athletic Training, 38(1), 18–23.
- Herman, D. C., Oñate, J. A., Weinhold, P. S., Guskiewicz, K. M., Garrett, W. E., Bing, Y., & Padua, D. A. (2009). The effects of feedback with and without strength training on lower extremity biomechanics. American Journal of Sports Medicine, 37(7), 1301–1308. https://doi.org/10.1177/0363546509332253
- Hermassi, S., Chelly, M. S., Tabka, Z., Shephard, R. J., & Chamari, K. (2011). Effects of 8-week in-season upper and lower limb heavy resistance training on the peak power, throwing velocity, and sprint performance of elite male handball players. Journal of Strength and Conditioning Research, 25(9), 2424–2433. https://doi.org/10.1519/JSC.0b013e3182030edb
- Hewett, T. E., Stroupe, A. L., Nance, T. A., & Noyes, F. R. (1996). Plyometric training in female athletes. Decreased impact forces and increased hamstring torques. American Journal of Sports Medicine, 24(6), 765–773. https://doi.org/10.1177/036354659602400611
- Horita, T., Komi, P., Nicol, C., & Kyrolainen, H. (2002). Interaction between pre-landing activities and stiffness regulation of the knee joint musculoskeletal system in the drop jump: Implications to performance. European Journal of Applied Physiology, 88(1/2), 76–84. https://doi.org/10.1007/s00421-002-0673-6
- Hurrion, P. D., Dyson, R., & Hale, T. (2000). Simultaneous measurement of back and front foot ground reaction forces during the same delivery stride of the fast-medium bowler. Journal of Sports Sciences, 18(12), 993–997. https://doi.org/10.1080/026404100446793
- Joyce, D., & Lewindon, D. (2014). High-performance training for sports. Human Kinetics.
- King, M. A., Worthington, P. J., & Ranson, C. A. (2016). Does maximising ball speed in cricket fast bowling necessitate higher ground reaction forces? Journal of Sports Sciences, 34(8), 707–712. https://doi.org/10.1080/02640414.2015.1069375
- Lockie, R. G., Murphy, A. J., Schultz, A. B., Knight, T. J., & Janse De Jonge, X. A. K. (2012). The effects of different speed training protocols on sprint acceleration kinematics and muscle strength and power in field sport athletes. The Journal of Strength & Conditioning Research, 26(6), 1539–1550. https://doi.org/10.1519/JSC.0b013e318234e8a0
- McBride, J. M., Triplett-McBride, T., Davie, A., & Newton, R. U. (2002). The effect of heavy- Vs. light-load jump squats on the development of strength, power, and speed. Journal of Strength & Conditioning Research, 16(1), 75–82.
- McCurdy, K. W., Langford, G. A., Doscher, M. W., Wiley, L. P., & Mallard, K. G. (2005). The effects of short-term unilateral and bilateral lower-body resistance training on measures of strength and power. Journal of Strength and Conditioning Research, 19(1), 9–15. https://doi.org/10.1519/14173.1
- Middleton, K. J., Mills, P. M., Elliott, B. C., & Alderson, J. A. (2016). The association between lower limb biomechanics and ball release speed in cricket fast bowlers: A comparison of high-performance and amateur competitors. Sports Biomechanics, 15(3), 357–369. https://doi.org/10.1080/14763141.2016.1163413
- Morin, J. B., Capelo-Ramirezc, F., Rodriguez-Perezc, M., Cross, M., & Jimenez-Reyes, P. (In Press). Individual adaptation kinetics following heavy resisted sprint training. Journal of Strength and Conditioning Research. Published Ahead of Print. https://doi.org/10.1519/JSC.0000000000003546
- Mukandi, I., Turner, A., Scott, P., & Johnstone, J. A. (2014). Strength and Conditioning for Cricket Fast Bowlers. Strength & Conditioning Journal, 36(6), 96–106. https://doi.org/10.1519/SSC.0000000000000099
- Nedergaard, N. J., Robinson, M. A., Eusterwiemann, E., Drust, B., Lisboa, P. J., & Vanrenterghem, J. (2017). The relationship between whole-body external loading and body-worn accelerometry during team-sport movements. International Journal of Sports Physiology and Performance, 12(1), 18–26. https://doi.org/10.1123/ijspp.2015-0712
- Nimphius, S., McGuigan, M. R., & Newton, R. U. (2012). Changes in muscle architecture and performance during a competitive season in female softball players. Journal of Strength & Conditioning Research, 26(10), 2655–2666. https://doi.org/10.1519/JSC.0b013e318269f81e
- Pataky, T. (2016). rft1d: Smooth one-dimensional random field upcrossing probabilities in Python. Journal of Statistical Software, 71(1), 1–24. https://doi.org/10.18637/jss.v071.i07
- Pataky, T., Robinson, M., & Vanrenterghem, J. (2013). Vector field statistical analysis of kinematic and force trajectories. Journal of Biomechanics, 46(14), 2394–2401. https://doi.org/10.1016/j.jbiomech.2013.07.031
- Petersen, C., Wilson, B., & Hopkins, W. (2004). Effects of modified-implement training on fast bowling in cricket. Journal of Sports Sciences, 22(11), 1035–1039. https://doi.org/10.1080/02640410410001729973
- Phillips, E., Portus, M., Davids, K. W., Brown, N., & Renshaw, I. (2010). How do our ‘quicks’ generate pace? A cross sectional analysis of the Cricket Australia pace pathway. Paper presented at the Proceedings of the 2010 Conference of Science, Medicine and Coaching in Cricket. Brisbane, Queensland, Australia.
- Portus, M. R., Mason, B. R., Elliott, B. C., Pfitzner, M. C., & Done, R. P. (2004). Technique factors related to ball release speed and trunk injuries in high performance cricket fast bowlers. Sports Biomechanics, 3(2), 263–283. https://doi.org/10.1080/14763140408522845
- Portus, M. R., Sinclair, P. J., Burke, S. T., Moore, D. J. A., & Farhart, P. J. (2000). Cricket fast bowling performance and technique and the influence of selected physical factors during an 8-over spell. Journal of Sports Sciences, 18(12), 999–1011. https://doi.org/10.1080/026404100446801
- Ranson, C. A., King, M. A., Burnett, A. F., Worthington, P. J., & Shine, K. (2009). The effect of coaching intervention on elite fast bowling technique over a two year period. Sports Biomechanics, 8(4), 261–274. https://doi.org/10.1080/14763140903469908
- Rumpf, M. C., Cronin, J. B., Mohamad, I. N., Mohamad, S., Oliver, J. L., & Hughes, M. G. (2015). The effect of resisted sprint training on maximum sprint kinetics and kinematics in youth. European Journal of Sport Science, 15(5), 374–381. https://doi.org/10.1080/17461391.2014.955125
- Schaefer, A., O’Dwyer, N., Ferdinands, R., & Edwards, S. (2017). Consistency of kinematic and kinetic patterns during a prolonged spell of cricket fast bowling: An exploratory laboratory study. Journal of Sports Sciences, 36. https://doi.org/10.1080/02640414.2017.1330548
- Secomb, J. L., Nimphius, S., Farley, O. R. L., Lundgren, L. E., Tran, T. T., & Sheppard, J. M. (2015). Relationships between lower-body muscle structure and, lower-body strength, explosiveness and eccentric leg stiffness in adolescent athletes. Journal of Sports Science and Medicine, 14(4), 691–697.
- Sheppard, J. M., Nimphius, S., Haff, G. G., Tran, T. T., Spiteri, T., Brooks, H., Slater, G., & Newton, R. U. (2013). Development of a comprehensive performance-testing protocol for competitive surfers. International Journal of Sports Physiology and Performance, 8(5), 490–495. https://doi.org/10.1123/ijspp.8.5.490
- Spiteri, T., Cochrane, J. L., Hart, N. H., Haff, G. G., & Nimphius, S. (2013). Effect of strength on plant foot kinetics and kinematics during a change of direction task. European Journal of Sport Science, 13(6), 646–652. https://doi.org/10.1080/17461391.2013.774053
- Stone, M. H., O’Bryant, H. S., McCoy, L., Coglianese, R., Lehmkuhl, M., & Schilling, B. (2003). Power and maximum strength relationships during performance of dynamic and static weighted jumps. Journal of Strength & Conditioning Research, 17(1), 140–147. https://doi.org/10.1519/1533-4287(2003)017<0140:pamsrd>2.0.co;2
- Stronach, B., Cronin, J. B., & Portus, M. (2014). Part 2: Mechanical and anthropometric factors of fast bowling for cricket, and implications for strength and conditioning. Strength & Conditioning Journal, 36(5), 53–60. https://doi.org/10.1519/SSC.0000000000000095
- Suchomel, T., Nimphius, S., & Stone, M. (2016). The importance of muscular strength in Athletic performance. Sports Medicine, 46(10), 1419–1449. https://doi.org/10.1007/s40279-016-0486-0
- Tran, T. T., Lundgren, L., Secomb, J. L., Farley, O. R. L., Haff, G. G., Newton, R., Nimphius, S., & Sheppard, J. M. (2015). Development and evaluation of a drop-and-stick method to assess landing skills in various levels of competitive surfers. International Journal of Sports Physiology and Performance, 10(3), 396–400. https://doi.org/10.1123/ijspp.2014-0375
- Weldon, A., Duncan, M. J., Turner, A., Christie, C. J., & Pang, C. M. C. (2020). Contemporary practices of strength and conditioning coaches in professional cricket. International Journal of Sports Science & Coaching. https://doi.org/10.1177/1747954120977472
- Wickington, K. L., & Linthorne, N. P. (2017). Effect of ball weight on speed, accuracy, and mechanics in cricket fast bowling. Sport, 5(18). https://doi.org/10.3390/sports5010018
- Wirth, K., Keiner, M., Hartmann, H., Sander, A., & Mickel, C. (2016). Effect of 8 weeks of free-weight and machine-based strength training on strength and power performance. Journal of Human Kinetics, 53(1), 201–210. https://doi.org/10.1515/hukin-2016-0023
- Worthington, P. J., King, M. A., & Ranson, C. A. (2013). Relationship between fast bowling technique and ball release speed in cricket. Journal of Applied Biomechanics, 29(1), 78–84. https://doi.org/10.1123/jab.29.1.78