
 ?Mathematical formulae have been encoded as MathML and are displayed in this HTML version using MathJax in order to improve their display. Uncheck the box to turn MathJax off. This feature requires Javascript. Click on a formula to zoom.
ABSTRACT
This study investigated the association among isometric upper-limb strength of handcyclists and sport-specific performance outcomes. At two international events, 62 athletes were tested on upper-limb strength, measured with an isometric-strength setup and with Manual Muscle Test (MMT). Horizontal force (Fz), effectiveness, rate of development, variability, and asymmetries were calculated for upper-limb pull and push. Performance measures were mean (POmean) and peak (POpeak) 20-s sprint power output and average time-trial velocity (TTvelocity). Regression models were conducted to investigate which pull and push strength variables associated strongest with performance measures. Additional regression analyses were conducted with an MMT sum score as predictor. Push and pull Fz showed the strongest associations with all outcomes. Combined push and pull Fz explained (p < .001) 80–81% of variance of POmean and POpeak. For TTvelocity, only push Fz was included in the model explaining 29% of the variance (p < .001). MMT models revealed weaker associations with sprint PO (R2 = .38–.40, p < .001) and TTvelocity (R2 = .18, p = 0.001). The findings confirmed the relevance of upper-limb strength on handcycling performance and the significance of ratio-scaled strength measures. Isometric strength outcomes are adequate sport-specific indicators of impairment in handcycling classification, but future research should corroborate this notion and its potential to discriminate between sports classes.
Introduction
The Summer Paralympic Games are a worldwide known competition for 22 different sports, including para-cycling. All these sports have to comply with the International Paralympic Committee (IPC) Athlete Classification Code, which states that each sport must be based on an evidence-based classification system. According to the IPC guidelines, the classification system must group athletes based on how much the impairment influences the sport performance, aiming to minimise the impact of impairment during competition (International Paralympic Committee, Citation2015; Tweedy & Vanlandewijck, Citation2011). Among the eligible physical impairment types, Paralympic handcycling athletes must have been diagnosed with impaired muscle power, impaired passive range of movement, limb deficiency, leg length difference, or a neurological impairment (International Paralympic Committee, Citation2015).
In Paralympic handcycling, the Union Cycliste Internationale (UCI) is responsible for the implementation of the IPC classification guidelines and the validity of the classification system. The handcycling classification system is hierarchically structured in five sports classes (H1-H5), with different degrees of activity limitation varying from H5 – athletes with the least activity limitations, e.g., lower-limb strength impairment; to H1 – athletes with the greatest activity limitations, e.g., trunk, and upper- and lower-limb strength impairment. While class H5 competes in a kneeling position using an arm-trunk-powered handbike, all classes from H1 to H4 compete in a recumbent position using an arm-powered handbike (Union Cycliste Internationale, Citation2021).
From a general biomechanical perspective, recumbent handcycling performance is all about power production using a synchronous crankset and power losses to overcome drag. It is based on consecutively alternated lift-up, push, press-down, and pull phases during a full circular cycle (Kraaijenbrink et al., Citation2020, Citation2021). The push phase is mainly characterised by elbow extension and shoulder anteflexion, while the pull phase requires elbow flexion and shoulder retroflexion (Kraaijenbrink et al., Citation2020; Quittmann et al., Citation2018; Verellen et al., Citation2012). The literature suggests that handcycling force generation strongly depends on the functional capacity around the shoulder joint, elbow, wrist, and fingers (Kraaijenbrink et al., Citation2021; Verellen et al., Citation2012). Recent electromyography studies on able-bodied individuals have verified some of the major contributors to the handcycling propulsion, like m. triceps brachii, m. deltoideus pars clavicularis, and m. pectoralis major during the push phase, and the m. biceps brachii, m. trapezius, m. latissimus dorsi, m. deltoideus pars posterior during the pull phase (Litzenberger et al., Citation2015; Quittmann et al., Citation2020, Citation2021). Nevin and Smith found a strong association between bench press and prone bench pull strength and average time-trial velocity (TTvelocity) (Nevin & Smith, Citation2021). Recumbent handcycling athletes with no upper-limb impairments have shown a larger contribution of the pull strength compared to the push strength (Nevin & Smith, Citation2021). The stronger pull contribution was supported by Quittmann et al. and Stone et al., especially during high workload intensities (Quittmann et al., Citation2018; Stone et al., Citation2019). However, it has been suggested that the contribution of upper-limb push and pull in handcycling is dependent on the handbike setup, since closer crank positions relative to the athlete seem to even the workload distribution between the two phases (Vegter et al., Citation2019). In addition, Mason et al. found greater torque production during the push phase in trained handcycling athletes without upper-limb impairments (Mason et al., Citation2021), in contrast with the previous studies (Nevin & Smith, Citation2021; Stone et al., Citation2019).
Based on this previous literature, it is expected that differences in upper-limb muscle strength will lead to differences in handcycling performance. For example, an athlete with an impaired m. triceps brachii, as a consequence of a cervical spinal cord injury (SCI) above C6, is expected to propel the handbike predominantly during the pull phase, while an athlete with a thoracic or lumbar SCI and no impaired upper-limb function can also increase the magnitude of the force and power generated during the push phase (Verellen et al., Citation2012). In addition to force magnitude, force effectiveness (the ratio between effective or tangential force and the total force vector) (Veeger et al., Citation1992), force variability, upper-limb force asymmetries, and rate of force development may as well be affected by the functional capacity of the upper body. For example, limitations in upper-limb muscles or joints will impact the athlete’s power and capacity to effectively push/pull the cranks in the right direction, possibly reducing force effectiveness and the athlete’s performance (Verellen et al., Citation2012). Furthermore, neuromuscular timing-related variables, such as rate of force development, force control variables, such as force variability, are known to be associated with motor performance (Beckman et al., Citation2016; Tong et al., Citation2009). The reduced capacity to produce and control force in a specific direction and at a given speed is not only observed in individuals with muscle power impairments but also in individuals with neurological impairments (Tong et al., Citation2009; Verellen et al., Citation2012). These characteristics impact the overall power production and speed in handcycling performance.
The focus of the present study is on upper-limb muscle strength which is a main reference in the current handcycling classification system. In para-cycling, comparable to other Paralympic sports, muscle strength is essentially assessed with the Manual Muscle Test (MMT), a clinical strength assessment test based on a 5-point ordinal scale of joint muscle strength (Hislop & Montgomery, Citation2007; Union Cycliste Internationale, Citation2021). Although the MMT is time and cost efficient and, therefore, a practical method of strength assessment, it is an ordinally scaled measure, highly dependent on the experience of the examiner, which leads to low inter-rater reliability, especially among the lowest scores (Beckman et al., Citation2014, Citation2016). This is particularly important since, according to the IPC recommendations (Tweedy & Vanlandewijck, Citation2011), the evidence-based classification system should be objective, reliable, and preferably ratio-scaled. To overcome the weaknesses of using a manual expert-based strength assessment, previous studies in para-athletics have proposed the use of instrument-based isometric strength tests for the development of evidence-based classification systems (Beckman et al., Citation2014, Citation2016). An isometric strength assessment increases reliability, allows a high degree of standardisation in measurement and quantification of the magnitude of force application, and is expected to be less susceptible to training effects (Beckman et al., Citation2014). To the best of our knowledge, the direct association between upper-limb isometric strength, measured in an isometric instrumented ‘handcycle-based’ setup, and handcycling performance in elite athletes has not yet been investigated.
Therefore, the primary aim of this study was to investigate the association between isometric upper-limb strength, measured during 3D-instrumented and standardised ‘handcycle-based’ push and pull tests, and the respective performance outcomes: a standardised 20-s isokinetic all-out handcycling performance test and the average time-trial velocity of elite athletes during UCI time trials. We hypothesised that athletes with a less impaired upper-limb function (expressed as the maximal force produced, the ability to produce force in the required direction, the force variability, upper-limb asymmetries, and the slope of force-time development) performed significantly better in a handcycling 20-s sprint test and in a time-trial race. The secondary aim was to compare the associations between handcycling performance with isometric upper-limb strength and with MMT. We hypothesised that the ratio-scale isometric strength measurement shows stronger associations with performance.
Methods
Participants
Sixty-two international handcycling athletes were recruited at the 2019 Para-cycling Road World Cup (Ostend, Belgium) and at the 2019 Para-cycling Road World Championships (Emmen, the Netherlands) to participate in this study. Participants had to meet the following inclusion criteria: a) internationally classified in one of the existing handcycling sports classes; b) registered in the time-trial competition of the respective event; c) aged 18 years or older. In addition, exclusion criteria comprised: a) presenting a health condition or active medical treatment that could influence the testing outcomes or the participant’s health during measurements; b) not being able to fully understand the aim and the procedures. This study was approved by the Scientific and Ethical Review Board of the Faculty of Behavioural and Human Movements Sciences, of the Vrije Universiteit Amsterdam (VUA) (number VCWE-2019-052) and all athletes provided written informed consent prior to voluntary participation.
Experimental protocol
Data collection took place in a controlled field-lab setting and comprised a series of three different standardised measurements: (1), an objective ratio-scale strength assessment in an instrumented ‘handcycle-based’ isometric testing device; (2), a clinical method of strength assessment (MMT); and (3), a handcycling isokinetic sprint test. In addition, participants had performed in a time-trial event in the week of testing, providing their individual average time-trial velocity. Prior to testing, participants were interviewed regarding health and sport characteristics in addition to demographic information.
Isometric ‘handcycle-based’ ratio-scale 3D instrumented strength assessment
The upper-limb strength was assessed using a customised ‘handcycle-based’ device custom-made in collaboration with the technical department of the Department of Human Movement Sciences, VUA. The setup simulated a recumbent handcycling position, with a backrest, leg support, and a rigid beam with two 3D force-instrumented handlebars (). The handlebars were tilted inwards to an angle of 30° with the vertical axis and a width and diameter of .47 m and .04 m, respectively. Each handlebar was equipped with a 3D force sensor (MC3A–100, AMTI, Watertown, U.S.A.). The device allowed individual adjustments on the angle and height of the backrest, height of the handlebars frame, horizontal position of the seat with respect to the rigid beam, and lower-limb support.
Figure 1. Isometric force setup. Lateral view (left) and frontal view (right).
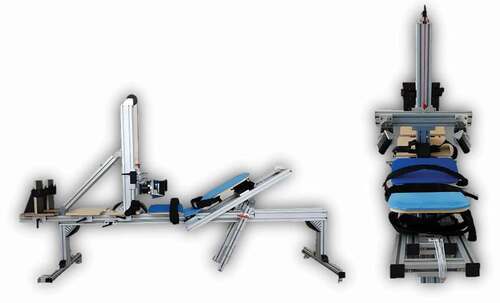
Procedure. During the test, the participants were lying down in a recumbent position, with the backrest set at 30° with the horizontal axis and a neck support provided so the participants could rest their head between trials. The legs were placed in knee extension on top of wooden plates, positioned under the thighs, calves, and heels. Two independent footrests were adjusted to the participant’s leg length and attached using a Velcro strap, providing horizontal and vertical support. Additional straps were used at the thigh, pelvis and chest level, and for participants with hand impairment, gripping aid gloves (General Purpose Gripping Aid, The Active Hands Company Limited, Solihull, England) were used and attached to the handlebar.
The test consisted of standardised isometric push and pull strength measurements. Prior to the measurements, a 30-s calibration trial was conducted. Subsequently, the first trial was considered a familiarisation trial, followed by two maximal voluntary contractions (MVC) for arm push and two MVC for arm pull. Each isometric test comprised a 2- to 3-s build-up submaximal contraction followed by a 3-s MVC. A computer-based data acquisition control system (SCXI 1000, National Instruments, Texas, U.S.A) collected force data signals at 200 Hz in three dimensions (horizontal (Z) – forward/backward (); transversal (×) – inward/outward; vertical (Y) – upward/downward).
Figure 2. Examples of the upper-limb pull (left) and push tests (right).
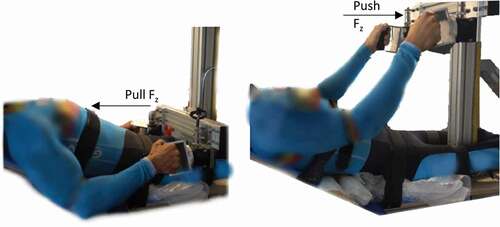
Resembling the pull and push vertical positions on a handbike, strength tests were conducted at different heights. To assess pull strength, the handlebars were placed at a height of .13 m from the seat (i.e., the lowest position possible without causing harm to the participant), and the seat was moved towards the rigid beam to the closest position possible, aiming to mimic handcycling-related elbow angles. A demonstration was provided and the participant was instructed to pull backwards with both arms simultaneously. To assess push strength, a similar procedure was conducted with the exception of the handlebars being placed at a height of .52 m from the seat, and the participant being instructed to push forward with both arms. Order of push and pull conditions were randomised among participants. The arm length and the elbow angle were measured for sample description.
Manual muscle test
A Manual Muscle Test (MMT) was performed by a medical professional and handcycling classifier. According to Daniels and Worthingham techniques (Hislop & Montgomery, Citation2007), the clinical assessment of muscle strength is based on a break test, where the examiner applies manual resistance to the body structure tested. It comprises a grading scale from 0, no muscle activity, to 5, good muscle response. The technique assesses a joint motion rather than an isolated individual muscle, hence, upper-limb muscle strength was assessed on elbow flexion (Biceps brachii, Brachialis, Brachioradialis), elbow extension (Triceps brachii), wrist flexion (Flexor carpi radialis, Flexor carpi ulnaris), and hand function (fingers flexion).
The athlete sat on an examination bench and the examiner stood in front of the athlete to conduct the manual assessment. If the athlete was unable to maintain the position against the examiner’s resistance, the test difficulty decreased stepwise until palpable contractile muscle activity without movement. To assess hand function, a simplified version (impaired/non-impaired) was used and consisted of a combined fingers flexion.
Handcycling sprint test and time-trial velocity
The field-lab performance test consisted of a 20-s isokinetic handcycling sprint in the participant’s own handbike attached to a cycle ergometer (Cyclus 2, RBM Electronics, Leipzig, Germany). The test started with a 5-min warm up at a self-selected power output, followed by a 2-min rest. Adapted from Zeller et al., (Citation2017) the 20-s isokinetic sprint test started with an initial load of 20N, at the highest gear ratio. For participants in a kneeling handbike, maximal cadence was set at 110 rpm, and for participants in a recumbent handbike, a maximal cadence of 130 rpm (athletes without upper-limb impairments) or 100 rpm (athletes with upper-limb impairments) was used. The peak power output (POpeak (W)) and mean power output (POmean (W)) were defined as outcome measures of handcycling performance.
In addition, official time-trial results of the respective event were collected from the UCI’s website (Union Cycliste Internationale, Citation2020) and used as a measure of handcycling performance in a field setting. Time-trial events are performed outdoors, with the circuit’s climbing length no more than 25% of the total length and a maximum inclination of 15% in the steepest section (Union Cycliste Internationale, Citation2021). Athletes start individually with a time interval in between. The order of participation in the UCI’s time trials is established based on the athlete’s sports class and performance ranking, aiming to minimise the possibility of athletes overtaking opponents during the competition. Drafting is not allowed (Union Cycliste Internationale, Citation2021). The distances raced during the time trials were as follows: at Ostend, 18 km for H5-H1 men, 18 km for H5-H2 women, 9 km for H1 women; at Emmen, 20.8 km for H5-H2 men, 10.4 km for H1 men, 20.8k for H5-H3 women, 10.4 km for H2 (H1 women did not compete).
Data analysis
Isometric ‘handcycle-based’ ratio-scale strength assessment
Data were processed using Matlab Software (Version R 2019b, Mathworks, Natick, Massachusetts, U.S.A.) and filtered with a 4th-order Butterworth prior to calculation of the outcome variables. For each trial, a moving average function was used to obtain the 2-s with the maximal average force in the Z direction (Fz) from the dominant upper-limb (dominant (Dom) and non-dominant (NDom) upper limbs were indicated by the athlete). This 2-s period determined the sample for the calculations of the remaining variables. In addition to Fz, the following variables were calculated for each arm (): total force (Ftot), effective force (Feff, here defined as the percentage of the total force that was produced in the horizontal direction), and respective coefficients of variation (varFz, varFtot, varFeff). In addition, it was calculated the slope (FSlope) of the force-time relationship from the beginning of MVC measurement, i.e., after submaximal contraction, to Fz peak ( left). Asymmetry variables were calculated using all seven bilateral variables (AsymFz, AsymvarFz, AsymFtot, AsymvarFtot, AsymFeff, AsymvarFeff, AsymFSlope) ().
Figure 3. Examples of an expected plotting pattern (left) and an unexpected plotting pattern (right). on the left plot, the black dots exemplify the onset and offset of FSlope.
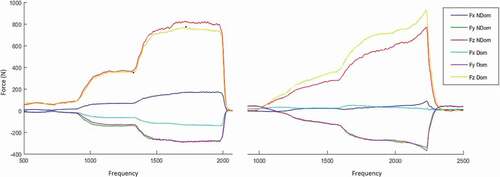
Table 1. Formulas used for calculation of the strength variables.
Prior to the data analyses, a visual inspection of the force signals was conducted to identify deviations from the expected plotting. It was expected that the participant would maintain an MVC period with a plateau effect, however, given the unknown influence of the physical impairment on isometric strength, deviations could be a representation of the impact of impairment. Following this rationale, trials were selected for analysis if a) trials showed an expected MVC plateau ( left); b) a plateau was not shown but both trials of the same condition presented a similar pattern. If a participant showed, for the same condition, a deviation from the expected plotting in one trial (e.g., right) and a plateau effect in the other trial (e.g., left), only the trial with the expected pattern was selected. Following this visual inspection, each participant’s outcome from the same condition was averaged and used as such in the statistical analyses.
Manual muscle testing
The MMT scores for elbow extension, elbow flexion, and wrist flexion ranged from zero to five. To combine our simplified dichotomous hand function assessment with the MMT scores, ‘not-impaired’ vs. ‘impaired’ was converted into ‘good muscle response’ (MMT = 5) vs. ‘poor muscle response’ (MMT = 2).The MMT scores were summed resulting in an upper-limb MMT sum score, ranging from 4 to 40.
Handcycling performance test
The outcome measures POpeak and POmean were defined as the highest power output and the mean power output, respectively, during the 20-s isokinetic sprint test. For each athlete, the official time-trial result of the event where he/she was tested was calculated into average velocity (m/s) () and used as the outcome measure of field handcycling performance.
Table 2. Participant characteristics based on the handcycling performance test. (SD = Standard deviation).
Statistical analysis
Statistical analyses were conducted using R software (version 3.6.3.). Initially, univariate regression analyses were conducted to investigate the importance of each force variable individually as an independent variable on the performance outcome, which was the dependent variable. Afterwards, a correlation matrix was used to identify multicollinearity between pairs of isometric strength variables. When pairs strongly correlated (r ≥ .8), one of the outcomes was removed from further analysis based on the explained variance found in the univariate outcomes.
The remaining outcomes were included in three stepwise bi-directional regression analyses with as dependent variables: a) POmean; b) POpeak; c) TTvelocity. In addition, after finding the variables that best predicted performance, a sensitivity analysis was conducted by removing the athletes who did not compete in recumbent handbikes (i.e., athletes classified in H5).
Finally, for each performance outcome, a regression analysis was conducted with the MMT sum score as the independent variable. The normality of the model residuals was assessed via Q-Q plots and the Shapiro Wilk test. Homoscedasticity was assessed via residuals by fitted values plots and the Koenker test. Alpha level was set at .05 for all tests.
Results
From the individual visual inspection, six out of the 62 athletes presented unexpected but constant force patterns during strength trials. Five athletes presented irregularities in only one of the strength trials, leading to exclusion of these specific strength trials from further analysis. In addition, 18 athletes did not undertake the sprint test due to technical incompatibilities between the handbike and the ergometer or due to athlete’s choice, two did not complete the time-trial race, and one athlete did not perform the push task. Lastly, one athlete had a technical problem with his handbike during the sprint test which prevented the completion of the entire 20-s sprint test and, consequently, the collection of the POmean. The missing data led to an analytical sample of 43 athletes for the POmean regression model, 44 athletes for the POpeak regression model, and 59 athletes for the TTvelocity regression model. Participants’ characteristics are provided in .
Force variables—univariate and multicollinearity analysis
Based on the initial univariate regression analyses, Fz and Ftot were significant and strongest (highest R2) associated with the performance outcomes (). The coefficient of variation and asymmetry ratio of these variables were also significantly associated with sprint performance.
Table 3. Explained variances of handcycling performance for each univariate regression for both the dominant and non-dominant upper limb.
Variable Fz showed a comparable association with performance between the dominant and non-dominant sides, which were highly correlated with each other (Appendix I). Fz from the dominant side was chosen to be included as the main variable. Based on the multicollinearity analysis (Appendix I), the following variables were included for further analysis: Pull Fz Dom, varFz Dom, varFz NDom, Feff NDom, varFeff NDom, varFeff Dom, FSlope Dom, FSlope NDom, AsymFz, AsymvarFz, asymFSlope; push Fz Dom, varFz Dom, Feff Dom, Feff NDom, varFeff Dom, varFeff NDom, FSlope Dom, FSlope Ndom, AsymFz, AsymvarFz, AsymFSlope, varFtot NDom.
Stepwise regression models
When the variables were combined in the multiple stepwise regression analyses, Fz appeared to be the final significant determinant of handcycling sprint performance and average time-trial velocity. The contribution of the additional independent variables to the regression models was not significant, despite their weak to moderate associations with the performance outcomes in the univariate regression analysis.
In the regression models with POmean and POpeak as dependent variables, Fz Dom push and Fz Dom pull were significant determinants (p < .005), with explained variances of 80% and 81%, respectively (). After performing a sensitivity analysis by removing the H5 athletes, the coefficient of determination remained comparable (POmean R2 = .80; POpeak R2 = .81). A modification of the independent variables included in the sprint test models by the respective non-dominant variable also revealed comparable explained variances (POmean R2 = .76; POpeak R2 = .77).
Table 4. Handcycling performance regression models (Pomean, POpeak, and TTvelocity) based on isometric strength setup and manual muscle test. (SE = Standard error; CI = Confidence interval).
In the model with TTvelocity as the dependent variable, only variable Fz Dom push was a significant determinant of performance (p < .001), explaining 29% of the variance in TTvelocity (). With the removal of the H5 athletes from the model, the coefficient of determination remained comparable (TTvelocity R2 = .31). In , the comparable association based on the respective non-dominant variable is shown (Fz NDom push R2 = .25).
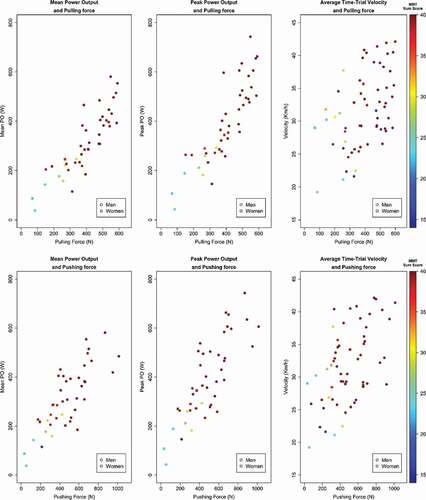
In the additional models with MMT sum score as the independent variable, all models presented significant but considerably lower explained variances (TTvelocity: R2 = .18, p = .001; POmean: R2 = .40, p < .001; POpeak: R2 = .38, p < .001) () when compared with the respective upper-limb isometric strength regression models. presents the scatterplots of the upper-limb pull and push forces and handcycling performances with the notation of the MMT sum score.
Figure 4. Scatterplots of isometric upper-limb pull (above) and push (below) and the different handcycling performance measures, distinguished based on sex and MMT sum score. MMT Manual Muscle Test.
Discussion and implications
Force variables
Isometric horizontal and total force showed the strongest associations with each of the three performance outcomes, varying from strong associations with the standardised sprint outcomes to moderate associations with the average time-trial velocity. The tendency for higher associations with the sprint outcomes was consistent throughout all the other strength variables, highlighting the importance of standardisation in sport-specific tests when studying performance determinants.
Given the nature of handcycling, strong associations were expected between isometric upper-limb push and pull forces and performance outcomes. In fact, upper-limb strength has been significantly associated with performance in other para-sports. Janssen et al., in a study involving a comparable population (n = 44 individuals with SCI ranging from C5 to L5), showed strong associations between highly specific isometric wheelchair push force on an instrumented handrim wheelchair ergometer and the wheelchair sprint POmean (R2 = .75), aerobic POpeak (R2 = .66), and peak oxygen uptake (R2 = .76) (Janssen et al., Citation1993). Similarly, Connick et al., (Citation2018) found strong associations between isometric upper-limb push and 15 m top speed (R2 = .66–.69) and absolute top speed (R2 = .76–.77), in elite wheelchair racing athletes (n = 32 individuals with SCI ranging from C5 to L2).
Stepwise regression models
Given that previous research has shown slightly higher correlations between the dominant limb (= less impaired) and performance in individuals with physical impairments (Beckman et al., Citation2016; Connick et al., Citation2018; De Groot et al., Citation2021), Fz from the dominant side was included in the regression analyses. Nevertheless, the results suggested comparable associations for the isometric strength results of the non-dominant side. In addition, force values of all athletes were included in the models. This included athletes classified in H5, meaning the user-device interface is inherently different as they compete in a kneeling position using an arm-trunk powered handbike, and, for that reason, the strength measurement setup proposed is less sport specific for this group of athletes. Nevertheless, the results with and without these athletes were similar.
The exclusion of the additional variables from the regression models suggests that, once Fz is included, their contribution is no longer significant. Yet, such findings do not imply that these characteristics are not important for handcycling performance, as their respective weak to moderate associations may lead to minor changes in performance. Future research should deepen the understanding of the importance of these strength characteristics in other populations. Athletes with neurological impairments (such as spasticity, ataxia or athetosis), may present impaired strength (De Groot et al., Citation2012), however, given the nature of the impairment, athletes are likely to show problems of muscle coordination (Hogarth et al., Citation2019). Rather than isometric strength, velocity-dependent performances are possibly more impacted by these type of impairments (De Groot et al., Citation2012,) which could be better assessed with dynamic measures of force effectiveness, variability, and asymmetry, for example.
Power output sprint test
The isometric horizontal pull force showed a stronger association with handcycling sprint performance than horizontal push force. This is in line with previous studies in handcycling (Kraaijenbrink et al., Citation2020; Quittmann et al., Citation2018, Citation2020; Vegter et al., Citation2019) that observed a higher power production in able-bodied individuals during the pull phase, especially under high workloads such as an all-out sprint. In a recent study with H3 and H4 handcycling athletes, Nevin and Smith, (Citation2021) found significant associations between both bench pull and bench press relative strength and handcycling performance (sprint test and time-trial velocity). The authors suggested a higher contribution of the pull force given the higher correlation of time-trial velocity and relative bench pull strength (r = .77) compared with relative bench press strength (r = .70), yet both revealing strong associations (Nevin & Smith, Citation2021). Interestingly, during the 15-s sprint, where higher workload intensities are expected, the authors did not find a clear greater contribution of the pull strength, as correlation coefficients between the 15-s sprint POpeak and relative pull and push strength were .70 (R2 = .49) and .73 (R2 = .53), respectively (Nevin & Smith, Citation2021).
Apart from the clear differences in the protocols between Nevin and Smith (Citation2021) and the current study (one-repetition maximum (1RM) bench press and prone bench pull versus maximal voluntary push/pull isometric contractions), both studies used standardised sprint test POpeak as a performance measure (Nevin & Smith, Citation2021). However, our associations between upper-limb isometric strength and POpeak were relatively stronger for both pull (Dom R2 = .75, NDom R2 = .70) and push (Dom R2 = .67, NDom R2 = .71). These findings, together with the explained variance of the sprint regression models from the current study (80%–81%), may suggest the greater sport specificity of our isometric strength setup in respect to handcycling sprint performance.
Average time-trial velocity
The majority of the literature available is based on able-bodied individuals and caution is needed when transferring the findings to handcycling athletes (Kraaijenbrink et al., Citation2021; Mason et al., Citation2021). In contrast with previous studies (Kraaijenbrink et al., Citation2020; Nevin & Smith, Citation2021; Quittmann et al., Citation2018; Stone et al., Citation2019), a case study with an experienced handcyclist found more force generated during the push phase (Verellen et al., Citation2012), which was supported by a recent study with trained H3 and H4 handcycling athletes showing a greater torque during the push phase (Mason et al., Citation2021). In the current study, the findings also suggested a greater contribution of the push phase to the TTvelocity. Pull force was no longer a significant determinant of TTvelocity once push force was included in our model. The TTvelocity is evidently affected by various other determinants than isometric pull/push force. For example, it is influenced by environmental conditions, loss of power to overcome air drag, race strategy, talent, work capacity, physiological limitations, and the handbike-athlete interface.
The explained variance of our TTvelocity regression model (R2 = .29) was weaker than found by Nevin and Smith, (Citation2021) (pull R2 = .59; push R2 = .49). It could be suggested that bench press and prone bench pull 1RM are more associated with handcycling field performance. Since 1RM is a dynamic assessment, a stronger association with performance could be expected as suggested in previous studies (Beckman et al., Citation2017; De Groot et al., Citation2012). However, it must be highlighted that our sample included elite handcycling athletes, presented greater heterogeneity in terms of type and severity of impairments competed during actual international events, and performed different distances and circuits which were dependent on their sports class and event raced, whereas Nevin and Smith studied a relatively smaller sample of athletes with paraplegia or amputations, all performing the same, relatively shorter, distance and not part of an official race (Nevin & Smith, Citation2021).
In addition, we found significant associations between handcycling performance and absolute upper-limb strength (i.e., not normalised to body mass), in contrast to Nevin and Smith who only found significant associations between performance and relative strength, but not absolute strength (Nevin & Smith, Citation2021). We did not conduct relative-strength analyses given the complex triad between performance, body mass, and different impairment types (Nooijen et al., Citation2021). Future research should deepen the understanding of body mass in actual para-cycling athletes’ performance. It could be argued that such divergences between the two studies are a result of the type of handbike used, the sport-specific experience and activity limitation of the user, the characteristics of lab standardisation versus field competition, and the testing protocol implemented.
Power output sprint test vs. Average time-trialvelocity
The difference of 80%–81% of explained variance in our sprint regression models with 29% in the time-trial regression model could be expected. The standardised sprint test conducted in a controlled setting differs from the field environment of a competition event. Although highly correlated (Nooijen et al., Citation2021), the 20-s isokinetic sprint does not fully mimic a time-trial race which involves steering, air-drag, rolling resistance, environmental conditions such as weather and circuit characteristics, pacing strategies, and its own physiological demands − 20-s predominantly anaerobic effort versus 20–40 minutes of anaerobic-aerobic effort (Der Zwaard S et al., Citation2018). In summary, the short-term maximal voluntary contraction in the isometric setup is probably more similar to the 20-s isokinetic simplistic and standardised sprint test, than with the complex multifactorial long-term aerobic performance with power production and power losses required in a time-trial race. The combination of strength with physiological parameters, such as aerobic capacity or peak heart rate, could better predict a performance like the time-trial race. However, in compliance with the Paralympic and UCI regulations (International Paralympic Committee, Citation2015; Union Cycliste Internationale, Citation2021), physiological impairments are not eligible and therefore were not included in our measurements.
In addition, the characteristics inherent to two different circuits (Ostend versus Emmen) plus the difference in the distances raced by different classes are likely to affect the relationship observed in the TTvelocity regression model. Correcting the models for sex, age, distance raced, type of impairment, training workload and experience, or handcycling configuration may contribute to a more accurate prediction of performance. However, the goal was not to find the best prediction model but rather to find the isometric strength characteristics that contributed most to handcycling performance. However, we advise that future research consider the impact that the standardised equipment-athlete interface during a laboratory measurement may have on masking the real limitation caused by an impairment during field competition. In our force setup, athletes were strapped and attached to the rigid beam in a standardised manner and had their handbike attached to an ergometer during the sprint test. Once in their handbike, the athletes face different settings and little is known on the impact that different strapping or lower-limb support may have on the impairment–performance relationship.
MMT vs. Isometric‘handcycle-based’ ratio-scale strength assessment
Isometric strength measurements have been used in other Paralympic classifications studies to investigate impaired muscle strength, and have been praised to be more objective and reliable than expert-based assessments (Beckman et al., Citation2017). Indeed, given the ratio-scale nature, the task-specific measurement conditions, and the standardisation of the proposed protocol, the isometric ‘handcycle-based’ strength setup outperformed the MMT, as hypothesised. This is partly observed in , where isometric strength provides greater discrimination between participants in comparison with the MMT sum score.
Our results confirmed the preference for isometric strength setups given the relatively larger explained variances. However, these stronger associations, especially in the case of the sprint performance, may also indicate a greater vulnerability of the isometric strength assessment to training interventions (Beckman et al., Citation2017). For example, in a study with individuals with and without cerebral palsy, De Groot et al. observed weaker correlations in able-bodied suggesting a ceiling effect between the knee force and the cycling performance, but not in participants with cerebral palsy (De Groot et al., Citation2012). Such characteristic was not observed in our graphs () in the athletes with the least impairments (H5), which may imply that when an athlete with or without upper-limb impairments undergoes strength training he/she is likely to perform better in the isometric strength assessment. In comparison, the MMT, especially an adapted MMT assessment (Tweedy et al., Citation2010) to handcycling with distinct functional scores, (Rosén et al., Citation2020) is possibly more robust and improvements in strength capacity by the athletes with the greatest impairments will hardly be reflected in changes on the MMT score. Since the IPC guidelines (IPC, Citation2015) recommend the inclusion of reliable, objective, standardised, and ratio-scale measurements during classification, more research is needed, first, to understand the vulnerability of sensitive measurement setups to elite Paralympic training interventions, and second, to provide the classification panels with strength reference values for specific populations.
The current findings seem to suggest that the athletes with the greatest upper-limb impairments show the lowest force values as well as the worst handcycling performances. This supports the allocation of athletes based on upper-limb strength. The significant moderate to strong correlations between the isometric strength measurements and the handcycling performance, suggest that our proposed measurement setup is valid for the assessment of strength impairment in recumbent handcycling athletes. In addition, the demands of the push and pull isometric tasks required the combination of work exerted through a multisegmental chain of shoulder, elbow, and wrist joints, rather than isolated muscle assessments.
Limitations
This study reported on strength measurements of a large sample of elite handcyclists, including different sexes, impairment types, and sports classes. The present study is limited by the small number of athletes with severe upper-limb impairments, although this is a reflection of the current representation during elite competitions. In addition, the TTvelocity findings are limited by the absence of a detailed time-trial performance. Per section data, like during the final sprint, and combined with power output data could improve our understanding of the push and pull determinants.
The implementation of an isometric strength and performance field-lab during the most prestigious handcycling yearly events makes a highly standardised individualised approach impractical. It would be important to improve the current strength setup towards perfect shoulder-elbow matching angles between handbike and strength measurements, as well as the same muscle force-length relationship across participants. Although we do not have reasons to believe that these small individual variations affected the study conclusion, future research should investigate whether modifications in the user-device interface may contribute to exert maximal force and, consequently, affect the association with performance. In addition, the circular handcycling propulsion pattern involves more than upper-limb push and pull. Adapting the current protocol for isometric upward and downward strength tests may contribute to a broader understanding of the upper-limb function in handcycling performance.
Conclusion
The present study is the first to have measured handcycling-specific 3D isometric strength characteristics of H1 to H5 elite handcycling athletes during world cups and championships. Isometric push and pull strength, measured with a novel task-specific standardised ratio-scale setup, was strongly associated with standardised handcycling short duration peak performances, explaining 81% of the variance in peak power output. In addition, significant moderate associations were found between push and pull strength and the average time-trial velocity during elite road races, which is a multifactorial-based performance measure. These findings are relevant for the development of an evidence-based classification system and seem to align with the current classification. The distinct sports classes compensates for the possible disadvantages that athletes with the greatest impairments have compared to the athletes without upper-limb impairments. This is essential to protect sports participation and competition fairness. Yet, as a clear reflection of the lack of athletes with the greatest impairments in elite sports competition, the limited representation of athletes with triceps impairments (essential for pushing) and the absence of athletes with biceps impairments (essential for pulling) does not allow us to find clear cut-off values, which would be optimal from a classification perspective.
Supplemental Material
Download PDF (291.1 KB)Acknowledgement
We would like to thank the technical department of the Department of Human Movement Sciences, VUA, for their contribution to the development of the isometric strength setup.
Disclosure statement
Nopotential conflict of interest was reported by the author(s).
Supplementary material
Supplemental data for this article can be accessed online at https://doi.org/10.1080/14763141.2022.2071760.
Additional information
Funding
References
- Beckman, E.M., Newcombe, P., Vanlandewijck, Y., Connick, M.J., & Tweedy, S.M. (2014). Novel strength test battery to permit evidence-based paralympic classification. Medical Journal, 93(4), 1–8. https://doi.org/https://doi.org/10.1097/MD.0000000000000031
- Beckman, E.M., Connick, M.J., & Tweedy, S.M. (2016). How much does lower body strength impact paralympic running performance? European Journal of Sport Science, 16(6), 669–676. https://doi.org/https://doi.org/10.1080/17461391.2015.1132775
- Beckman, E.M., Connick, M.J., & Tweedy, S.M. (2017). Assessing muscle strength for the purpose of classification in paralympic sport: A review and recommendations. Journal of Science and Medicine in Sport, 20(4), 391–396. https://doi.org/https://doi.org/10.1016/j.jsams.2016.08.010
- Connick, M.J., Beckman, E., Vanlandewijck, Y., Malone, L.A., Blomqvist, S., & Tweedy, S.M. (2018). Cluster analysis of novel isometric strength measures produces a valid and evidence-based classification structure for wheelchair track racing. British Journal of Sports Medicine, 52(17), 1123–1129. https://doi.org/https://doi.org/10.1136/bjsports-2017-097558
- De Groot, S., Dallmeijer, A.J., Bessems, P.J.C., Marcel, L., Der Woude LH, V., & Janssen, T.W.J. (2012). Comparison of muscle strength, sprint power and aerobic capacity in adults with and without cerebral palsy. Journal of Rehabilitation Medicine, 44(11), 932–938. https://doi.org/https://doi.org/10.2340/16501977-1037
- De Groot, S., Janssen, T.W.J., Evers, M., Van Der Luijt, P., Nienhuys, K.N.G., & Dallmeijer, A.J. (2012). Feasibility and reliability of measuring strength, sprint power, and aerobic capacity in athletes and non-athletes with cerebral palsy. Developmental Medicine and Child Neurology, 54(7), 647–653. https://doi.org/https://doi.org/10.1111/j.1469-8749.2012.04261.x
- De Groot, S., Kouwijzer, I., Valent, L.J.M., Der Woude LH, V., Nash, M.S., & Cowan, R.E. (2021). Good association between sprint power and aerobic peak power during asynchronuous arm- crank exercise in people with spinal cord injury. Disability and Rehabilitation, 43(3), 378–385. https://doi.org/https://doi.org/10.1080/09638288.2019.1625978
- Der Zwaard S, V., Der Laarse WJ, V., Weide, G., Bloemers, F.W., Hofmijster, M.J., Levels, K., Noordhof, D. A., Koning, J. J., Ruiter, C. J., & Jaspers, R. T. (2018). Critical determinants of combined sprint and endurance performance: An integrative analysis from muscle fiber to the human body. The FASEB Journal, 32(4), 2110–2123. https://doi.org/https://doi.org/10.1096/fj.201700827R
- Hislop, H., & Montgomery, J. (2007). Daniels and Worthingham’s muscle testing: Techniques of manual examination (8th ed.). Saunders Elsevier.
- Hogarth, L., Payton, C., Nicholson, V., Spathis, J., Tweedy, S., Connick, M., Beckman, E., Van de Vliet, P., & Burkett, B. (2019). Classifying motor coordination impairment in para swimmers with brain injury. Journal of Science and Medicine in Sport, 22(5), 526–531. https://doi.org/https://doi.org/10.1016/j.jsams.2018.11.015
- International Paralympic Committee. (2015). IPC athlete classification code. International Paralympic Committe. Retrieved September 3, 2021, from https://www.paralympic.org/sites/default/files/document/151218123255973_2015_12_17+Classification+Code_FINAL.pdf
- IPC. (2015). Athlete classification code. Retrieved September 3, 2021, from https://www.paralympic.org/sites/default/files/2020-05/170704160235698_2015_12_17%2BClassification%2BCode_FINAL2_0-1.pdf.
- Janssen, T.W.J., Van Oers, C., Hollander, P., & van der Woude, L.H.V. (1993). Isometric strength, sprint power and aerobic power. Medicine & Science in Sports & Exercise, 25(7), 863–870. https://doi.org/https://doi.org/10.1249/00005768-199307000-00016
- Kraaijenbrink, C., Vegter, R.J.K., Hensen, A.H.R., Wagner, H., & Der Woude LHV, V. (2020). Biomechanical and physiological differences between synchronous and asynchronous low intensity handcycling during practice-based learning in able-bodied men. Journal of Neuroengineering and Rehabilitation, 17(1), 1–13. https://doi.org/https://doi.org/10.1186/s12984-020-00664-8
- Kraaijenbrink, C., Vegter, R., de Groot, S., Arnet, U., Valent, L., Verellen, J., van Breukelen, K., Hettinga, F., Perret, C., Abel, T., Goosey-Tolfrey, V., & van der Woude, L. (2021). Biophysical aspects of handcycling performance in rehabilitation, daily life and recreational sports; a narrative review. Disability and Rehabilitation, 43(24), 3461–3475. https://doi.org/https://doi.org/10.1080/09638288.2020.1815872
- Litzenberger, S., Mally, F., & Sabo, A. (2015). Influence of different seating and crank positions on muscular activity in elite handcycling - a case study. Procedia Engineering, 31(2), 355–360. https://doi.org/https://doi.org/10.1016/j.proeng.2015.07.262
- Mason, B.S., Stone, B., Warner, M.B., & Goosey-Tolfrey, V.L. (2021). Crank length alters kinematics and kinetics, yet not the economy of recumbent handcyclists at constant handgrip speeds. Scandinavian Journal of Medicine & Science in Sports, 31(2), 388–397. https://doi.org/https://doi.org/10.1111/sms.13859
- Nevin, J., & Smith, P.M. (2021). The anthropometric, physiological, and strength-related determinants of handcycling 15-km time-trial performance. International Journal of Sports Physiology and Performance, 16(2), 259–266. https://doi.org/https://doi.org/10.1123/IJSPP.2019-0861
- Nooijen, C., Muchaxo, R.E.A., Liljedahl, J., Bjerkefors, A., Janssen, T.W.J., Van Der Woude, L.H., Arndt, A., & de Groot, S. (2021). The relation between sprint power and time trial performance in elite paracyclists. Journal of Science and Medicine in Sport, 24(11), 1193–1198. https://doi.org/https://doi.org/10.1016/j.jsams.2021.04.014
- Quittmann, O.J., Meskamper, J., Abel, T., Albracht, K., Foitschik, T., Rojas-Vega, S., & Strüder, H. K. (2018). Kinematics and kinetics of handcycling propulsion at increasing workloads in able-bodied subjects. Sports Engineering, 21(4), 283–294. https://doi.org/https://doi.org/10.1007/s12283-018-0269-y
- Quittmann, O.J., Abel, T., Albracht, K., & Strüder, H.K. (2020). Biomechanics of all-out handcycling exercise: Kinetics, kinematics and muscular activity of a 15-s sprint test in able-bodied participants. Sports Biomechanics, 1–24. https://doi.org/https://doi.org/10.1080/14763141.2020.1745266
- Quittmann, O.J., Meskemper, J., Albracht, K., Abel, T., Foitschik, T., & Strüder, H.K. (2020). Normalising surface EMG of ten upper-extremity muscles in handcycling: Manual resistance vs. sport-specific MVICs. Journal of Electromyography and Kinesiology, 51(4), 102402. https://doi.org/https://doi.org/10.1016/j.jelekin.2020.102402
- Quittmann, O.J., Abel, T., Albracht, K., & Strüder, H.K. (2021). Reliability of muscular activation patterns and their alterations during incremental handcycling in able-bodied participants during incremental handcycling in able-bodied participants. Sport Biomechine, 20(05), 603–618. https://doi.org/https://doi.org/10.1080/14763141.2019.1593496
- Rosén, J.S., Goosey-Tolfrey, V.L., Tolfrey, K., Arndt, A., & Bjerkefors, A. (2020). Interrater reliability of the new sport-specific evidence-based classification system for Para Va’a. Adapted Physical Activity Quarterly, 37(3), 241–252. https://doi.org/https://doi.org/10.1123/apaq.2019-0141
- Stone, B., Mason, B.S., Warner, M.B., & Goosey-Tolfrey, V.L. (2019). Shoulder and thorax kinematics contribute to increased power output of competitive handcyclists. Scandinavian Journal of Medicine & Science in Sports, 29(6), 843–853. https://doi.org/https://doi.org/10.1111/sms.13402
- Tong, W., Chu, V., & Sanger, T.D. (2009). Force variability during isometric biceps contraction in children with secondary dystonia due to cerebral palsy. Movement Disorders, 24(9), 1299–1305. https://doi.org/10.1002/mds.22573
- Tweedy, S.M., Williams, G., & Bourke, J. (2010). Selecting and modifying methods of manual muscle testing for classification in paralympic sport. European Journal of Adapted Physical Activity, 3(2), 7–16. https://doi.org/https://doi.org/10.5507/euj.2010.005
- Tweedy, S.M., & Vanlandewijck, Y.C. (2011). International paralympic committee position stand-background and scientific principles of classification in paralympic sport. British Journal of Sports Medicine, 45(4), 259–269. https://doi.org/https://doi.org/10.1136/bjsm.2009.065060
- Union Cycliste Internationale. (2020). Paracyclisme. Retrieved September 3, 2020, fromhttps://www.uci.org/para-cycling/[2021
- Union Cycliste Internationale. (2021). Part 16 para-cycling. In UCI cycling regulations (pp. 1–96). Union Cycliste Internationale document.
- Veeger, H.E.J., Van Der Woude, L.H.V., & Rozendal, R.H. (1992). Effect of handrim velocity on mechanical efficiency in wheelchair propulsion. Medicine and Science in Sports and Exercise, 24(1), 100–107. https://doi.org/https://doi.org/10.1249/00005768-199201000-00017
- Vegter, R.J.K., Mason, B.S., Sporrel, B., Stone, B., Van Der Woude, L.H.V., & Goosey-Tolfrey, V.L. (2019). Crank fore-aft position alters the distribution of work over the push and pull phase during synchronous recumbent handcycling of able-bodied participants. PLoS One, 14(8), 1–14. https://doi.org/https://doi.org/10.1371/journal.pone.0220943
- Verellen, J., Meyer, C., Janssens, L., & Vanlandewijck, Y. (2012). The impact of spinal cord injury lesion level on force generation effectiveness during handcycling [Doctoral dissertation]. Katholieke Universiteit Leuven. Analysis Performance Determinants in Handcycling. 79–94.
- Verellen, J., Janssens, L., Meyer, C., Vanlandewijck, Y.C. (2012). A handbike ergometer to measure the three dimensional force generation pattern during arm crank propulsion in realistic handcycling conditions [Doctoral dissertation]. Katholieke Universiteit Leuven. 61–78.
- Verellen, J., Meyer, C., Janssens, L., Vanlandewijck, Y. (2012). An integrated kinetic, kinematic and EMG analysis to interpret gross mechanical efficiency in arm powered versus arm trunk powered handcycling: An exploratory study [Doctoral dissertation]. Katholieke Universiteit Leuven. 111–136.
- Verellen, J., Janssens, L., Meyer, C., & Vanlandewijck, Y. (2012). Development and application of a handbike ergometer to measure the 3D force generation pattern during arm crank propulsion in realistic handcycling conditions. Sports Technology, 5(1–2), 65–73. https://doi.org/https://doi.org/10.1080/19346182.2012.754894
- Zeller, S., Abel, T., & Strueder, H. (2017). Monitoring training load in handcycling: A case study. Journal of Strength and Conditioning Research, 31(11), 3094–3100. https://doi.org/https://doi.org/10.1519/JSC.0000000000001786