
Abstract
The Neotropical leaf litter frog genus Pristimantis is very species-rich, with 526 species described to date, but the full extent of its diversity is much higher and remains unknown. This study explores the phylogenetic processes and resulting evolutionary patterns of diversification in Pristimantis. Given the well-recognised failure of morphology- and community-based species groups to describe diversity within the genus, we apply a new test for the presence and phylogenetic distribution of higher evolutionary units. We developed a phylogeny based on 260 individuals encompassing 149 Pristimantis presumed species, sampled at mitochondrial and nuclear genes (3718 base pair alignment), combining new and available sequence data. Our phylogeny broadly agrees with previous studies, both in topology and age estimates, with the origin of Pristimantis at 28.97 (95% HDP =21.59 – 37.33) million years ago (MYA). New taxa that we add to the genus, which had not previously been included in Pristimantis phylogenies, suggest considerable diversity remains to be described. We assessed patterns of lineage origin and recovered 14 most likely (95% CI: 13–19) phylogenetic clusters or higher evolutionary significant units (hESUs) within Pristimantis. Diversification rates decrease towards the present following a density-dependent pattern for Pristimantis overall and for most hESU clusters, reflecting historical evolutionary radiation. The timing of diversification suggests that geological events in the Miocene, such as Andes orogenesis and Pebas system formation and drainage, may have had a direct or indirect impact on the evolution of Pristimantis and thus contributed to the origins of evolutionary independent phylogenetic clusters.
Introduction
The tropical forests of South America boast a disproportionately high percentage of the world’s biodiversity (Myers, Mittermeier, Mittermeier, da Fonseca, & Kent, Citation2000; Wilson, Citation1988), with mountainous regions being particularly speciose (Cracraft, Citation1985; Gentry, Citation1992; Hernandez & Young, Citation2007). Investigation into the high levels of diversity and endemism in Neotropical amphibians, facilitated largely by traits like low vagility and tendency toward philopatry, has the potential to greatly increase our understanding of the diversification of all South American biota (Duellman, Citation1999; García-R et al., Citation2012; Loyola, Kubota, da Fonseca, Lewinsohn, 2009; Zeisset & Beebee, Citation2008). To date, phylogenetic and biogeographical studies have supported the hypothesis that Andean orogeny (4.5–23 MYA), which changed the course of the Amazon River and formed ridges, as well as the formation of the Pebas wetlands system (8–23 MYA), caused rapid diversification across many taxonomic groups, including amphibians (Antonelli et al., Citation2010; Castroviejo-Fisher, Guayasamin, Gonzalez-Voyer, & Vilà, Citation2014; Ceccarelli et al., Citation2016; De-Silva, Elias, Willmott, Mallet, & Day, Citation2016; Hoorn et al., Citation2010; Lougheed, Gascon, Jones, Bogart, & Boag, Citation1999; Muñoz-Ortiz, Velásquez-Álvarez, Guarnizo, & Crawford, Citation2015; Noonan & Wray, Citation2006; Sanín et al., Citation2016; Santos et al., Citation2009). Furthermore, disproportionately high species richness is found in the montane regions, for example in dart-poison frogs (Santos et al., Citation2009) and glass frogs (Castroviejo-Fisher et al., Citation2014; Hutter, Guayasamin, & Wiens, Citation2013), as well as birds (Kattan & Franco, Citation2004).
The widespread and understudied Neotropical amphibian genus Pristimantis (Anura, Terraranae, Craugastoridae) is the most speciose of terrestrial vertebrates at approximately 526 currently described species (Frost, Citation2018). There has been an increase in the description of new Pristimantis species in recent years due to molecular techniques revealing cryptic diversity (e.g. Elmer, Dávila, & Lougheed, Citation2007b; Elmer and Cannatella, Citation2008; Hutter & Guayasamin, Citation2015; Ortega-Andrade et al., Citation2015) and increased sampling in previously uncharted areas (Barrio-Amorós, Mesa, Brewer-Carías, & McDiarmid, Citation2010; Kaiser et al., Citation2015). The taxonomy of this group is complex and problematic due to the prevalence of high genetic variation within putative species (Crawford, Citation2003) combined with a lack of diagnostic morphological characters (Duellman & Lehr, Citation2009; Padial, Grant, & Frost, Citation2014). Several Pristimantis species are considered to be widespread over large areas, which conflicts with both current diversification hypotheses and the ecological traits amphibians exhibit, which have tended to facilitate speciation at more restricted geographic scales (Crawford Citation2003; Fouquet et al., Citation2007; Funk, Caminer, & Ron, Citation2012). Therefore, researchers have suggested that these widely distributed species more likely represent cryptic species complexes that have not been identified due to a lack of sampling (Elmer, Dávila, & Lougheed, Citation2007a; Funk et al., Citation2012). Recognising true species richness and cryptic species has major implications for fundamental understandings of diversification and biogeography, and critical utility for conservation management of biodiversity and of landscapes (Fouquet et al., Citation2007; Funk et al., Citation2012).
The basis for the exceptional species richness within Pristimantis and other terraranans has not been identified rigorously. Several hypotheses have been proposed, including specific phenotypic characteristics (Gonzalez-Voyer, Padial, Castroviejo-Fisher, & De la Riva, Citation2011), and the less restrictive direct development mode of reproduction allowing populations to disperse more widely, occupy a range of habitats (Hedges, Duellman, & Heinicke, Citation2008), and establish a rapid accumulation of population genetic isolation across the landscape (Elmer et al., Citation2007b; Prohl, Ron, & Ryan, Citation2010). Phylogenetic studies have placed the geographic origin of Pristimantis within South America (Heinicke, Duellman, & Hedges, Citation2007; Pinto-Sánchez et al., Citation2012), with multiple independent dispersal events into Central America (Hedges et al., Citation2008; Pinto-Sánchez et al., Citation2012). More recently, Mendoza, Ospina, Cárdenas-Henao, & Garcia-R (Citation2015) recognised a mid-elevational band (1000–3000 masl) in the North-western Andes (Colombia and Ecuador) as the focal point for the origin and radiation of Pristimantis, giving further support to the hypothesis that the mountainous north-western part of the continent acts as a species pump. However, the relationship of evolutionary rates within and across these Pristimantis clades has not been assessed.
The genus Pristimantis was divided into species series and species groups based on extensive morphological work by Lynch & Duellman (Citation1997). Later, many of these groups were not found to be monophyletic in subsequent molecular analyses (Hedges et al., Citation2008; Mendoza et al., Citation2015; Padial et al., Citation2014; Pinto-Sánchez et al., Citation2012). However, researchers were reluctant to revise the taxonomy of this genus largely due to a lack of comprehensive taxon sampling (Hedges et al., Citation2008). Padial et al. (Citation2014) reclassified Pristimantis into 11 species groups based on a parsimony-based phylogeny; yet given the extremely high species richness, this was based on less than a quarter of current species within the genus, suggesting there are still many unknown assignments. Without the cohesion of designated species groups, Pristimantis currently lacks any empirically derived units of diversity to focus and contextualise taxonomy and systematics. Such delimitations are key to further research on speciation, biogeography, and processes promoting diversification.
Our study explores the phylogenetic processes associated with diversification of the world’s most species-rich vertebrate genus, Pristimantis. We accomplish this by combining new multi-locus sequence data and new species with published datasets to achieve three goals. First, our study produced a dense, time calibrated phylogeny of the genus Pristimantis. Second, given the well-recognised failure of species groups to delineate natural genetic groups within the genus, we test for the presence and phylogenetic distribution of key evolutionary units within Pristimantis. This approach de-emphasises both the role of described species, which we know are far from complete, and the unevenness in geographical sampling, which may be biasing our current understanding of species richness across groups of Pristimantis. Finally, we highlight some taxonomic issues within our Pristimantis phylogeny with regards to geographic and species sampling, mis-identification, and likely instances of cryptic diversity, noting some taxonomic and geographic areas for further investigation.
Materials and methods
Species and genes analysed
The dataset comprises 260 individuals encompassing 149 recognised Pristimantis species, which represents around 30% of the currently described species (526 species, Frost, Citation2018). We combined 107 new and unpublished sequences (28 12S, 44 16S, 28 cytb and seven Rag1) for 50 individuals from Ecuador (sourced from collections at Museo de Zoología of Pontificia Universidad Católica del Ecuador (QCAZ); molecular methods follow) and 646 published sequences (170 for 12S, 210 for 16S, 70 for COI, 25 for cytb, 84 for Rag1 and 87 Tyr) accessed from GenBank (Table S1, see supplemental material online, which is available from the article’s Taylor & Francis Online page at https://doi.org10.1080/14772000.2018.1503202). These 210 individuals were originally sourced from the following countries Ecuador (n = 62), Colombia (n = 45), Peru (n = 34), Panama (n = 23), Costa Rica (n = 7), Guyana (n = 6), Trinidad and Tobago (n = 3), Honduras (n = 1) and Venezuela (n = 1), with 28 individuals having unknown location. We rooted the phylogeny using molecular data from four outgroups from the closely related genera Craugastor and Diasporus (following Pinto-Sánchez et al., Citation2012).
Molecular techniques for new data
Genomic DNA was extracted from ethanol-preserved tissue using either standard phenol-chloroform methods or a Qiagen DNEasy kit, following the standard protocol. The following primers were used for PCR: 12S (12Sa-L, 12Sb-H; Goebel Donnelly & Atz, Citation1999), 16S (16Sar-L, 16Sbr-H; Goebel et al., Citation1999), cytb (MVZ15L, MVZ16H; Goebel et al., Citation1999) and Rag1 (R182_Rag, R270_Rag; Heinicke et al., Citation2007).
Cocktails for each mitochondrial PCR reaction contained: 0.3 μM of the relevant forward and reverse primer, 5μL PCR enhancing buffer (2.5 mM MgCl2, 10 mM Tris pH 8.4, 50 mM KCl, 0.02 mg BSA, 0.01% gelatin), 0.3 mM dNTP, 0.625 units Taq DNA polymerase (Fermentas Life Sciences, UK) and approximately 1 to 3 ng DNA (in 1:10 dilutions). An Applied Biosystems 2700 or 9700 thermocycler was used for PCR. Cycling parameters for 16S were: 94° C for 2 min, 35 cycles of denaturing 94° C for 30 sec, annealing 60° C for 20 sec and extending 72° C for 20 sec, a final extension at 72° C for 5 min followed by extended cooling at 10 or 4° C. The parameters for 12S were the same as 16S, except with an annealing temperature of 50° C. The cytochrome b parameters were: initial denaturing at 92° C for 3 min, 38 cycles denaturing 92° C for 1 min, annealing 51° C for 1 min and extension 72° C for 1 min, a final extension of 72° C for 5 min followed by extended cooling at 4 or 10° C. PCR product was purified using Pall AcroPrep 96 Filter Plates.
Rag1 PCR cocktail contained: 2µl of 10 x PCR Rxn Buffer (Invitrogen), 1µl of MgCl2 (50mM, Invitrogen), 2µl of dNTPs (10mM), 0.2µl of both forward and reverse primer (10 pmole/µl), 0.2µl of Taq polymerase (Invitrogen) and 1 to 3 ng of DNA. The PCR protocol was as follows: an initial denaturating at 94 °C for 5 min, 35 cycles of denaturating at 94 °C for 30 sec, annealing at 60 °C for 30 sec and extension at 72 °C for 60 sec, a final extension at 72 °C for 7 min, followed by an extended cooling at 10 °C. The PCR products were purified using an ExoSap kit (Thermo Fisher) following the standard protocol. All mtDNA and nuclear reaction sets included a negative control.
All genes were sequenced using Applied Biosystems Big-Dye Ver 3.1 chemistry on an Applied Biosystems 3730 automated capillary DNA sequencer. Samples were sequenced in the forward and reverse directions, except for a subset of six cytb, one 12S, three 16S and five Rag1 samples that were only sequenced one direction.
Phylogenetic analyses
The sequence chromatograms were cleaned and compiled into consensus (when sequenced bi-directionally) using Geneious v6.1.4 (Kearse et al., Citation2012, http://www.geneious.com). The sequences for all six genes were aligned separately using the ‘ClustalW’ alignment option within Geneious with the default settings, and then concatenated. Before concatenation, 12S and 16S sequences were separately analysed with Gblocks v0.91 on the server (Castresana, Citation2000, http://molevol.cmima.csic.es/castresana/Gblocks_server.html) to remove unalignable regions using the following parameters: the minimum length for a block set at 5, allowed gap positions in half positions and the rest of settings kept as default (Massana et al., Citation2004). The final matrix had a total of 58% missing data.
Models of evolution were evaluated to select the best nucleotide substitution models to be used in further analysis. PartitionFinder v1.1.1 (Lanfear, Calcott, Ho, & Guindon, Citation2012) was used to identify the best substitution model and partition scheme on the concatenated dataset for each gene and codon position separately using the following parameters: branch lengths = linked, models = beast (models specific to the BEAST v1.7.5 program), model selection = Bayesian Information Criterion (BIC), and schemes = greedy. A six-partition scheme was found to be the best overall strategy: 16S, 12S and cytb_1 (GTR + I + G); cytb_2 (TrN + G); cytb_3 (TrN + G); COI_1, COI_2, COI_3 (GTR + I + G); Rag1_1, Rag1_2, Tyr_1, Tyr_2 (GTR + I + G) and Rag1_3 and Tyr_3 (HKY + G) and used for the phylogenetic analysis.
A time-calibrated phylogeny was inferred using Bayesian methods in BEAST v1.8 (Drummond, Suchard, Xie, & Rambaut, Citation2012) using secondary calibrations with the three age estimates used in Mendoza et al. (Citation2015), sourced originally from Heinicke et al. (Citation2007) and Pinto-Sánchez et al. (Citation2012). A normal prior distribution was used for all calibrations. BEAUti v.1.8 (Drummond et al. Citation2012) was used to prepare the xml file used by BEAST. A mean of 24.45 and standard deviation (SD) of 5.0 (2.5% quantile = 14.65, 75% quantile = 34.25) Ma was selected for the crown age of Pristimantis (following Mendoza et al. Citation2015). For the crown age of the monophyletic P. pardalis group (Wang, Crawford, & Bermingham, Citation2008) we used a mean of 8.6 and SD of 1.8 (2.5% quantile = 5.07, 75% quantile = 12.12) Ma, and for the crown age of P. taeniatus we chose a mean of 8.3 and SD of 1.76 (2.5% quantile = 4.85, 75% quantile = 11.75) Ma (following Mendoza et al. Citation2015). We used an uncorrelated lognormal relaxed clock model and the Yule species tree prior, following the methods of Pinto-Sánchez et al. (Citation2012). All other priors were left as default for BEAUti v.1.8 (ucld.mean = fixed value of 1, ucld.stdev = exponential with bounds 0 to ∞). Gaps were treated as missing data. The BEAST analysis was run for a chain length of 30 million with samples taken every 3,000 generations. From the resulting 10,000 trees, the first 10% was discarded as burn-in.
Higher evolutionary significant units (hESUs)
To test for the presence of evolutionary significant units above the species level (hESUs) across the tree, we employed the Generalised Mixed Yule Coalescent (GMYC) model (Fontaneto et al., Citation2007; Fujisawa & Barraclough, Citation2013; Pons et al., Citation2006), using the R package (R Core Team, Citation2017) ‘SPLITS’ 1.0 (Ezard, Fujisawa, & Barraclough, Citation2009). GMYC can determine evolutionary clusters above the species level using a time-calibrated tree, with tips representing species and not individuals (per Humphreys & Barraclough, Citation2014). The GMYC model estimates the time at which a change in the rate of phylogenetic branching cannot be explained by a single coalescent process. We employed the multiple threshold method (Monaghan et al., Citation2009) for increase in branching rate implemented in ‘SPLITS’, which has been suggested to be more accurate and robust (Humphreys & Barraclough, Citation2014; Postaire, Magalon, Bourmaud & Bruggemann, Citation2016). The tree used in this analysis was our maximum clade credibility (MCC) tree, pruned to include only one individual per species, excluding “aff”, “cf” and “sp” specimens as well as any uncertain identifications (total = 139 taxa included). Even though it was developed for single locus trees, the GMYC model has been shown to work effectively for combined datasets (e.g. Barej, Penner, Schmitz & Rödel, Citation2015; Jörger, Norenburg, Wilson & Schrödl, Citation2012; Low et al., Citation2016). This analysis tests for the presence of hESUs (Humphreys & Barraclough, Citation2014; Humphreys et al., Citation2016), which could represent phylogenetic species groups, as opposed to any phenetic species group (e.g. as proposed by Lynch & Duellman, Citation1997).
Rates of diversification
We applied multiple assessments of diversification rate, for Pristimantis overall and for the identified hESUs. First, we tested specific models of diversification through time for all of Pristimantis and for each hESU using LASER 2.3 (Rabosky, Citation2006), selecting the best fitting model using Akaike’s Information Criterion. Only hESUs with more than four taxa were used in the analysis (n = 10), as it requires more than three branching events. Second, lineage through time plots for the pruned MCC tree inferred in BEAST were generated in APE 3.09 (Paradis, Claude & Strimmer, Citation2004), using 1000 trees sampled from the posterior distribution. Third, to test whether diversification rates remained constant over time we applied the gamma statistic (Pybus & Harvey, Citation2000) with the Monte Carlo Constant Rate (MCCR) test (Pybus & Harvey, Citation2000) in LASER, which also accommodates incomplete species sampling (i.e., there are 526 Pristimantis species described, while our pruned tree has 139 species) by simulating full phylogenies, which are then randomly pruned to mimic incomplete sampling. Fourth, we used BAMM (Rabosky, Citation2014) to estimate speciation rates for the whole Pristimantis and each hESU using the MCC tree. BAMM is able to detect shifts in evolutionary rates within a phylogeny, using reversible jump Markov chain Monte Carlo to explore various models of lineage diversification. In addition, BAMM allows users to incorporate knowledge of incomplete taxon sampling in the likelihood calculation, so for the globalSamplingFraction parameter we used a value of 0.30, since our MCC tree includes 139 of the 526 species described for Pristimantis. We used a value of 1 for the prior on the expected number of shifts. Priors for BAMM were generated using the function setBAMMpriors in the R package BAMMtools v 2.1.6 (Rabosky et al., Citation2014) by providing the MCC tree (priors: lambdaInitPrior = 1.36594224825722; lambdaShiftPrior = 0.0397449192506994; muInitPrior = 1.36594224825722). We ran 5 million generations, sampling parameters every 1000 generations. The output of BAMM was then analysed in R using BAMMtools to calculate mean speciation and extinction rate, bayes factor (BF), and marginal odds-ratios. We discarded the first 30% of generations as burn-in and assessed convergence using CODA v 0.16–1 (Plummer, Best, Cowles & Vines, Citation2006). All parameters had effective sample sizes >400. We identified the most likely diversification scenarios for Pristimantis using Bayes Factor (BF) and marginal posterior-to-prior odd ratios, calculated speciation rates, and reconstructed rate-through-time curves for the genus and each hESU.
Results
Phylogenetic analyses
The total alignment of six genes was 3718 base pairs (bp) in length, made up of 715 bp for 12S, 503 bp for 16S, 666 bp for cytb, 673 bp for COI, 630 bp for Rag1 and 531 bp for Tyr. Posterior probabilities of ≥0.95 were obtained for 63% of the nodes (163 of 262) in our Bayesian consensus tree, though some nodes are weakly supported (). The origin of Pristimantis was estimated to be 28.97 MYA (95% HDP = 21.59 – 37.4 MYA) (; Fig. S1, see supplemental material online).
Fig. 1 Bayesian consensus time-tree for Pristimantis based on a 6-gene analysis of 264 frogs. The posterior probabilities are shown for each node. Time in millions of years before present and geological eras are noted. New specimens with this study are marked with ^. Full specimen information in Table S1 (see supplemental material online). 95% HPD for dating at nodes are shown in Fig. S1 (see supplemental material online). Calibration nodes noted with black dot (see Methods).
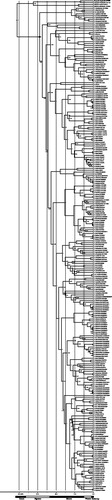
Our phylogeny did not recover as monophyletic any of the 15 species groups or series included in our dataset, with the exception of the peruvianus group (Table S1, see supplemental material online). The largest species group, unistrigatus, was represented by 97 individuals in our dataset and had individuals that appeared in most clades across our tree ().
Our phylogenetic analysis included 37 species that were represented by at least two exemplar individuals. After revisiting the voucher notes and assigning some vouchers with ‘aff’, 22 of these (60%) were found to be monophyletic, including five species for which we added new individuals (P. altamnis, P. lanthanites, P. librarius, P. luscombei, and P. quaquaversus). Eight species that were part of our dataset of new sequences were not recovered as monophyletic (P. altamazonicus, P. conspicillatus, P. croceoinguinis, P. diadematus, P. kichwarum, P. malkini, P. martiae and P. omevividis), along with a further seven species already on GenBank (P. bogotensis, P. eriphus, P. pardalis, P. peruvianus, P. unistrigatus, P. viejas and P. zophus). These likely represent misidentified specimens and cryptic diversity within putative species rather than incomplete lineage sorting (Table S2, see supplemental material online).
Higher evolutionary significant units
The GMYC model test for phylogenetic clusters showed evidence for the presence of 14 clusters (95% confidence interval of 13–19 clusters), or separately evolving units, within the Pristimantis tree (p = 0.004) (, ). This confidence interval is taken from the 95% confidence set of alternative models that identified the phylogenetic clusters, with 14 being the most likely value. Phylogenetic branching rates (a transition from clusters to coalescence; Humphreys and Barraclough Citation2014) increased at ca. 24.5, 20.5, 16.8 and 15.7 MYA based on the tree and the multiple-threshold GMYC model (Fig. S2, see supplemental material online). Two taxa, P. rozei and P. caprifer placed in a sister relationship, were not included in any cluster. Post hoc assessment suggests that one cluster, hESU A, corresponds to a previously described species group, the peruvianus species complex (as per Hedges et al., Citation2008; Table S1, see supplemental material online).
Fig. 2 Higher Evolutionary Significant Units (hESU) within Pristimantis. a) The 14 hESUs (A-N) recovered by the GMYC model with the multiple thresholds method (95% CI 13–19 clusters). Two species in black, P. caprifer and P. rozei, were not assigned (n/a). Node numbers indicate support based on the confidence set of models.
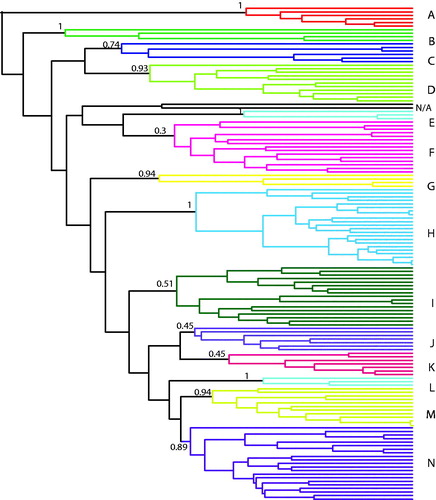
Table 1. Summary of higher evolutionary units (hESUs) recovered from time-calibrated Bayesian phylogeny of the pruned Pristimantis tree (139 in-group species; two non-assigned taxa not shown). Number of taxa per hESU, and time of origin (MYA) drawn from the time-calibrated tree.
Rates of diversification
Rate-variable models of diversification, which allow diversification rate to change overtime, were preferred over rate-constant models for Pristimantis overall and for all hESUs except one (hESU C pure birth: r = 0.053, AIC 23.90) (Table S3, see supplemental material online) by the LASER analysis. Of those rate-variable models, the density-dependent logistic (DDL) model was the best fit for Pristimantis overall and for the majority of hESUs (A, D, F, I, M, N; hESUs with fewer than five species were not included). These results concur with inference from the gamma statistic and the MCCR test, which suggested the diversification rate in Pristimantis was decreasing (γ = −5.67, p = 0.0008). Lineage through time plots for Pristimantis also suggest that species accumulation declined towards the present, with a plateau from ca. 11 MYA relative to a pure-birth model of diversification (Fig. S3, see supplemental material online).
BAMM analyses additionally suggested a density-dependent speciation process for the genus Pristimantis, with a speciation rate (mean λ = 0.18 species/My) that started high and declined towards the present (Fig. S4, Fig. S5, see supplemental material online). BAMM detected positive but low (mean μ = 0.03 species/My) extinction rate, but interpretation of extinction rates from trees without fossil data should be taken cautiously. This analysis does not support a shift in diversification rates for Pristimantis (Bayes Factors of 1 to 3 shifts each <1). For the marginal odds ratio, we retained rate shifts with a ratio greater than or equal to 5 (per default in BAMMtools); this gave two scenarios, one with no shifts being by far most likely (Fig. S4, f = 0.9, see supplemental material online) and a much less supported scenario with a single shift in speciation rate in hESU H (Fig. S4, f = 0.065, see supplemental material online). This is the same hESU for which the LASER analysis recovered a different rate-variable model from the other hESUs, i.e. a yule3rate as the best fitting diversification model (Table S3, see supplemental material online). A yule-n-rate model allows for shifts in speciation rates over time; this may explain congruence with BAMM identifying a shift in speciation within Pristimantis only in that clade. The rate-through-time plot for each hESU from the BAMM analysis shows declining speciation rates for Pristimantis and each hESU (A-N) (Fig. S5, see supplemental material online). Speciation rates and declines were similar between hESUs and Pristimantis, indicating support for a zero-shift scenario within the genus. We interpret the results of BAMM cautiously given possible misestimates, especially with incomplete lineage sampling (Meyer & Wiens, Citation2018), but note that the patterns of diversification rate are overall concordant across the multiple approaches we explored here.
Discussion
Phylogeny of Pristimantis
The time-calibrated phylogeny places the origin of Pristimantis at 28.97 MYA (95% HDP = 21.59 – 37.33 MYA), in the Oligocene epoch. Most of the phylogenetic relationships we recovered here are in general agreement with previous studies. However, because a number of basal nodes have low support (), as in previous studies (Hedges et al., Citation2008; Mendoza et al., Citation2015; Pinto-Sánchez et al., Citation2012), the ordering of larger clades differs amongst published trees due to these splits being unresolved. The phylogeny of Mendoza et al. (Citation2015) described five main clades (A, B, C, D1, D2) with their A, B, C clades generally resolved in our phylogeny, but with some taxa being unstable (e.g. P. caprifer, P. rozei). Their D1 and D2 clades appear the same in both topologies. Here we do not assess the concordance of relationship of each taxon across our full tree and the tree of Mendoza et al. (Citation2015) as such comparisons overemphasize final topologies, which as we have noted in some cases have weak support at deeper nodes. Rather, we focus on the statistically supported groupings at shallower scales inferred by hESUs and the taxonomic implications of the species groupings associated with our new taxa.
Cryptic species and undescribed diversity
In many instances for which multiple exemplars of a species were included in the phylogeny, the “species” was not resolved as monophyletic and/or showed substantial phylogenetic distinctiveness; for example, P. altamazonicus-diadematus, P. croceoinguinis, P. malkini, P. variabilis, P. taeniatus (sensu lato), P. ockendeni, P. librarius, P. martiae (sensu lato). P. zophus, and P. bogotensis-frater. We hypothesise that cryptic diversity or misidentification of specimens may be the explanation in most of these cases. We highlight several incidences of these two factors occurring within our phylogeny in Table S2 (see supplemental material online), along with suggested revisions to aid in inference of the true relationship and to draw attention to these vouchers. These groups require further investigation of additional specimens and molecular information to advance alpha taxonomy.
Misidentification can easily occur as comprehensive resources may not always be available and taxa often have conserved morphology. In Pristimantis, many species are very morphologically similar and there are challenges for identification without intrusive investigations (Hedges et al., Citation2008) or genetic analysis. Pristimantis has been understudied in terms of cryptic diversity compared with more charismatic tropical amphibians such as dendrobatids and treefrogs (Funk et al., Citation2012; Lötters, Schmitz, Reichle, Rödder, & Quennet, Citation2009; Vaz-Silva & Maciel, Citation2011). Species delimitation is particularly important in highly diverse yet threatened ecosystems such as Neotropical forests, and the current number of described species is undoubtedly a gross underestimation of the true diversity within Pristimantis.
Evolutionary patterns of diversification: Rate and distribution
We report four periods of increased phylogenetic branching since the origin of the Pristimantis. The first increase at ca. 24 MYA may correspond with the start of the Andes formation in the northern regions. The extreme geological activity that characterised this period drove speciation in some South American biota (Hoorn et al., Citation2010), and it has been previously suggested to explain this first burst of diversification in Pristimantis (Heinicke et al., Citation2007; Mendoza et al., Citation2015; Pinto-Sánchez et al., Citation2012). The other increases in the early to mid-Miocene, ca. 20.5, 16.8 and 15.7 MYA, may correspond to the extensive landscape changes in the era of the Pebas system (Hoorn et al., Citation2010). This vast wetland across Amazonia is thought to have driven the radiations of several taxa, including molluscs and ostracods (Wesselingh and Salo, Citation2006), plants (Antonelli et al., Citation2010), crocodilians and turtles (Hoorn et al., Citation2010), salamanders (Elmer, Bonett, Wake & Lougheed, Citation2013), and dendrobatid frogs (Santos et al., Citation2009), and may have directly or indirectly promoted diversification for several of the Pristimantis phylogenetic hESU clusters we have identified here.
Multiple lines of evidence in our analyses suggest that diversification rates within the genus Pristimantis were faster at the time of origin and slowed down towards the present. The LTT plots approximate the expected “decrease in diversification rates with early radiations” pattern of an upward sloping curve ending with a plateau (e.g. Couvreur, Forest & Baker, Citation2011). A decrease in diversification rates, in particular density-dependent ones, is a common pattern of evolutionary radiations (De-Silva et al., Citation2016; Etienne & Haegeman, Citation2012; Rabosky & Lovette, Citation2008b). This may represent density-dependent speciation in evolutionary radiations due to complex interaction between species traits and geographical range size, which in turn could facilitate spatial drivers of speciation on continents (Rabosky & Lovette, Citation2008a). The gamma statistic and the MCCR test we applied in the speciation rates analysis accommodate incomplete taxonomic sampling (Pybus & Harvey, Citation2000) but we acknowledge that these rate estimates may be affected by unequal and incomplete diversity throughout our tree (Cusimano & Renner, Citation2010). Our results here, in agreement with previous studies (Mendoza et al. Citation2015; Pinto-Sánchez et al. Citation2012), suggest that Pristimantis started diversifying in an era that is associated with Andean uplift and the formation of the Pebas system, which may have provided greater habitat complexity favouring isolation (Hoorn et al. Citation2010). As Pristimantis species are direct developers, this group may have been able to exploit this new opportunity to colonise and diversify in new areas. Hutter, Lambert & Wiens (Citation2017) looked at the relationship between elevation and species richness in the Andes, using Hyloidae as model system, and found strong association between rates of diversification and elevational change in Pristimantis, suggesting a close link between Andean uplift and Pristimantis diversity.
Evolutionary radiation processes have been suggested for several taxa as a result of Andean uplift (e.g. Ceccarelli et al., Citation2016; Sanín et al., Citation2016). We find support for an evolutionary radiation scenario for Pristimantis, with faster speciation rates at the beginning of the radiation and slowdowns towards the present. However, continental evolutionary radiations do not necessarily show these diversification patterns. For example, Schweizer, Hertwig & Seehausen (Citation2014) studied the radiation of Neotropical parrots and did not identify either a rapid diversification rate at the origin of the group nor a decrease in diversification rate towards the present, suggesting a lack of density-dependent speciation across the continent. Furthermore, the diversification rates of phenotypic evolution in neotropical ovenbirds (family: Furnariidae) suggested a different evolutionary history compared to the speciation rates, suggesting that morphological differentiation and speciation processes may not be tightly linked (Derryberry et al., Citation2011). Significant correlations between some phenotypic traits, such as skin morphology, and species richness were found for new world direct developing frogs (Gonzalez-Voyer et al., Citation2011). Further studies on differentiation in morphological traits within and between Pristimantis hESUs would be valuable for investigating whether the patterns in speciation and phylogenetic diversification processes correspond to morphological evolution in this group.
Species groups and diversity in Pristimantis
Species are traditionally considered as the fundamental units of evolution, with higher taxonomic levels (e.g. genera and families) functioning as more arbitrary categories in classifying the diversity of life (Barraclough & Humphreys, Citation2015). However, the complex interplay between microevolutionary and macroevolutionary diversity suggests that fine-scale processes within and among closely related species contribute to higher-level patterns (Humphreys & Barraclough Citation2014). For example, geographical isolation and ecological divergence promoting species diversity can also lead to the formation of discrete phylogenetic clusters such as hESUs. These hESUs are groups of taxa that share a phylogenetic history, phylogenetic rates and patterns of diversification. Our analysis recovered between 13 and 19 phylogenetic clusters within our broad phylogeny of Pristimantis, with the most evidence for the 14 hESUs we explored in detail (, ). We hypothesise that significant phylogenetic clusters that have undergone shared evolutionary histories and rates underlie the high extant diversity of Pristimantis. Simulations and empirical analyses suggest that incomplete sampling can either increase, decrease or not affect the inferred number of hESUs, dependant on the phylogenetic history and diversity of the specific clades (Humphreys and Barraclough, Citation2014); well-supported hESUs are generally less sensitive to these issues (Humphreys and Barraclough, Citation2014). Our sampling of Pristimantis is far from complete (approx. 30% of species), which may ultimately revise the number or complement of hESUs. Nonetheless, given the information at hand, we consider that these clusters represent evolutionarily informative phylogenetic species groupings, which would be a more accurate biological representation of taxon similarities than the phenetic species groupings established in the pre-molecular era.
The hESUs we report here for the first time do not relate to any previously described species group, apart from hESU A, which corresponds to the peruvianus species complex (as per Hedges et al., Citation2008). The issue of non-monophyly among current species groups within Pristimantis has been raised by many authors (e.g. Hedges et al., Citation2008; Mendoza et al., Citation2015; Padial et al., Citation2014; Pinto-Sánchez et al., Citation2012), with Heinicke et al. (Citation2015) defining this problem as “unwieldy”. After reclassifying the species groups based on further molecular work, Padial et al. (Citation2014) remarked that there is a lack of morphological synapomorphies for these groups, which could be a cause for concern given the increasing number of Pristimantis being described and great uncertainty around their placement. Thus, a critical evaluation of morphological characteristics within robustly statistically supported molecular groupings, such as our hESUs proposed here, is an important next step to clarify the many unresolved species groups, cryptic species, and evolutionary relationships in Pristimantis. Given the extremely high level of diversity in Pristimantis, combining phylogenetic history (as done here), biogeography/ecology, and alpha taxonomy will be critical to advancing our understanding of systematics for this group and evolutionary processes more generally. Our findings suggest that efforts at revising groups of taxa in Pristimantis would benefit from a comprehensive assessment of specimens and species within each hESU, including their genetic, ecological, morphological and geographic patterns, rather than based on any other grouping. Our study and many others show that approaches based on deep exploration of single localities, non-monophyletic species groups, or alpha taxonomy based on morphology (e.g. Heinicke et al. Citation2015), will provide important but scattered information across the genus Pristimantis. We propose that focusing on hESUs to work toward establishing new phylogenetic species groups would be an efficient way to inform both evolutionary process and taxonomic outcome simultaneously.
The number of species within the hESUs varied from three to 22. These are likely under sampled and do not necessarily reflect the full species complement in each group. There are representative samples from eleven countries in this dataset, but most samples come from just two countries (Colombia and Ecuador), with almost half of all specimens (n = 122) coming from Ecuador, including all the new DNA sequence data. Records of Pristimantis on the Global Biodiversity Information Facility (GBIF) show the same pattern, with 80% of all records from Ecuador and Colombia (accessed June 2017). These two countries have the highest species richness of the genus Pristimantis (Colombia = 220, Ecuador = 211 species; Frost, Citation2018); however, other South American countries also have high species richness but many fewer records. For example, Peru has 141 known species (Frost, Citation2018) but only 7% of the records on GBIF; in addition, Brazil has both low numbers of records on GBIF (4%) and low species richness (n = 30). More sampling is needed from across the full distribution of Pristimantis to capture the true diversity of this group.
Conclusions and further implications
We inferred a multi-gene phylogeny of the species-rich leaf litter frog genus Pristimantis, adding 50 new exemplars (representing eight known species, nine known but problematic [or unresolved] taxa, and two potentially new species) from Ecuador for a total for 260 individuals. Rates of diversification were faster early in Pristimantis, which had an origin ca. 28 MYA, and slowed approaching present times, which is a pattern usually associated with evolutionary radiations. Our study suggests high levels of cryptic species diversity and a lack of consistency in identification across a number of wide-ranging species. In an effort to better resolve taxonomic and evolutionary groupings, we identified 14 hESU clusters that have experienced independent and shared evolutionary histories, which could be interpreted as new monophyletic and evolutionarily informed species groups. To better understand the evolutionary history of this group, molecular studies should be conducted on more species, so that phylogenetic relationships, hESUs delimitation, and diversification rates are more clearly resolved. Further phylogenetic and population genetics research on ecological contextualised and co-distributed lineages of Neotropical amphibians is key to resolving the primary historical and contemporary drivers of diversification.
Supplemental data
Supplemental data for this article can be accessed at: http://dx.doi.org/10.1080/14772000.2018.1503202.
TableS3_rates_of_diversification20170921.docx
Download MS Word (47.3 KB)TableS2_specimens_to_revise.docx
Download MS Word (27.2 KB)2018_0024_tables1_full_voucher_list.docx
Download MS Word (110.9 KB)FigureS5_Rate_through_time_plots.pdf
Download PDF (79.7 KB)FigureS4_BAMM.pdf
Download PDF (211.1 KB)FigureS3_LTT.pdf
Download PDF (216.5 KB)FigureS2_hESUtimes.pdf
Download PDF (25.7 KB)FigureS1_Bayesian_tree95HPD.pdf
Download PDF (17.2 KB)Acknowledgements
We thank L. Coloma for facilitating sampling, identifying specimens, and support in the QCAZ museum; G. Vigle, R.O. de Sá, M. Bustamante, Z. Aguilar, S. Ron, S. Padilla, JC Santos, C. Proaño, and N. Acosta for specimens contributed to QCAZ; and F. Ayala-Varela, T. Sugahara, P. Menéndez, S. Padilla, and I. Tapia for assistance to KRE in the field. This project was funded by: NSERC PGS, Queen’s Field Travel grant, NERC NE/N003942/1, and University of Glasgow support to KRE, NSERC Discovery grant to SCL, and Amphibian Tree of Life with DCC. We thank A. Crawford and an anonymous reviewer for comments that improved the manuscript.
Disclosure statement
No potential conflict of interest was reported by the authors.
Related Research Data
References
- Antonelli, A., Quijada-Mascareñas, A., Crawford, A. J., Bates, J. M., Velazco, P. M., & Wüster, W. (2010). Molecular studies and phylogeography of amazonian tetrapods and their relation to geological and climatic models. In C. Hoorn & F. Wesselingh (Eds.), Amazonia: Landscape and species evolution (pp. 386–404). Oxford: Wiley-Blackwell Publishing Ltd.
- Barej, M. F., Penner, J., Schmitz, A., & Rödel, M.-O. (2015). Multiple genetic lineages challenge the monospecific status of the West African endemic frog family Odontobatrachidae. BioMed Central Evolutionary Biology, 15, 67. doi:10.1186/s12862-015-0346-9
- Barraclough, T. G., & Humphreys, A. M. (2015). The evolutionary reality of species and higher taxa in plants: A survey of post-modern opinion and evidence. New Phytologist, 207, 291–296. doi:10.1111/nph.13232
- Barrio-Amorós, C. L., Mesa, J., Brewer-Carías, C., & McDiarmid, R. W. (2010). A new Pristimantis (Anura, Terrarana, Strabomantidae) from Churi-tepui in the Chimanta massif, Venezuelan Guayana. Zootaxa, 2483, 35–44. doi:10.5281/zenodo.195474
- Castresana, J. (2000). Selection of conserved blocks from multiple alignments for their use in phylogenetic analysis. Molecular Biology and Evolution, 17, 540–552. doi:10.1093/oxfordjournals.molbev.a026334
- Castroviejo-Fisher, S., Guayasamin, J. M., Gonzalez-Voyer, A., & Vilà, C. (2014). Neotropical diversification seen through glassfrogs. Journal of Biogeography, 41, 66–80. doi:10.1111/jbi.12208
- Ceccarelli, F. S., Ojanguren-Affilastro, A. A., Ramírez, M. J., Ochoa, J. A., Mattoni, C. I., & Prendini, L. (2016). Andean uplift drives diversification of the bothriurid scorpion genus Brachistosternus. Journal of Biogeography, 43, 1942–1954. doi:10.1111/jbi.12760
- Couvreur, T. L., Forest, F., & Baker, W. J. (2011). Origin and global diversification patterns of tropical rain forests: Inferences from a complete genus-level phylogeny of palms. BioMed Central Biology, 9, 44. doi:10.1186/1741-7007-9-44
- Cracraft, J. (1985). Historical biogeography and patterns of differentiation within the South American Avifauna: Areas of endemism. Ornithological Monographs, 36, 49–84. doi:10.2307/40168278
- Crawford, A. J. (2003). Huge populations and old species of Costa Rican and Panamanian dirt frogs inferred from mitochondrial and nuclear gene sequences. Molecular Ecology, 12, 2525–2540. doi:10.1046/j.1365-294X.2003.01910.x
- Cusimano, N. & Renner, S. S. (2010). Slowdowns in diversification rates from real phylogenies may not be real. Systematic Biology, 59, 458–464. doi:10.1093/sysbio/syq032
- Derryberry, E. P., Claramunt, S., Derryberry, G., Chesser, R. T., Cracraft, J., Aleixo, A., … Brumfield, R. T. (2011). Lineage diversification and morphological evolution in a large-scale continental radiation: The Neotropical ovenbirds and woodcreepers (Aves: Furnariidae). Evolution, 65, 2973–2986. doi:10.1111/j.1558-5646.2011.01374.x
- De-Silva, D. L., Elias, M., Willmott, K., Mallet, J., & Day, J. J. (2016). Diversification of clearwing butterflies with the rise of the Andes. Journal of Biogeography, 43, 44–58. doi:10.1111/jbi.12611
- Drummond, A. J., Suchard, M. A., Xie, D., & Rambaut, A. (2012). Bayesian Phylogenetics with BEAUti and the BEAST 1.7. Molecular Biology and Evolution, 29, 1969–1973. doi:10.1093/molbev/mss075
- Duellman, W. E. (1999). Patterns of distribution of amphibians: A global perspective. Baltimore: Johns Hopkins University Press.
- Duellman, W. E. & Lehr, E. (2009). Terrestrial-breeding frogs (Strabomantidae) in Peru. Münster: Nature und Tier Verlag.
- Elmer, K. R., Bonett, R. M., Wake, D. B., & Lougheed, S. C. (2013). Early Miocene origin and cryptic diversification of South American salamanders. BioMed Central Evolutionary Biology, 13, 59. doi:10.1186/1471-2148-13-59
- Elmer, K. R., & Cannatella, D. C. (2008). Three new species of leaflitter frogs from the upper Amazon forests: Cryptic diversity within Pristimantis "ockendeni" (Anura: Strabomantidae) in Ecuador. Zootaxa, 1784, 11–38. doi:10.5281/zenodo.182422
- Elmer, K. R., Dávila, J. A., & Lougheed, S. C. (2007a). Applying new inter-individual approaches to assess fine-scale population genetic diversity in a neotropical frog, Eleutherodactylus ockendeni. Heredity, 99, 506–515. doi:10.1038/sj.hdy.6801025
- Elmer, K. R., Dávila, J. A., & Lougheed, S. C. (2007b). Cryptic diversity and deep divergence in an upper Amazonian leaflitter frog, Eleutherodactylus ockendeni. BioMed Central Evolutionary Biology, 7, 247. doi:10.1186/1471-2148-7-247
- Etienne, R. S., & Haegeman, B. (2012). A conceptual and statistical framework for adaptive radiations with a key role for diversity dependence. The American Naturalist, 180(4), E75–E89. doi:10.1086/667574
- Ezard, T., Fujisawa, T., & Barraclough, T. G. (2009). Splits: SPecies’ LImits by Threshold Statistics package, version 1.0-19. Retrieved from https://rdrr.io/rforge/splits/
- Fontaneto, D., Herniou, E. A., Boschetti, C., Caprioli, M., Melone, G., Ricci, C., & Barraclough, T. G. (2007). Independently evolving species in asexual bdelloid rotifers. Public Library of Science Biology, 5, e87. doi:10.1371/journal.pbio.0050087
- Fouquet, A., Gilles, A., Vences, M., Marty, C., Blanc, M., & Gemmell, N. J. (2007). Underestimation of species richness in neotropical frogs revealed by mtDNA analyses. Public Library of Science ONE, 2, e1109. doi:10.1371/journal.pone.0001109
- Frost, D. R. (2018). Amphibian Species of the World: An online reference. Retrieved from http://research.amnh.org/vz/herpetology/amphibia/ (accessed 11 September 2018).
- Fujisawa, T., & Barraclough, T. G. (2013). Delimiting species using single-locus data and the generalized mixed yule coalescent approach: a revised method and evaluation on simulated data sets. Systematic Biology, 62, 707–724. doi:10.1093/sysbio/syt033
- Funk, W. C., Caminer, M., & Ron, S. R. (2012). High levels of cryptic species diversity uncovered in Amazonian frogs. Proceedings. Biological Sciences, 279, 1806–14. doi:10.1098/rspb.2011.1653
- García-R, J. C., Crawford, A. J., Mendoza, Á. M., Ospina, O., Cardenas, H., & Castro, F. (2012). Comparative phylogeography of direct-developing frogs (Anura: Craugastoridae: Pristimantis) in the Southern Andes of Colombia. Public Library of Science ONE, 7, e46077. doi:10.1371/journal.pone.0046077
- Gentry, A. H. (1992). Tropical forest biodiversity: Distributional patterns and their conservational significance. Oikos, 63, 19. doi:10.2307/3545512
- Goebel, A. M., Donnelly, J. M., & Atz, M .E. (1999). PCR primers and amplification methods for 12S ribosomal DNA, the control region, cytochrome oxidase I, and cytochrome b in bufonids and other frogs, and an overview of PCR primers which have amplified DNA in amphibians successfully. Molecular Phylogenetics and Evolution, 11, 163–199. doi:10.1006/mpev.1998.0538
- Gonzalez-Voyer, A., Padial, J. M., Castroviejo-Fisher, S., De La Riva, I., & Vilà, C. (2011). Correlates of species richness in the largest Neotropical amphibian radiation. Journal of Evolutionary Biology, 24, 931–942. doi:10.1111/j.1420-9101.2011.02243.x
- Hedges, S.B., Duellman, W.E., & Heinicke, M.P. (2008) New World direct-developing frogs (Anura: Terrarana): Molecular phylogeny, classification, biogeography, and conservation. Zootaxa, 1737, 1–182. Retrived from http://www.hedgeslab.org/pubs/196.pdf (accessed 11 September 2018).
- Heinicke, M. P., Duellman, W. E., & Hedges, S. B. (2007). Major Caribbean and Central American frog faunas originated by ancient oceanic dispersal. Proceedings of the National Academy of Sciences of the United States of America, 104, 10092–7. doi:10.1073/pnas.0611051104
- Heinicke, M. P., Barrio-Amorós, C. L., & Hedges, S. B. (2015). Molecular and morphological data support recognition of a new genus of New World direct-developing frog (Anura: Terrarana) from an under-sampled region of South America. Zootaxa, 3986, 151–72. doi:10.11646/zootaxa.3986.2.1
- Hernandez, P., & Young, B. (2007). Synthesis. In B. Young (Ed.), Endemic species distributions on the east slope of the Andes in Peru and Bolivia. Arlington: NatureServe.
- Hoorn, C., Wesselingh, F. P., ter Steege, H., Bermudez, M. A., Mora, A., Sevink, J., … Antonelli, A. (2010). Amazonia through time: Andean uplift, climate change, landscape evolution, and biodiversity. Science, 330, 927–931. doi:10.1126/science.1194585
- Humphreys, A. M., & Barraclough, T. G. (2014). The evolutionary reality of higher taxa in mammals. Proceedings of the Royal Society B: Biological Sciences, 281, 20132750. doi:10.1098/rspb.2013.2750
- Humphreys, A. M., Rydin, C., Jønsson, K. A., Alsop, D., Callender-Crowe, L. M., & Barraclough, T. G. (2016). Detecting evolutionarily significant units above the species level using the generalised mixed Yule coalescent method. Methods in Ecology and Evolution, 7, 1366–1375. doi:10.1111/2041-210X.12603
- Hutter, C. R., & Guayasamin, J. M. (2015). Cryptic diversity concealed in the Andean cloud forests: Two new species of rainfrogs (Pristimantis) uncovered by molecular and bioacoustic data. Neotropical Biodiversity, 1, 36–59. doi:10.1080/23766808.2015.1100376
- Hutter, C. R., Guayasamin, J. M., & Wiens, J. J. (2013). Explaining Andean megadiversity: The evolutionary and ecological causes of glassfrog elevational richness patterns. Ecology Letters, 16, 1135–1144. doi:10.1111/ele.12148
- Hutter, C. R., Lambert, S. M., & Wiens, J. J. (2017). Rapid diversification and time explain amphibian richness at different scales in the tropical andes, earth’s most biodiverse hotspot. The American Naturalist, 190, 828–843. doi:10.1086/694319
- Jörger, K. M., Norenburg, J. L., Wilson, N. G., & Schrödl, M. (2012). Barcoding against a paradox? Combined molecular species delineations reveal multiple cryptic lineages in elusive meiofaunal sea slugs. BioMed Central Evolutionary Biology, 12, 245. doi:10.1186/1471-2148-12-245
- Kaiser, H., Barrio-Amorós, C. L., Rivas, G. A., Steinlein, C., Schmid, M., & Schmid, M. (2015). Five new species of Pristimantis (Anura: Strabomantidae) from the coastal cloud forest of the Península de Paria, Venezuela. Journal of Threatened Taxa, 7, 7047–7088. doi:10.11609/JoTT.o4197.7047-88
- Kattan, G. H., & Franco, P. (2004). Bird diversity along elevational gradients in the Andes of Colombia: Area and mass effects. Global Ecology and Biogeography, 13, 451–458. doi:10.1111/j.1466-822X.2004.00117.x
- Kearse, M., Moir, R., Wilson, A., Stones-Havas, S., Cheung, M., Sturrock, S., … Thierer, T. (2012). Geneious Basic: An integrated and extendable desktop software platform for the organization and analysis of sequence data. Bioinformatic, 28, 1647–1649. doi:10.1093/bioinformatics/bts199
- Lanfear, R., Calcott, B., Ho, S. Y. W., & Guindon, S. (2012). PartitionFinder: Combined selection of partitioning schemes and substitution models for phylogenetic analyses. Molecular Biology and Evolution, 29, 1695–1701. doi:10.1093/molbev/mss020
- Lötters, S., Schmitz, A., Reichle, S., Rödder, D., & Quennet, V. (2009). Another case of cryptic diversity in poison frogs (Dendrobatidae: Ameerega) description of a new species from Bolivia. Zootaxa, 2028, 20–30. doi:10.5281/zenodo.186228
- Lougheed, S. C., Gascon, C., Jones, D. A., Bogart, J. P., & Boag, P. T. (1999). Ridges and rivers: A test of competing hypotheses of Amazonian diversification using a dart-poison frog (Epipedobates femoralis). Proceedings of the Royal Society B. Biological Sciences, 266, 1829–1835. doi:10.1098/rspb.1999.0853
- Low, V. L., Takaoka, H., Pramual, P., Adler, P. H., Ya’cob, Z., Huang, Y.-T., … Sofian-Azirun, M. (2016). Delineating taxonomic boundaries in the largest species complex of black flies (Simuliidae) in the Oriental Region. Scientific Reports, 6, 20346. doi:10.1038/srep20346
- Loyola, R. D., Kubota, U., da Fonseca, G. A. B., & Lewinsohn, T. M. (2009). Key Neotropical ecoregions for conservation of terrestrial vertebrates. Biodiversity and Conservation, 18, 2017–2031. doi:10.1007/s10531-008-9570-6
- Lynch, J. D., & Duellman, W. E. (1997). Frogs of the genus Eleutherodactylus (Leptodactylidae) in western Ecuador : systematics, ecology, and biogeography. Kansas: Natural History Museum, University of Kansas.
- Massana, R., Castresana, J., Balagué, V., Guillou, L., Romari, K., Groisillier, A., … Pedrós-Alió, C. (2004). Phylogenetic and ecological analysis of novel marine stramenopiles. Applied and Environmental Microbiology, 70, 3528–34. doi:10.1128/AEM.70.6.3528-3534.2004
- Mendoza, Á. M., Ospina, O. E., Cárdenas-Henao, H., & García-R, J. C. (2015). A likelihood inference of historical biogeography in the world’s most diverse terrestrial vertebrate genus: Diversification of direct-developing frogs (Craugastoridae: Pristimantis) across the Neotropics. Molecular Phylogenetics and Evolution, 85, 50–58. doi:10.1016/j.ympev.2015.02.001
- Meyer, A. L. S., & Wiens, J. J. (2018). Estimating diversification rates for higher taxa: BAMM can give problematic estimates of rates and rate shifts. Evolution, 72, 39–53. doi:10.1111/evo.13378
- Monaghan, M. T., Wild, R., Elliot, M., Fujisawa, T., Balke, M., Inward, D. J. G., … Vogler, A. P. (2009). Accelerated species inventory on madagascar using coalescent-based models of species delineation. Systematic Biology, 58, 298–311. doi:10.1093/sysbio/syp027
- Muñoz-Ortiz, A., Velásquez-Álvarez, Á. A., Guarnizo, C. E., & Crawford, A. J. (2015). Of peaks and valleys: Testing the roles of orogeny and habitat heterogeneity in driving allopatry in mid-elevation frogs (Aromobatidae: Rheobates) of the northern Andes. Journal of Biogeography, 42, 193–205. doi:10.1111/jbi.12409
- Myers, N., Mittermeier, R. A., Mittermeier, C. G., da Fonseca, G. A. B., & Kent, J. (2000). Biodiversity hotspots for conservation priorities. Nature, 403, 853–858. doi:10.1038/35002501
- Noonan, B. P., & Wray, K. P. (2006). Neotropical diversification: The effects of a complex history on diversity within the poison frog genus Dendrobates. Journal of Biogeography, 33, 1007–1020. doi:10.1111/j.1365-2699.2006.01483.x
- Ortega-Andrade, H. M., Rojas-Soto, O. R., Valencia, J. H., Espinosa de los Monteros, A., Morrone, J. J., Ron, S. R., & Cannatella, D. C. (2015). Insights from integrative systematics reveal cryptic diversity in Pristimantis frogs (Anura: Craugastoridae) from the Upper Amazon Basin. Public Library of Science ONE, 10, e0143392. doi:10.1371/journal.pone.0143392
- Padial, J. M., Grant, T., & Frost, D. R. (2014). Molecular systematics of terraranas (Anura: Brachycephaloidea) with an assessment of the effects os alignment and optimality criteria. Zootaxa, 3825, 1–132. doi:10.11646/zootaxa.3825.1.1
- Paradis, E., Claude, J., & Strimmer, K. (2004). APE: Analysis of Phylogenetics and Evolution in R. Bioinformatics, 20, 289–290. doi:10.1093/bioinformatics/btg412
- Pinto-Sánchez, N. R., Ibáñez, R., Madriñán, S., Sanjur, O. I., Bermingham, E., & Crawford, A. J. (2012). The Great American Biotic Interchange in frogs: Multiple and early colonization of Central America by the South American genus Pristimantis (Anura: Craugastoridae). Molecular Phylogenetics and Evolution, 62, 954–972. doi:10.1016/j-ympev.2011.11.022
- Plummer, M., Best, N., Cowles, K., & Vines, K. (2006). CODA: Convergence diagnosis and output analysis for MCMC. R News, 6, 7–11. Retrived from https://cran.r-project.org/doc/Rnews/Rnews_2006-1.pdf (accessed 11 September 2018).
- Pons, J., Barraclough, T. G., Gomez-Zurita, J., Cardoso, A., Duran, D. P., Hazell, S., … Hedin, M. (2006). Sequence-based species delimitation for the DNA taxonomy of undescribed insects. Systematic Biology, 55, 595–609. doi:10.1080/10635150600852011
- Postaire, B., Magalon, H., Bourmaud, C. A. F., & Bruggemann, J. H. (2016). Molecular species delimitation methods and population genetics data reveal extensive lineage diversity and cryptic species in Aglaopheniidae (Hydrozoa). Molecular Phylogenetics and Evolution, 105, 36–49. doi:10.1016/j-ympev.2016.08.013
- Prohl, H., Ron, S. R., & Ryan, M. J. (2010). Ecological and genetic divergence between two lineages of Middle American tungara frogs Physalaemus (=Engystomops) pustulosus. BioMed Central Evolutionary Biology, 10, 146. doi:10.1186/1471-2148-10-146
- Pybus, O.G., & Harvey, P.H. (2000) Testing macro-evolutionary models using incomplete molecular phylogenies. Proceedings of the Royal Society B: Biological Sciences, 267, 2267–2272. doi:10.1098/rspb.2000.1278
- Rabosky, D. L. (2006). LASER: A maximum likelihood toolkit for detecting temporal shifts in diversification rates from molecular phylogenies. Evolutionary Bioinformatics Online, 2, 273–6. doi:10.1177/117693430600200024
- Rabosky, D. L. (2014). Automatic detection of key innovations, rate shifts, and diversity-dependence on phylogenetic trees. Public Library of Science ONE, 9, e89543. doi:10.1371/journal.pone.0089543
- Rabosky, D. L., Grundler, M., Anderson, C., Title, P., Shi, J. J., Brown, J. W., … Larson, J. G. (2014). BAMMtools: An R package for the analysis of evolutionary dynamics on phylogenetic trees. Methods in Ecology and Evolution, 5, 701–707. doi:10.1111/2041-210X.12199
- Rabosky, D. L., & Lovette, I. J. (2008a). Density-dependent diversification in North American wood warblers. Proceedings of the Royal Society B: Biological Sciences, 275, 2363–2371. doi:10.1098/rspb.2008.0630
- Rabosky, D. L., & Lovette, I. J. (2008b). Explosive evolutionary radiations: Decreasing speciation or increasing extinction through time? Evolution, 62, 1866–1875. doi:10.1111/j.1558-5646.2008.00409.x
- R Core Team. (2017). R: A language and environment for statistical computing. Vienna, Austria: R Foundation for Statistical Computing. Retrieved from http://www.r-project.org/ (accessed 11 September 2018).
- Sanín, M. J., Kissling, W. D., Bacon, C. D., Borchsenius, F., Galeano, G., Svenning, J.-C., … Pintaud, J.-C. (2016). The Neogene rise of the tropical Andes facilitated diversification of wax palms (Ceroxylon: Arecaceae) through geographical colonization and climatic niche separation. Botanical Journal of the Linnean Society, 182, 303–317. doi:10.1111/boj.12419
- Santos, J. C., Coloma, L. A., Summers, K., Caldwell, J. P., Ree, R., & Cannatella, D. C. (2009). Amazonian amphibian diversity is primarily derived from Late Miocene Andean lineages. Public Library of Science Biology, 7, e1000056. doi:10.1371/journal.pbio.1000056
- Schweizer, M., Hertwig, S. T., & Seehausen, O. (2014). Diversity versus disparity and the role of ecological opportunity in a continental bird radiation. Journal of Biogeography, 41, 1301–1312. doi:10.1111/jbi.12293
- Smith, B. T., McCormack, J. E., Cuervo, A. M., Hickerson, M. J., Aleixo, A., Cadena, C. D., … Brumfield, R. T. (2014). The drivers of tropical speciation. Nature, 515, 406–409. doi:10.1038/nature13687
- Smith, S. A., De Oca, A. N. M., Reeder, T. W., & Wiens, J. J. (2007). A phylogenetic perspective on elevational species richness patterns in middle American treefrogs: Why so few species in lowland tropical rainforests? Evolution, 61, 1188–1207. doi:10.1111/j.1558-5646.2007.00085.x
- Vaz-Silva, W., & Maciel, N. M. (2011). A new cryptic species of Ameerega (Anura: Dendrobatidae) from Brazilian Cerrado. Zootaxa, 2826, 57–68. doi:10.5281/zenodo.205958
- Wang, I. J., Crawford, A. J., & Bermingham, E. (2008). Phylogeography of the Pygmy Rain Frog (Pristimantis ridens) across the lowland wet forests of isthmian Central America. Molecular Phylogenetics and Evolution, 47, 992–1004. doi:10.1016/j.ympev.2008.02.021
- Wesselingh, F. P., & Salo, J. A. (2006). A Miocene perspective on the evolution of the Amazonian biota. Scripta Geologica, 133, 439–458.
- Wilson, E. O. (1988). The current state of biological diversity. In E. O. Wilson (Ed.), Biodiversity (pp. 3–18). Washington, DC: National Academies Press.
- Zeisset, I., & Beebee, T. J. C. (2008). Amphibian phylogeography: A model for understanding historical aspects of species distributions. Heredity, 101, 109–119. doi:10.1038/hdy.2008.30