
ABSTRACT
The Eastern enlargements of the EU increased the bloc’s dependency on Russian gas and contributed to a more cautious attitude towards these supplies. This paper assesses the Russian gas dependency of the 11 Central and East European new member states according to the ambition and execution of their national energy strategies and compares it to the gas dependency shifts in the old member states. Two composite indicators of gas dependency – one for supply and one for demand – based on nine individual indicators were used for this evaluation, calculated for 2004, 2019, and 2022. We find that the new member states mostly reduced gas dependency through supply-side measures, while old member states increased dependency through some combination of worsening supply- or demand-side situations until Russia’s 2022 invasion of Ukraine. The behaviour of member states was influenced by different perceptions of vulnerability and a varying sense of threat in the pre-war period. The old member states did not perceive their Russian gas dependency as a significant risk, whereas the new member states viewed this as a high-risk factor. New gas infrastructure capacity has contributed to diversification from Russia, but reducing gas demand did not receive much attention before the invasion.
1. Introduction
Energy policy and security of gas supply have been key issues in the European Union since Russia’s 2022 invasion of Ukraine and the ensuing energy crisis, but they have been a priority with varying intensity since the first Eastern enlargement in 2004. When 11 former socialist Central and East European (CEE) countries, all highly dependent on Russian gas, joined the EU in three rounds (2004, 2007, and 2013Footnote1), the energy acquis became an obligatory part of their legal systems. Concurrently, the new member states (NMSs)Footnote2 have had the opportunity to exert influence on the shaping of developments in energy policy, energy security, and – inextricably linked to these – climate policy priorities.
The Second Gas Directive of 2003 was to be implemented right after the 2004 accession. The EU energy law focused on its liberalisation agenda, which aimed to strengthen the availability and affordability dimensions of security of supply through competition. The NMSs struggled with the restructuring of their vertically integrated gas sectors and faced financial hardship. Their approach to privatisation was cautious since the gas industry was considered a strategic asset and avoiding Russian control was a common priority. Meanwhile, the Russian strategy targeted ownership in the downstream and transmission assets of the gas sector (Boussena and Locatelli Citation2013).
Despite the undoubted success of the liberalisation agenda in integrating European gas markets and reducing price differentials within the bloc, the common denominator for NMS energy policy was the awareness that Russian gas dependency posed a serious risk, and they lobbied for a common EU security of gas supply framework (Mišík Citation2016). The 13-day cut-off in gas deliveries across Ukraine in 2009 and the geopolitical turn of the 2010s – primarily Russia’s annexation of Crimea, its involvement in the war in Eastern Ukraine, the impositions of sweeping EU sanctions on Russia (and vice versa), and thus a significant cooling in relations between Russia and the West (Haukkala Citation2015) – convinced the EU to adopt a European energy security strategy (European Commission Citation2014) and important pieces of legislation addressing the security of supply issue, most prominently the Trans-European Networks for Energy (TEN-E) Regulation of 2013 (European Commission Citation2013). Since 2014, there have been common EU security of supply objectives to increase the resilience of the gas systems and diversify gas supplies, as well as a general agreement to coordinate the external energy policy (European Commission Citation2014). Still, policy choices at the national level vary widely, depending on the individual characteristics of the gas system. Member states’ energy policy objectives are based on the principle of sovereignty, which allows each of them to decide on its fuel mix and bilateral relations with external actors. This can lead to controversial projects such as the Nord Stream 1 gas pipeline under the Baltic Sea, which, until 2022, brought Russian gas to Germany without passing through Belarus or Ukraine (Aalto and Dicle Citation2014), and Nord Stream 2, which was completed in 2021, but has not been put into operation.
In the 2010s, the share of Russian gas in EU gas consumption increased as EU gas production fell and only few competitive alternatives emerged. Russia’s share in the EU28 gas consumption increased from 25% in 2004 to 35% in 2019. In 2019, the EU’s gas imports from Russia accounted for around 150 billion cubic metres (bcm) of the EU’s 401 bcm of gas consumption (Eurostat Citation2024a, Citation2024b). Russia was positioned as the primary source of imports for an increasingly import-dependent EU,Footnote3 with the European Union representing Russia’s most important natural gas buyer.
From 2019 onwards, the European Commission’s agenda was dominated by the sustainability dimension of security of supply, with a strong emphasis on domestically produced renewable energy. Decarbonisation and climate-neutrality ambitions, leading to uncertain future demand for natural gas, posed a threat to the position of gas suppliers. Russia has been planning for decades but has failed to invest adequately in pipelines linking Russian gas fields to the Chinese market and in gas liquefaction terminals to ship the gas as liquefied natural gas (LNG). Prior to 2022, much of Russia’s pipeline investment had been directed towards the EU market, with the objective of establishing alternative routes to those that run through Ukraine. Yet, the revision of the TEN-E legislation to adopt a green agenda excluded any financial support for natural gas projects designed to enhance security of gas supply. In a decarbonised future, the greater emphasis on renewables is expected to increase the resilience of the fossil-poor EU against its external suppliers (European Commission Citation2024a).
Since 2019, two unexpected crises – first, the COVID-19 and then, the Russian invasion of Ukraine – have hit the EU gas markets. In the 2022/2023 heating season, the risk preparedness of the EU and its member states was tested in the largest real-life energy security stress test. However, Russia’s national gas champion, Gazprom started withholding supplies as early as 2021 (Takácsné Tóth, Kotek, and Selei Citation2021). By June 2024, Russia’s 2022 invasion of Ukraine had led to 14 packages of EU sanctions against Russia, none of which prohibited imports of Russian natural gas (Council Citation2024). In contrast, Russia used its gas weapon when it cut supplies to countries that condemned Russian aggression and supported Ukraine’s defensive efforts, resulting in a drop in Russian pipeline gas exports to some 65 bcm in 2022 and around 27 bcm in 2023.Footnote4 The supply shortage led to unprecedentedly high European wholesale gas prices in 2022 and consequently to demand falling by around 15%, mainly in the industrial sector, due to temporary shutdowns and household gas conservation and switching (McWilliams, Sgaravatti, and Zachmann Citation2024). The most adverse outcome did not materialise, as there was no necessity for any curtailments. Conversely, the fall in Russian exports to the EU did not immediately hit Gazprom and the Russian federal budget, as the record-high gas prices in 2022 compensated for the lower quantities, but the impact was already evident in 2023 as prices reverted to their previous levels (Yermakov Citation2024).
This article forms part of a special issue that is dedicated to the 20th anniversary of the EU accession of 10 new member states in 2004. As part of this volume, this article focuses on the natural gas market integration of the NMSs, investigating how the accession impacted and shaped the common EU policy and the national policy-forming of the newcomers. Specifically, this article aims to assess the changing dependency on Russian gas in the new and old member states (OMSs) between 2004 and 2022. This investigation is based on three research questions: (i) how the NMSs perceived their exposure to Russia as a risk at the time of their accession, (ii) how the NMSs prepared their natural gas system for security of supply shocks compared to the OMSs, and (iii) to what extent the NMSs achieved the desired level of gas security during the two decades of EU membership. These research questions are captured in two hypotheses. Firstly, it is hypothesised that the period following EU accession can be divided into two distinct eras in terms of measures to address Russian gas dependency: the pre-war and war periods. It is postulated that there is a divergence between the evolution of supply and demand dependency of new and old member states between 2004 and 2021. In the pre-war period, the OMSs were more reluctant to follow the EU’s strategic documents, which advised member states to reduce Russian gas dependency (European Commission Citation2014, Citation2015). However, the new direction since 2022 has been consistent with the previous strategic trajectory of the NMSs. The second hypothesis relates more to country-level strategies: it posits that countries with a higher share of natural gas in their fuel mix in 2004 planned to invest in gas infrastructure and were reluctant to increase their gas consumption beyond a certain level. Conversely, countries where gas played a minor role were less concerned about their gas supply security.
We investigate these inquires through the application of the dependency framework to the EU gas market. The actors identified and analysed are the EU as a bloc vis-à-vis Russia, and the individual member states vis-à-vis Russia, but a direct trade relationship only exists between the latter actors. The individual member states are the key actors in this context, as security-related decisions and measures are implemented at the member state level. The asymmetric nature of the interdependence between Russia and the EU member states stemmed from the assessment that if Russian supplies to the EU were halted, Russia could sustain itself for a considerable length of time without such revenue streams and markets, but its EU consumers, particularly the NMSs, could face significant challenges in the short term. Consequently, our analysis is centred on the natural gas systems and the energy strategies of the NMSs, with a comparison being made to the OMSs of the EU. This article does not undertake a comprehensive analysis of Russia’s gas export strategy, which ultimately employed natural gas as an energy weapon against the EU in 2022–2023. Instead, it reflects on Russia’s strategy based on the actual outcome of the real-world test.
The article employs an innovative methodology that draws upon both quantitative and qualitative research techniques. As a quantitative analytical tool to assess the exposure of EU member states to Russian natural gas, it proposes a novel indicator-based approach that focuses on one concrete dimension of security of supply – physical availability. Specifically, it relies on composite indicators that capture both the natural gas supply dependency (through supply-side indicators) and the role of natural gas in the energy demand (through demand-side indicators). This particular grouping of indicators is not seen in the literature, nor is there a precedent for such a long-term examination of the phenomena under study, with the new and old member states treated separately. The qualitative assessment includes the interpretation of the indicators based on the national energy strategy documents available closest to 2004, regardless of the country’s accession date. Consequently, the phenomena measured by indicators are linked to strategic plans, which are also quantified and then visualised in conjunction with the indicators. The visualisation technique allows for tracking not only changes in dependencies but also policy shifts, most importantly to assess the implemented energy policies from a detailed and dynamic perspective. Such an assessment is prompted not only by the necessity of a comprehensive evaluation of the two decades of EU membership of CEE countries, but also by the unprecedented adjustments in the EU gas market resulting from Russia’s 2022 invasion of Ukraine.
The remainder of the article is structured as follows. Section 2 provides a succinct overview of the literature on energy dependence, gas as a weapon, and security indicators. Section 3 describes the research design and methods used for data collection and analysis. Section 4 presents the results of the assessment. Section 5 discusses the supply- and demand-side measures taken by the NMSs and the EU’s role in these developments. Conclusions are formulated in Section 6.
2. Literature review
Energy dependence is a natural phenomenon, as is the interdependence between consumers and suppliers, which can manifest either symmetrically or asymmetrically. The perception of dependence is crucial in assessing its nature, whether viewed as a mutually beneficial interdependence (positive dependence) or as an unequal and threatening dependence (negative dependence). A low energy dependence ratio, coupled with antagonistic relations with the exporter, may be perceived as a serious threat to national security. Conversely, a higher ratio, alongside cordial relations with the exporting country, may not be seen as threatening (Palonkorpi Citation2006). Dependence can be managed in a number of ways. One radical approach involves achieving independence from energy imports, i.e. complete self-sufficiency. However, this aim can promote suboptimal policy choices (Bazilian, Sovacool, and Miller Citation2013). Another approach is a reduction in the use of the energy source in question. One potential solution is to diversify import sources in order to reduce reliance on unstable and unfriendly countries. This would ensure that no country could effectively manipulate markets against national interests (Branko Citation2012). In the 2010s, the interdependence of natural gas trade relations between the EU and Russia grew to such an extent that it could be perceived by either party as an asymmetric interdependence that was not to its advantage (Judge, Maltby, and Sharples Citation2016). The intensification of discussion on the geopoliticisation of energy and the securitisation of natural gas (Wigell and Vihma Citation2016) can be attributed to the fact that the threat perception from security and foreign policy spilled over into the sphere of energy policy (Casier Citation2016).
LaBelle (Citation2023) posits that the global interdependency theory, rooted in the oil crisis, extended into the European gas sector to promote interdependency between European countries and Russia. However, within the European gas trade, energy as a weapon did not proliferate; instead, a heightened level of dependency emerged between Russia and the EU member states. It was only in 2022 that Russia weaponised the gas trade, prompting the EU to similarly weaponise its energy market. The experience of the failure of gas interdependency led to a cautious approach to future supply dependencies in the critical row materials that are creating strategic vulnerabilities for the EU. To mitigate this risk, Righetti and Vasileios (Citation2024) propose the necessity of bilateral trade combined with an international multilateral forum and the importance of coordinated mapping and monitoring of resources, markets, and technologies. This is deemed essential, even though the optimal policy actions may vary based on each member state’s unique experience, preferences, and resource potential. Consequently, the energy-related resource dependency represents a phenomenon that must be addressed at the level of the member state, while coordination and monitoring of the EU-level dependencies and certain EU-level policy formation may also be necessary. This article contributes to the existing body of literature on dependence theory by applying a novel indicator-based methodology as a case study on the gas supply dependency of the EU member states and their resilience to the Russian gas weapon, which may lead to concrete policy lessons for future supply dependencies in resource-scarce regions like the EU.
The gas weapon was considered to be used to influence either gas-related or non-gas bilateral issues between Russia and the country in question. In the 2000s, proponents of this political argument frequently invoked Russian President Putin’s February 2003 address at the tenth anniversary of the establishment of Gazprom, during which he asserted that Gazprom was a powerful political and economic lever of influence over the rest of the world (Kupchinsky Citation2004). These scholars often referenced Larsson (Citation2006), who identified over 40 politically motivated oil and gas cut-offs in the countries of the former Soviet Union between 1991 and 2004. However, Russian-backed undersea pipelines aimed at bypassing post-Soviet transit states, particularly Nord Stream, constituted the primary source of conflict in the 2000s and 2010s due to suspected Russian geopolitical considerations (Vatansever Citation2017).
In contrast, scholars who espoused the commercial argument posited that Gazprom’s commercial interests trumped political considerations. Pirani (Citation2012) argued that Russia’s activities on export markets were primarily geared towards reinforcing Gazprom’s commercial position. Stern (Citation2015) and Yafimava (Citation2015) claimed that Russia aimed to extract maximum revenue through discriminatory monopoly practices rather than political concessions. Prior to 2022, Russia did not engage in a direct ‘gas war’ in the non-Baltic former Soviet Union, except for the incident with Estonia in 1993 – a one-day, unsuccessful gas cut intended to change Estonia’s citizenship policies (Grigas Citation2012). Nevertheless, between the summer of 2014 and March 2015, Gazprom deliberately failed to meet the daily gas volumes requested by numerous European buyers. This was purportedly at the behest of the Russian president with the commercial objective of curtailing reverse flow gas to Ukraine from Europe and thus compelling Ukraine to purchase more Russian gas. It might also have been a means of supporting falling European hub prices. In addition, the European Commission’s Directorate-General for Competition corroborated the assertion that Gazprom was leveraging its dominant market position by making gas supplies conditional on obtaining unrelated commitments regarding gas transport infrastructure in Bulgaria and Poland (Stern Citation2015).
A nuanced understanding of security of supply and dependency necessitates a multidisciplinary approach to assess the threat perceptions, physical energy relationships, and system specifics. Indicator-based assessment is well suited to this purpose, with its main advantage being that it can quantify changes of a certain country or region over time. Ang, Choong, and Ng (Citation2015) reviewed over 100 energy security indicators and found that there is no single definition or universal indicator for energy security. Instead, definitions of energy security are contextual and dynamic in nature. The authors note that weighting indicators and constructing composite indices can be arbitrary and raise several data availability issues, but are nevertheless useful for cross-country comparisons and tracking developments over time. Augutis et al. (Citation2020) constructed a composite indicator to demonstrate the evolution of energy security in the Baltic states between 2008 and 2016. They found that during this period, the security of energy supply improved in the Baltics. Le Coq and Paltseva (Citation2009) compiled a composite indicator of energy supply risk for the EU for gas, oil, and coal. They considered political, market concentration, and supply risks related to the distance from the energy source based on 2006 Eurostat data and assigned the EU countries into three risk categories: (1) high risk with high use of gas, low indigenous production, and typically no alternative to a single supplier (Austria, Bulgaria, Czechia, Hungary, Latvia, Lithuania, Romania,Footnote5 and Slovakia), (2) medium risk with better diversified gas imports and/or less reliance on gas (Estonia, Finland, Germany, Greece, Italy, Ireland, Poland, Portugal, Slovenia, and Spain), and (3) low risk with diversified supply portfolio or low level of reliance on gas (Belgium, Denmark, France, the Netherlands, Sweden, and the UK). The NMSs tended to be in the high and medium risk categories. Rodríguez-Fernández, Carvajal, and Ruiz-Gómez (Citation2020) developed a composite index, WESI, to rank and compare the security of supply development of EU member states between 2005 and 2010. The results indicated that the EU’s overall energy security had slightly worsened over this time period, and that only a few member states had been able to improve their positions based on WESI, despite the lessons learned from the 2006 and 2009 gas transit crises between Russia and Ukraine. The authors subsequently updated their analysis to extend it to 2015, adopting a more gas market-focused approach (Rodríguez-Fernández, Carvajal, and Fernández de Tejada Citation2022). System-level modelling applied by the European Network of Transmission System Operators for Gas (ENTSOG) concluded that the CEE countries cannot withstand a prolonged supply disruption of Russian gas,Footnote6 even though they have sufficient storage capacities as a percentage of annual gas consumption to provide flexibility to the system.
Although individual country case studies offer detailed insights into the threat perceptions, policy formation, and diverse range of measures employed by individual member states regarding energy security and dependency (Jääskeläinen et al. Citation2018; Pavlović, Banovac, and Vištica Citation2018), they do not facilitate a consistent comparison of countries’ behaviours across the analysed time period. Conversely, energy security and dependency rankings at the EU level (J. De Jong et al. Citation2006; Le Coq and Paltseva Citation2009; Rodríguez-Fernández, Carvajal, and Ruiz-Gómez Citation2022, Citation2020) or globally (Cohen, Joutz, and Loungani Citation2011; Ye et al. Citation2021; Ziemba Citation2022) are unable to fully account for the significance of individual country decisions that underpin the aggregated data. Some studies address specific European regions, such as the countries of the Three Seas Initiative (Tutak and Brodny Citation2022), Central and Eastern Europe (Jonek-Kowalska Citation2022; Weiner Citation2016), the Baltics (Augutis et al. Citation2020; Grigas Citation2012), or the Danube Region (Takácsné Tóth et al. Citation2022), and provide comparative assessments of the individual countries and rankings of their energy security. However, the papers in the above categories are based on data prior to the 2022 energy crisis, and many of them do not focus on gas but consider other security aspects and provide aggregate measures pooling energy types. Additionally, their regional coverage does not always encompass the entire EU28. Most importantly, they do not allow for the assessment of implemented energy policies from a detailed or dynamic perspective. Therefore, there is a paucity of studies comparing old and new member states and their shift in security of gas supply and gas dependency indices in the context of the latest energy crisis. This study aims to fill this gap by combining a qualitative assessment of EU-level policy formation with national-level strategy analysis and a detailed country-level indicator analysis over a longer time horizon. The basic idea of our analysis follows from an assessment of the Russian gas phase-out potential of the so-called Danube Region. In doing so, Takácsné Tóth et al. (Citation2022) applied a supply- and demand-side composite indicator system to compare Russian gas dependency of the members of this macro-region (encompassing selected new and old EU members and non-EU states).
3. Methodology
To facilitate a comparison of country developments, we applied a three-step approach. Firstly, we selected nine indicators – four from the demand and five from the supply side – to describe the natural gas dependency of individual countries. For consistency reasons, the input data were obtained from reliable, publicly available datasets: Eurostat, the Agency for the Cooperation of Energy Regulators (ACER), the Council of European Energy Regulators (CEER), and ENTSOG (). The demand-side indicators include: (1) the share of gas in the energy mix, (2) the share of gas in the power and heat sector, (3) the share of gas in the industrial sector, and (4) the share of gas in the residential and services (building) sector. The supply-side indicators contain: (1) the share of Russian gas in total gas use, (2) gas production capacity as a percentage of total gas use, (3) pipeline entry capacities as a percentage of total gas use, (4) the share of LNG regasification capacity as a percentage of total gas use, and (5) the share of withdrawal capacity of storage as a percentage of total gas use. In accordance with the categorisation developed by Ang, Choong, and Ng (Citation2015), our composite index encompasses three principal topics: energy availability, infrastructure, and energy efficiency. We calculate the indicators for 2004, 2019, and 2022. 2004 marks the EU’s first Eastern enlargement, while 2019 represents the last full year before two major crisis events: the COVID-19 pandemic and Russia’s war in Ukraine, the latter of which profoundly altered the energy strategies of the NMSs and the EU as a whole. The 2022 data are the most recent available at the time of writing this article, and they already reflect these changes.
Table 1. Definitions of indicators and thresholds for indicator-based assessment.
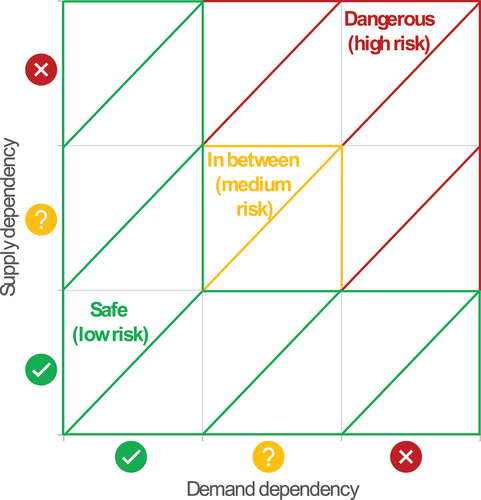
Secondly, we construct two composite indicators: one for the supply dependency and one for the demand dependency. A scoring system is employed to evaluate whether the calculated indicator of step one is in the range that can be considered ‘safe’ from a security of supply perspective, is in a ‘dangerous’ range, where exposure to Russian gas is certainly too high, or is ‘in between’, where other factors also can shape the final judgement. The thresholds are defined using expert judgement based on general principles. For example, we interpret the share of Russian gas in the total gas supply as a market concentration indicator. Below 25% can be considered ‘safe’, but a share over 50% is exposed to ‘dangerously high’ market power. For the other demand- and supply-side indicators, relative positions compared to the EU average were used to define the thresholds, summarised in . Returning to the scoring system, we assign 3 points for ‘dangerous’ indicators, 2 for ‘in between’, and 0 for ‘safe’. Landlocked countries with no chance to build an LNG terminal on their territory receive 2 points for the LNG indicator. As a final step, points for the demand- and supply-side composite indicators are aggregated and equally weighted. As such, the indicators cover the different aspects of dependencies and are all equally important. The higher the score, the more dependent the country on the natural gas supply from Russia. The values of the two composite indicators enable a graphical representation of country-level supply- and demand-side dependencies. Dangerous, medium-risk, and safe zones are illustrated in .
Figure 1. Different risk zones in the assessment of composite indicators.
In the third step, the results are compared to member state goals described in their strategic documents around the time of the 2004 EU enlargement.Footnote7 We were interested to find if the strategies address any of the supply- or demand-side indicators and if they formulate measures to address them. The scoring is similar to the system used for the indicators: measures that explicitly target the reduction of Russian gas dependency are worth 0 points; if there are measures that directly increase the dependency, then 3 points are given; and when no measure is proposed, or stagnation is envisaged, we assign the score 2. After these points are aggregated, they are used to visualise the target point of the strategy along the same coordinate as the indicators. This sets the envisaged ‘target’ dependency of each country according to their energy strategies dating from around the time of the 2004 accession.Footnote8
4. Results
4.1. Results of the indicator-based quantitative assessment
Comparing the gas dependency indicators for 2004 reveals that the share of gas in the energy mix was higher in the OMSs (with an average of 24.8%) than in the NMSs (22.2%).Footnote9 The share of Russian gas in the total gas use, however, was only 18.8% in the OMSs but 59.3% in the NMSs. Some NMSs – the three Baltic states, Slovakia, and Bulgaria – were 100% dependent on Russian gas. The share of gas use in the industrial segment was similar in the new and old member states but somewhat higher in OMS electricity production and the heating of buildings. In terms of pipeline capacity, the NMSs seem to have been better equipped, but this is misleading because of the large transit pipelines coming from Russia and crossing their territories. There are two completely isolated markets that were supplied by a single pipeline in 2004: one OMS, Finland, and one NMS, Croatia. In terms of domestic gas production, the OMSs were in a much better position, covering 49.6% of their own consumption. For the NMSs, this only covers 31.2%. The NMSs are much better supplied with storage facilities, reaching 53.6% of daily peak gas need, compared to only 27.8% for the OMSs. In 2004, there were no LNG terminals in the NMSs, while the UK, Portugal, France, Greece, and Belgium already had terminal capacity for 18.6% of the daily peak gas demand.
When comparing the visual representation of the 2004 composite indicators for the new and old member states (), a negative correlation is observed between gas supply and demand dependency. Supply-dependent countries kept their gas demand dependency low to compensate for their high security of supply exposure. In 2004, the OMSs had two outliers, Sweden and Italy. Sweden kept the use of gas in the fuel mix very low, and therefore did not depend on any country for security of supply. Italy opted for a high share of gas in all consumer sectors despite its heavy dependence on supply. Based on the composite indicators, we can distinguish groups of countries with similar exposures. FinlandFootnote10 and Greece are both on the geographical periphery of the EU, isolated from the integrated EU gas system; therefore, keeping gas demand dependency low. Northwest European gas producing countries developed larger domestic gas markets, and their neighbours – Ireland, Belgium, and Austria – grew alongside. The Southwest European group, comprising France, Spain, and Portugal, is somewhere in the middle, with gas demand and supply dependency kept at a more cautious level than countries with substantial own production capacities.
Figure 2. Illustration of gas dependency with composite indicators for new (left) and old (right) member states for 2004.
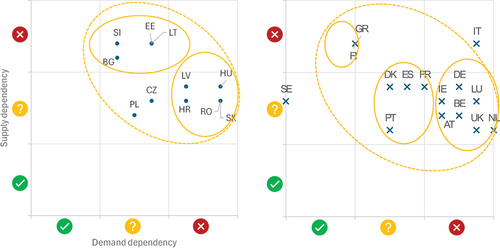
Among the NMSs, the group of Estonia, Bulgaria, Latvia, and Slovenia is most gas supply dependent, while the rest are more gas demand dependent. The outlier is Poland (and to some extent Czechia), which did not develop a gas market and kept gas dependency lower than other countries (Weiner Citation2021). Most new and old member states were dangerously demand dependent in 2004, with a supply dependency composite indicator in the mid-range. Dangerous gas supply dependency is coupled with safe gas demand dependency in the OMSs, while NMSs are very much exposed to supply dependency and shift their demand dependency into the mid-range. The indicators confirm that the 2004 situation called for measures to mitigate the dependency risks for both groups but especially the NMSs. Our assessment of the security risk in 2004 aligns closely with the conclusions of Le Coq and Paltseva (Citation2009).
The change in the composite supply and demand indicators for new and old member states is shown in . Additionally, depicts the evolution of indicators for each member state from 2004 through 2019 to 2022, with the NMSs indicating the targets set out in the strategic documents. The downward and leftward shifts of the points between the selected years signal an improvement in the supply and demand dependency for individual member states. Conversely, the shift of points upwards and to the right is indicative of member states moving towards larger supply and demand dependency.
Figure 3. Illustration of changing Russian gas dependency in new member states from 2004 to 2019 and 2022, based on the composite indicators.
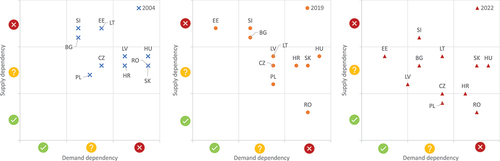
Figure 4. Illustration of changing Russian gas dependency in old member states from 2004 to 2019 and 2022, based on the composite indicators.
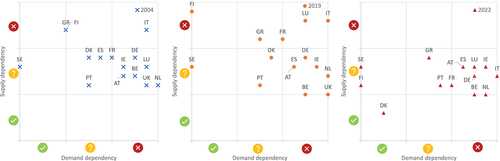
Figure 5. Illustration of changing Russian gas dependency in the EU member states with composite dependency indicator pathways from 2004 to 2019 and 2022, alongside targets set in energy strategies of the new member states, country by country.
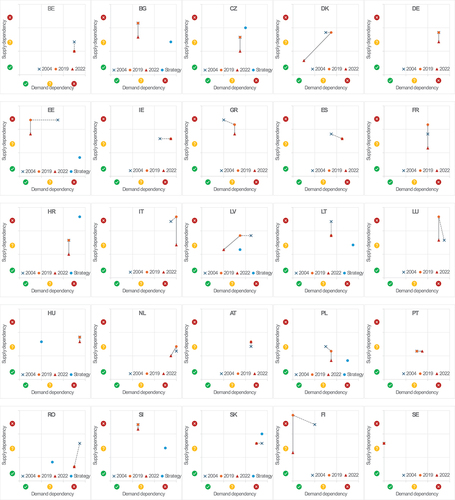
illustrates a clear tendency for points to move predominantly downwards from 2004 to 2022, suggesting that most NMSs – Bulgaria, Croatia, Czechia, Estonia, Hungary, Latvia, Lithuania, Poland, Romania, and Slovenia – implemented supply-side measures. Three countries managed to reduce their demand dependency: Estonia largely eliminated gas from its energy mix, while Latvia, Romania, and Slovakia decreased the share of gas in their energy mix. Poland’s demand dependency increased slightly for decarbonisation purposes, while its supply dependency dropped slightly, preserving its position among the safest NMSs. With the exception of Poland, all NMSs consumed less gas in 2019 than in 2004 (Eurostat Citation2024c). A review of the situation in 2022 reveals that the NMSs were able to respond promptly to the challenge posed by Russia’s energy weapon. With the exception of Hungary, Slovakia, and Slovenia, all NMSs moved out of the dangerous and risky zones, with the majority of them, including Croatia, Czechia, Estonia, Latvia, Poland, and Romania, entering the very low-risk zone.
shows that from 2004 to 2019, most points moved either up, indicating a worsening supply dependency (Austria, France, Italy, Luxembourg, and the Netherlands), or to the right, referring to an increasing demand dependency (Denmark, Greece, Italy, and the UK). Italy appears to be the only OMS where both the gas supply and demand dependency increased between 2004 and 2019. At the other extreme is Finland, where both supply- and demand-side measures were introduced, allowing the country to largely phase out gas from its energy mix by 2022. Sweden’s position remained unchanged until 2022. In response to the 2022 crisis, the OMSs have shifted towards the safe and medium-risk categories. None of them remain dangerously supply dependent, but six of them are still dangerously demand dependent.
The results of the indicator-based assessment suggest that while NMSs were breaking free from Russian gas dependency from 2004, OMSs were moving in the opposite direction towards dangerous gas dependency during the pre-war period as domestic gas reserves began declining. Moreover, the 2022 energy crisis provided a stronger impetus for reducing dependence on Russian gas than the policies pursued from 2004 to 2019.
4.2. Results of the indicator-based qualitative document analysis
This section determines the extent to which the developments in NMSs were driven by strategic planning. The national energy strategies that emerged at the time of the 2004 EU accession date exhibit considerable variation in terms of quality, content, detail, and structure, but still offer valuable insights into how these countries perceived strategic risks at the time and outlining the key issues and objectives that were to be addressed in the short, medium, and long term. The results, however, depend largely on when the strategy was published: in 2000 for Slovakia; 2002 for Bulgaria, Croatia, and Lithuania; 2004 for Czechia, Estonia, and Slovenia; 2005 for Poland; 2007 for Romania; and 2008 for Hungary and Latvia.
Around the 2004 EU accession date, most energy strategies outlined a promising outlook for natural gas with an increasing role in the energy supply mix. This growth was envisaged in the power and heat sectors, while industrial gas consumption was rarely mentioned. Some strategies explicitly highlighted the high risk of Russian gas dependency and set thresholds on the gas consumption in certain sectors. The popularity of gas was due to its lower environmental impact compared to coal (e.g. in Poland), oil shale (in Estonia), or liquid fossil fuels (e.g. in Slovenia), flexibility/dispatchability (with its fast start-up and load-changing capabilities), higher efficiency (especially that of the combined heat and power, which enjoyed popularity), and the available gas transmission system. However, reservations were also expressed, with some explicitly highlighted the risk of Russian gas dependency and setting gas consumption caps in certain sectors. The Latvian energy strategy stated that the use of gas for electricity generation had reached a point where the supply structure was at risk. The future role of gas in the household heating sector was either not addressed (as in the cases of Czechia, Latvia, Poland, and Romania) or predicted to grow.
Not surprisingly, none of the adopted NMS energy strategies anticipated an increasing share of Russian gas. The three Baltic states, Romania, and Slovakia highlighted the risk associated with high dependency on a single gas supplier but did not single out Russian shipments. In the Estonian, Lithuanian, Hungarian, and Polish cases, Russian-backed pipeline projects appeared alongside non-Russian diversification projects. The Slovenian energy strategy also referred to the possibility of a new Russian gas transport corridor to Italy through Hungary and Slovenia. NMSs either planned to expand own storage capacity (Hungary, Poland, Romania, and Slovakia); were considering doing so in their own country (Croatia, Latvia, and Lithuania) or by participating in a project in another country (Estonia in Latvia); set some kind of obligation (Czechia and Slovenia); or stressed the need for leasing capacity in neighbouring countries (Lithuania in Latvia and Slovenia in unspecified countries). The energy strategies of coastal Estonia, Bulgaria, Croatia, Lithuania, and Slovenia did not specifically mention LNG. Latvia did not rule out the introduction of LNG; Poland emphasised the need for LNG or compressed natural gas (CNG); and Romania was considering a feasibility study for an LNG terminal. Among the landlocked countries, Czechia and Slovakia made no mention of LNG imports, while the Adriatic LNG terminal project in Croatia was one of the three international gas infrastructure projects under consideration for Hungary. At the time, NMSs were more focused on storage for improving security of supply – only Bulgaria did not address gas storage. Of the gas producing NMSs, only Croatia did not emphasise the need or goal to take measures to counteract the declining trend in gas production. The other countries (Bulgaria, Hungary, Poland, and Romania) intended to either maintain or even increase production through exploration and production activities.
Generally, NMS strategies recognised the importance of reducing gas supply dependency on Russia while pointing to the social and environmental benefits of increasing gas consumption. These conflicting interests are mapped in . Except for Croatia, NMSs are in the dangerous demand dependency area with moderate to low supply dependency. At the time, Croatia did not consider supply dependency risk, given that it possessed substantial own production and limited gas heating in the household segment. Hungary was aiming for less dependency in both supply and demand. Romania and Latvia planned to have very limited supply dependency and preferred to keep gas demand in a medium range.
Table 2. Categorisation of data in energy strategies of new member states.
Compared to the envisioned strategic goals from around 2004, the 2022 NMS supply and demand dependency composite indicators depict a different path, shown in . The ambitious plans for demand growth barely materialised in several NMSs (Bulgaria, Croatia, Lithuania, and Slovenia), while the supply dependency improved. Estonia undertook the largest transformation, almost entirely phasing out gas from its energy mix, which was far apart from its stated goal and signalling a drastic shift in energy policy. Hungarian and Romanian plans to substantially reduce gas demand dependency failed, but their situation was improved through supply infrastructure development. Czech and Slovak strategies were contradictory and lacking in detail, making them difficult to interpret, but their positions did not change much over the period.
5. Discussion
Around the time of the 2004 EU enlargement, NMSs were heavily dependent on Russian gas deliveries due to the inherited infrastructure and the contractual regimes. The OMSs had a more robust gas supply mix with substantial domestic production in the Netherlands and the UK, the availability of piped gas sources from Norway and Algeria, and access to the global LNG market via regasification terminals. The NMSs were reducing their asymmetrical exposure to Russia already before their EU accession. NMSs preferred natural gas over more polluting fossil fuels and planned to apply supply-side measures to offset adverse energy security effects. According to Cameron et al. (Citation2006), although the gas molecules remained Russian, the contractual relationships changed,Footnote11 lowering the share of Russian gas in gas imports from 87% in 1999 to 79% in 2004. After EU accession, the share of Russian gas in energy consumption continued to decline in most NMSs. On the other hand, the OMSs started to increase their Russian gas imports following the accession of the NMSs.
After the 2009 gas disruption, when Russian deliveries via Ukraine were halted due to price disputes between the two countries, NMSs had a persuasive argument for demanding an EU-wide strategic response. The EU, in turn, developed a security of supply framework with modified and new legislations. It allocated EU funds to infrastructure projects,Footnote12 and the institutional guidance played an important role in market creation. Between 2014–2020, the Connecting Europe Facility provided €1.5 billion of support for natural gas pipeline projects to improve the interconnectivity of the NMSs (CINEA Citation2022). The binding N–1 infrastructure standard from the 2010 Security of Gas Supply Regulation was instrumental.Footnote13 This Regulation also required permanent physical bi-directional capacity on all cross-border interconnections between EU member states. At the same time, Russian undersea pipelines had to conform to EU legislation.Footnote14 Another key EU measure, introduced in the 2017 Security of Gas Supply Regulation, is the solidarity mechanism, which codifies joint EU member states actions during times of crisis. The final examples pertain to Russian gas supply contracts. The antitrust case against Gazprom led to a binding obligation in 2018 to enable the free flow of gas at competitive prices in NMSs. Furthermore, the 2017 Security of Gas Supply Regulation required contract notification and assessment. Looking at the EU-level measures within the broader context of dependency, we contend that the EU-level gas market cooperation, enhanced interconnectivity, and a well-functioning EU internal gas market with significant buyer power have yielded tangible outcomes. These measures balanced the asymmetrical power relationship between Central and East European buyers and the Russian seller through the enforcement of a hub-based price indexation, thereby closing the price gap between the old and new member states by around 2017 (European Commission Citation2018).
Our analysis revealed that NMSs successfully decreased their supply dependency without increasing their demand dependency over the course of the study period. This was partly attributable to the industrial restructuring of the CEE economies, but partly to the shift in the European policy agenda, which established an overarching long-term decarbonisation goal for the entire bloc to achieve. In the mid-2010s, as evidenced by the 2015 Paris Agreement and the EU’s 2016 Clean Energy Package, the EU – driven by OMSs – began to place an increasing emphasis on carbon neutrality, focusing on renewables and electrification over natural gas. Renewables have experienced a rapid upswing, and the previous merits of coal-to-gas switching have been debated (Szabó Citation2020). Europe’s new green growth strategy, the European Green Deal, was unveiled by the European Commission in December 2019. The European Council’s adoption of a 2050 carbon-neutrality target in December 2019 was followed by a more ambitious interim target for reducing greenhouse gas emissions (at least 55% by 2030 compared to 1990 levels) in December 2020. The European Commission’s 2020 findings indicated that a reduction of gas consumption of more than 25% by 2030 compared to 2015 is necessary to achieve the revised climate targets (European Commission Citation2024a). Published in December 2021, the European Commission’s Fourth Gas Package, the Hydrogen and Gas Market Decarbonisation Package, revised the 2009 Gas Directive and Gas Regulation, and proposed rules for the replacement of fossil gas with renewable and low-carbon gases, like hydrogen, and addressing methane emissions. Although the European Commission’s Complementary Climate Delegated Act of February 2022 labelled specific gas and nuclear activities under certain conditions as environmentally sustainable, it will make the implementation of new natural gas projects increasingly difficult (European Commission Citation2024a). The above indicates that the shift in the European energy policy agenda towards decarbonisation has directly impacted the implementation of the security of supply measures of the NMSs. Specifically, infrastructure measures (supply side) have become less supported, while switching away from gas (demand side) has become a target.
Parallel to these policy developments, the EU–Russia energy relationship was deteriorating, with less cooperation and communication (Haukkala Citation2015; Westphal, Bros, and Mitrova Citation2017). In 2021, Russia unilaterally started to decrease deliveries to the EU, precipitating the energy crisis in Europe. The aim was undoubtedly to exert pressure on the EU and Germany to permit the commissioning of the controversial Nord Stream 2 undersea pipeline between Russia and Germany (M. De Jong, Van de Graaf, and Haesebrouck Citation2022). The February 2022 Russian aggression against Ukraine and the EU’s subsequent strategic and political actions have resulted in a complete change in gas supply flows to the EU, testing the resilience of the single gas market. The EU took both supply- and demand-side measures to mitigate the looming energy crisis (European Commission Citation2024b).Footnote15 Previously unplanned new gas infrastructure was constructed to prevent supply disruptions for industry and households.Footnote16 These combined measures succeeded in neutralising the Russian gas weapon, although Europe had to endure extremely high prices in 2022, with an estimated €646 billion spent subsidising EU consumer energy bills (ACER–CEER Citation2023).
From a Russian perspective, the energy weapon was partially successful, although less so than was anticipated. Given the high share of Russian gas in the European supply mix, it was expected that (i) European gas demand could not be met without Russian gas, (ii) prices would soar and market convergence on European exchanges would disappear, (iii) the Russian budget would be positively affected, as lower sales at much higher prices would increase revenues, and (iv) Russia could divert some of its gas exports to other markets via LNG or pipeline sales (Kotek et al. Citation2023). The faster-than-expected adjustment in demand, the flexible installation of additional LNG capacity, the rapid response of US swing producers, and the milder winters in 2022/2023 and 2023/2024 resulted in Europe’s supply/demand balance being 20% lower than before the war (ACER–CEER Citation2023, McWilliams, Sgaravatti, and Zachmann Citation2024). Europe was able to attract huge volumes of LNG to previously underutilised import terminals, partly due to the extreme price reactions. Indeed, prices rose to unprecedented levels, and Russian gas sales revenues in 2022 surpassed all historical records (Yermakov Citation2024). Nevertheless, the energy weapon proved to be a one-off tool. As Russian gas became increasingly scarce in the EU’s gas imports, with its share falling from 45% in 2021 to 15% in 2023 (European Commission Citation2024b), the potential for market manipulation diminished. Focusing on availability and affordability, EU-level policy making has enhanced gas supply security. The EU’s infrastructure setup proved sufficient to facilitate a sudden redirection of gas flows in 2022. However, the weakest point was Germany, the EU’s largest gas market. On its northern shores, three additional LNG terminals were built in record time. One key lesson learned was that Germany’s reliance on affordable Russian gas, coupled with the steadfast belief of its leading politicians in the theory of mutually beneficial and positive interdependency, formed the foundation for support for Nord Stream 2, which ultimately became the most controversial project undermining the common European security strategy (Takácsné Tóth, Kotek, and Selei Citation2020).
The war has accelerated the unity of the EU member states to coordinate energy policies driven by geopolitical considerations. This is with the aim of reducing the share of Russian gas in the energy mix. However, it remains the case that individual member states are at liberty to follow a different path according to their national interests. Differences in energy relations with Russia still persist: some member states have phased out Russian gas from their energy mix, such as Croatia, Czechia, Germany, and Poland, while others have decided not to do so and have maintained ongoing long-term supply contracts, in particular Austria, Hungary, and Slovakia. A new phenomenon is that growing volumes of Russian LNG are entering the European system via West European terminals, underlining that national economic interests can override geopolitical considerations (McWilliams, Sgaravatti, and Zachmann Citation2024). In June 2024, the EU, in its 14th package, adopted sanctions on Russia’s LNG sector by banning reloading of Russian LNG in EU territory for trans-shipment to third countries but did not prohibit Russian LNG exports to the EU (Reuters Citation2024a).
Although natural gas is anticipated to remain a significant contributor to the EU’s energy portfolio for many years to come, the outlook for the future role of Russian gas appears unfavourable. The Russian–Ukrainian gas transit contract is set to expire at the end of 2024, with Ukraine having indicated that it does not intend to extend it (Reuters Citation2024b). This could result in a further reduction in Russian gas exports to the EU. Even in the event of a peace agreement between Russia and Ukraine, and despite Russian efforts to return to the EU’s gas market with competitive pricing, the probability of success for Russian gas is quite low, given the lost trust in Russia as a reliable supplier and the securitisation of gas supply.
6. Conclusion
This study has mapped the changes in gas dependency of EU members between 2004 and 2022. It has also examined the extent to which these patterns align with previous strategic plans for the NMSs. In response to the research questions posed, firstly, the document analysis revealed that in most NMSs there was a clear awareness of the risk of Russian gas dependency. The Baltic states were the most explicit about their concerns. Countries with less developed gas markets were observed to be more relaxed about Russian gas. Secondly, four out of nine NMSs moved away from the dangerous level of dependency by 2019, while conversely, the number of OMSs in the dangerous zone increased from eight to nine. A more concerning trend was the worsening of most OMSs’ dependency position in the pre-war period, particularly in terms of supply dependency. Despite the increasing number of sanctions against Russia since 2014, Russian gas had continued to gain weight in their energy mix. Thirdly, in comparison to their initial plans for gas usage as outlined in their early strategies, NMSs have predominantly implemented supply diversification, primarily through infrastructure investments. However, they have not achieved their goal of using gas as a transition fuel in the decarbonisation process. A more expeditious phase-out of coal would have resulted in a different pattern of gas consumption and the role of gas and Russian imports in the NMSs in 2019. Despite efforts to diversify gas import sources, it would have been challenging to reduce Russian gas supplies in the context of higher gas demand if the decision to import had been based on affordability and competitiveness, given the competitive price of Russian gas. Nevertheless, Russia’s invasion of Ukraine in February 2022 has served to remind governments in Central and Eastern Europe that the focus should be on reducing gas consumption.
The results of the research confirm the assumption of the first hypothesis: the new and old member states have followed different paths. The outbreak of war in Ukraine in 2022 brought about a 180-degree turnaround for the OMSs. Whereas previously, demand and/or supply dependency had increased in most OMSs, in 2022 they were able to quickly turn to other gas sources and move out of dangerous supply dependency. In some OMSs, by 2022, gas demand had already been minimised partly due to security of supply but also to climate policy considerations. In contrast, for NMSs, there has been no such abrupt change in the pre-war indicators. The improvement in gas dependency that was observed until 2019 has continued, although to a lesser extent.
The indicator-based quantitative assessment of all member states indicates that the second hypothesis is not supported, as the behaviour of member states does not appear to differ according to the share of gas in the energy mix in the base year. Contrary to our hypothesis, we have identified a tendency towards diversification among all the NMSs, regardless of whether they had a minor gas role in 2004. Even the large gas-consuming OMSs did not perceive the necessity to reduce their supply or demand dependency until the outbreak of the war. There are a few exceptions to this general rule – Belgium and Finland among the OMSs. Our analysis suggests that the behaviour of member states was more influenced by different perceptions of vulnerability and a varying sense of threat in the pre-war period. The key distinction is that the OMSs did not perceive their Russian gas dependency as a significant risk, whereas the NMSs viewed this as a high-risk factor.
The war forced a rapid change of supplier and thus the implementation of the planned diversification. This was not a consequence of the EU’s or the member states’ own decision but rather because Russia used the energy weapon by cutting its gas supplies. This led to enormously high gas prices, which triggered a demand response from all consumer segments. The EU’s pre-war infrastructure investment policy – augmented by additional German investment during the crisis – proved to be sufficient to withstand the Russian supply shock, while the majority of the Russian gas pipeline investments became stranded assets. If the logic of dependency had driven the decisions on Russian pipeline investments, it would have been more logical to develop a Russian LNG fleet that could access global LNG markets, rather than investing in parallel pipeline systems to serve the same EU market. In this respect, we can also speak of the failure of the Russian dependency strategy.
The energy crisis that emerged in the wake of Russia’s invasion of Ukraine has temporarily diverted attention from sustainability. The gas supply dependency has been addressed, and it is now necessary to shift the policy focus to the reduction of gas demand through energy efficiency and substitution with renewables (European Commission Citation2024b). However, the renewable industry’s reliance on critical raw materials may give rise to the emergence of new dependencies. To avoid these, the gas case study presented here provides critical lessons. Firstly, it demonstrates that individual member states will perceive this threat differently and will set up their diversification strategy based on a wide variety of measures. These uncoordinated measures might result in some inefficiencies and overinvestment into underutilised infrastructure under normal conditions but will pay off the investment in security of supply terms. Secondly, it can be argued that the formation of a unified EU-level strategy, the communication of the perceived threat, and the demonstration of solidarity among EU member states can signal the strength of the bloc to suppliers, provided that the attractiveness of the EU internal energy market remains. Thirdly, it can be proposed that EU financial support and intervention efforts should be focused on cross-border infrastructure investment and the mitigation of possible negative effects of one country’s measures on the others’ positions. The new European Commission, to be established in 2024, should be responsible for monitoring energy security as comprehensively as possible and for setting minimum standards to ensure that no member state is overly dependent on any single energy source or supplier.
This article introduces an innovative methodology for visually tracking changes in the gas dependency of countries and their relation to previous plans and targets. While this paper focuses on the gas dependency of EU member states and the documentary analysis covers their national energy strategies, the analytical framework could be useful for monitoring other developments and changes in the future.
Regarding the limitations of the research, the indicators included in the framework are geared towards security of supply, but some aspects cannot be taken into account due to a lack of data. One such important factor is the fuel-switching potential of households (i.e. the existence of secondary heating systems). In the future, the burning of biomass (firewood and waste wood) in Central and Eastern Europe and various electric heating systems and heat pumps in Western Europe may represent a larger number of potential temporary or permanent switching. Nevertheless, the methodology employed is robust, as the omission of an indicator from the analysis has not altered the relative positioning of countries or the conclusions drawn from the assessment.
In future deployments, it will be important to ascertain the relationship between more recent strategies and post-February 2022 developments. Such an analysis could be based on the National Energy and Climate Plans currently under review, the final versions of which are due to be submitted by EU member states to the European Commission by June 2024. If justified by the research question, other dimensions of security of supply, such as indicators measuring affordability and sustainability, could also be included.
Supplemental Material
Download MS Word (98.8 KB)Acknowledgments
The authors are grateful to Gábor Horváth and András Vékony for their valuable comments. Csaba Weiner’s work was supported by the National Research, Development and Innovation Office of Hungary under Grant No. FK 138317. Borbála Takácsné Tóth’s research was sponsored by the National Research, Development and Innovation Office of Hungary under Grant No. K 143311. The suggestions of three anonymous reviewers are also gratefully acknowledged.
Disclosure statement
No potential conflict of interest was reported by the author(s).
Supplementary material
Supplemental data for this article can be accessed online at https://doi.org/10.1080/14782804.2024.2385978
Notes
1. Czechia, Estonia, Hungary, Latvia, Lithuania, Slovakia, Slovenia, and Poland (along with the non-CEE Malta and Cyprus) joined the EU in 2004, followed by Bulgaria and Romania in 2007 and Croatia in 2013.
2. In this article, the term ‘new member states’ refers to the 11 CEE countries who joined the EU.
3. In 2019, the EU imported 80% of its gas consumption, up from 50% in 2004.
4. In 2023, some 17 bcm of Russian gas arrived by ship as LNG, mainly to West European ports (France, Spain, and the Netherlands), while pipeline gas supplies included 13 bcm to Austria and Slovakia via Ukraine, and around 13 bcm via Turkey.
5. We concur with the categorisation, but contend that Romania is erroneously situated within the high-risk category. Its high indigenous production rate warrants a placement within the low-risk category.
6. For example, the ENTSOG’s 2014/2015 Winter Outlook identified South East Europe as the most exposed to a Russian supply disruption. Earlier ENTSOG outlooks had mainly focused on daily peak demand scenarios (ENTSOG Citation2014).
7. The list of energy policy documents of the NMSs utilised in the assessment is provided in the Supplemental online material (Appendix SA). In order to read the strategies that are not available in English, we used DeepL and Google Translate.
8. The categorisation of energy strategy measures in terms of Russian dependency is inserted in the Supplemental online material (Appendix SB).
9. Tables summarising the indicator-based assessment of gas dependence for each new and old member state are available as Supplemental online material (Appendices SC, SD, and SE).
10. For more on Finnish gas dependency and risk perception, see Jääskeläinen et al. (Citation2018).
11. Through privatisation, West European energy companies entered the CEE markets, and gas incumbents of the NMSs signed contracts with these West European parent companies for the delivery of gas. The gas was Russian; only the contractual partner changed.
12. See the 2013 and 2022 Trans-European Networks for Energy (TEN-E) Regulations and the 2013 and 2021 Connecting Europe Facility (CEF) Regulations.
13. The 2017 Security of Gas Supply Regulation introduced the so-called regional N–1 indicator that resembles more on assessing a supply disruption from a main supplier (i.e. Russia).
14. See the 2009 Gas Directive and its 2019 amendment.
15. These measures included a gas storage filling target, a voluntary gas consumption reduction target, joint purchases of gas, a gas solidarity mechanism, and a market correction mechanism (gas price cap).
16. The OMSs rapidly turned to investing in LNG import terminals.
References
- Aalto, P., and T. K. Dicle. 2014. “European Energy Security: Natural Gas and the Integration Process.” Journal of Common Market Studies 52 (4): 758–774. https://doi.org/10.1111/jcms.12108.
- ACER. 2021. “Estimated Number and Diversity of Supply Sources 2021.” https://aegis.acer.europa.eu/chest/dataitems/214/view.
- ACER–CEER. 2023. Energy Retail and Consumer Protection 2023 Market Monitoring Report. https://www.acer.europa.eu/electricity/market-monitoring-report.
- Ang, B. W., W. L. Choong, and T. S. Ng. 2015. “Energy Security: Definitions, Dimensions and Indexes.” Renewable and Sustainable Energy Reviews 42:1077–1093. https://doi.org/10.1016/j.rser.2014.10.064.
- Augutis, J., R. Krikštolaitis, L. Martišauskas, S. Urbonienė, R. Urbonas, and A. B. Ušpurienė. 2020. “Analysis of Energy Security Level in the Baltic States Based on Indicator Approach.” Energy 199:117427. https://doi.org/10.1016/j.energy.2020.117427.
- Bazilian, M., B. Sovacool, and M. Miller. 2013. “Linking Energy Independence to Energy Security.” IAEE Energy Forum 2013/3:17–21. https://www.itu.int/en/ITU-T/climatechange/resources/Documents/Bazilian_Security_IAEE.pdf.
- Boussena, S., and C. Locatelli. 2013. “Energy Institutional and Organisational Changes in EU and Russia: Revisiting Gas Relations.” Energy Policy 55:180–189. https://doi.org/10.1016/j.enpol.2012.11.052.
- Branko, T. 2012. Energy Independence and Security: A Reality Check. Deloitte University Press. https://www2.deloitte.com/content/dam/insights/us/articles/energy-independence/Energy-Indpendence-and-Security_A-reality-check.pdf.
- Cameron, P., A. I. Tóth, P. Kaderják, A. Mezősi, and P. Szolnoki. 2006. “Disruptions: Short Term Supply Security.” In Impact of the 2004 Enlargement on the EU Energy Sector, edited by M. LaBelle and P. Kaderják, 25–114. Budapest: REKK.
- Casier, T. 2016. “Great Game or Great Confusion: The Geopolitical Understanding of EU–Russia Energy Relations.” Geopolitics 21 (4): 763–778. https://doi.org/10.1080/14650045.2016.1185607.
- CINEA. 2022. “Investing in European Networks.” https://doi.org/10.2840/130663.
- Cohen, G., F. Joutz, and P. Loungani. 2011. “Measuring Energy Security: Trends in the Diversification of Oil and Natural Gas Supplies.” Energy Policy 39 (9): 4860–4869. https://doi.org/10.1016/j.enpol.2011.06.034.
- Council (Council of the EU and European Council). 2024. “EU Sanctions Against Russia.” https://www.consilium.europa.eu/en/policies/sanctions-against-russia/.
- De Jong, J., H. Maters, M. Scheepers, and A. Seebregts. 2006. EU Standards for Energy Security of Supply. ECN Report ECN-C-06-039/CIEP. https://publications.tno.nl/publication/34628625/y5W1s0/c06039.pdf.
- De Jong, M., T. Van de Graaf, and T. Haesebrouck. 2022. “A Matter of Preference: Taking Sides on the Nord Stream 2 Gas Pipeline Project.” Journal of Contemporary European Studies 30 (2): 331–344. https://doi.org/10.1080/14782804.2020.1858763.
- ENTSOG. 2011. “ENTSOG Capacity Map 2011.” https://www.entsog.eu/sites/default/files/2018-10/ENTSOG_CAP_MapData_June2010_final.xls.
- ENTSOG. 2014. “Winter Supply Outlook 2014/15.” https://www.entsog.eu/sites/default/files/entsog-migration/publications/Outlooks%20%26%20Reviews/2014/SO0008-141103_WinterSupplyOutlook2014-15_Review2013-14.pdf.
- ENTSOG. 2019. “ENTSOG Capacity Map 2019.” https://www.entsog.eu/sites/default/files/2019-10/Capacities%20for%20Transmission%20Capacity%20Map%20RTS008_NS%20-%20DWH_final.xlsx.
- ENTSOG. 2024. “ENTSOG Capacity Map 2024.” https://www.entsog.eu/sites/default/files/2024-02/System%20Capacity%20Map%202024%20-%20Capacities.xlsx.
- European Commission. 2013. Regulation (EU) No 347/2013 of the European Parliament and of the Council of 17 April 2013 on Guidelines forTrans-European Energy Infrastructure and Repealing Decision No 1364/2006/EC and Amending Regulations (EC) No713/2. OJ L 115:39–75. https://eur-lex.europa.eu/legal-content/en/TXT/?uri=celex%3A32013R0347.
- European Commission. 2014. ”Communication from the Commission to the European Parliament and the Council on European Energy Security Strategy.” https://eur-lex.europa.eu/legal-content/EN/TXT/PDF/?uri=CELEX:52014DC0330&from=EN.
- European Commission. 2015.” Communication from the Commission to the European Parliament, the Council, the EESC, the Committee of the Regions and the EIB: Framework Strategy for a Resilient Energy Union with a Forward-Looking Climate Change Policy.” COM/2015/080 final. https://eur-lex.europa.eu/legal-content/EN/TXT/?uri=CELEX:52015DC0080.
- European Commission. 2018. “Quo Vadis EU Gas Market Regulatory Framework: Study on Gas Market Design for Europe.” https://data.europa.eu/doi/10.2833/595884.
- European Commission. 2024a. “The European Green Deal.” https://commission.europa.eu/strategy-and-policy/priorities-2019-2024/european-green-deal_en.
- European Commission. 2024b. “REPowerEU.” https://commission.europa.eu/strategy-and-policy/priorities-2019-2024/european-green-deal/repowereu-affordable-secure-and-sustainable-energy-europe_en.
- Eurostat. 2024a. “Imports of Natural Gas by Partner Country [Nrg_ti_gas].” https://ec.europa.eu/eurostat/databrowser/view/nrg_ti_gas/default/table?lang=en.
- Eurostat. 2024b. “Simplified Energy Balances [Nrg_bal_s].” https://ec.europa.eu/eurostat/databrowser/product/view/NRG_BAL_S.
- Eurostat. 2024c. “Supply, Transformation and Consumption of Gas [Nrg_cb_gas].” https://ec.europa.eu/eurostat/databrowser/view/nrg_cb_gas/default/table?lang=en.
- Grigas, A. 2012. “The Gas Relationship Between the Baltic States and Russia: Politics and Commercial Realities.” OIES Paper. Oxford: Oxford Institute for Energy Studies. https://www.oxfordenergy.org/wpcms/wp-content/uploads/2012/10/NG_67.pdf.
- Haukkala, H. 2015. “From Cooperative to Contested Europe? The Conflict in Ukraine as a Culmination of a Long-Term Crisis in EU–Russia Relations.” Journal of Contemporary European Studies 23 (1): 25–40. https://doi.org/10.1080/14782804.2014.1001822.
- Jääskeläinen, J. J., S. Höysniemi, S. Syri, and V.-P. Tynkkynen. 2018. “Finland’s Dependence on Russian Energy: Mutually Beneficial Trade Relations or an Energy Security Threat?” Sustainability 10 (10): 3445. https://doi.org/10.3390/su10103445.
- Jonek-Kowalska, I. 2022. “Multi-Criteria Evaluation of the Effectiveness of Energy Policy in Central and Eastern European Countries in a Long-Term Perspective.” Energy Strategy Reviews 44:100973. https://doi.org/10.1016/j.esr.2022.100973.
- Judge, A., T. Maltby, and J. D. Sharples. 2016. “Challenging Reductionism in Analyses of EU–Russia Energy Relations.” Geopolitics 21 (4): 751–762. https://doi.org/10.1080/14650045.2016.1222520.
- Kotek, P., A. Selei, B. Takácsné Tóth, and B. Felsmann. 2023. “What Can the EU Do to Address the High Natural Gas Prices?” Energy Policy 173:113312. https://doi.org/10.1016/j.enpol.2022.113312.
- Kupchinsky, R. 2004. “Enter Gazpromneft.” RFE/RL, Russia Report 4 (45). https://www.rferl.org/a/1344329.html.
- LaBelle, M. C. 2023. “Energy as a Weapon of War: Lessons from 50 Years of Energy Interdependence.” Global Policy 14 (3): 531–547. https://doi.org/10.1111/1758-5899.13235.
- Larsson, R. R. 2006. Russia’s Energy Policy: Security Dimensions and Russia’s Reliability as an Energy Supplier. Scientific Report. Swedish Defence Research Agency. https://www.foi.se/rest-api/report/FOI-R–1934–SE.
- Le Coq, C., and E. Paltseva. 2009. “Measuring the Security of External Energy Supply in the European Union.” Energy Policy 37 (11): 4474–4481. https://doi.org/10.1016/j.enpol.2009.05.069.
- McWilliams, B., G. Sgaravatti, and G. Zachmann. 2024. “European Natural Gas Imports.” https://www.bruegel.org/dataset/european-natural-gas-imports.
- Mišík, M. 2016. “Energy Union and the Visegrad Four Countries: Blurred Unity?” International Issues & Slovak Foreign Policy Affairs 25 (1–2): 68–80. https://www.ceeol.com/search/article-detail?id=460333.
- Palonkorpi, M. 2006. “The Security Complex Theory and the Energy Security.” In Pieces from Peripheries and Centres, edited by M. Rantaniemi, K. Kurtakko, and K. Norvapalo, 302–313. Rovaniemi: University of Lapland.
- Pavlović, D., E. Banovac, and N. Vištica. 2018. “Defining a Composite Index for Measuring Natural Gas Supply Security: The Croatian Gas Market Case.” Energy Policy 114:30–38. https://doi.org/10.1016/j.enpol.2017.11.029.
- Pirani, S. 2012. “Russian Gas: The Next Ten Years.” Oxford Energy Forum 89:12–14. https://www.oxfordenergy.org/wpcms/wp-content/uploads/2012/10/OEF_89.pdf.
- Reuters. 2024a. “EU Adopts New Sanctions Against Russia, Including LNG.” https://www.reuters.com/world/europe/eu-adopts-new-sanctions-against-russia-including-lng-2024-06-24/.
- Reuters. 2024b. “Ukraine Has No Plan to Extend Russian Gas Transit Deal.” https://www.reuters.com/business/energy/ukraine-has-no-plan-extend-russian-gas-transit-deal-2024-03-17/.
- Righetti, E., and R. Vasileios. 2024. “Reducing Supply Risks for Critical Raw Materials.” CEPS In-Depth Analysis. https://cdn.ceps.eu/wp-content/uploads/2024/01/CEPS-InDepthAnalysis-2024-01_Reducing-supply-risks-for-critical-raw-materials.pdf.
- Rodríguez-Fernández, L., A. B. F. Carvajal, and V. Fernández de Tejada. 2022. “Improving the Concept of Energy Security in an Energy Transition Environment: Application to the Gas Sector in the European Union.” The Extractive Industries and Society 9:101045. https://doi.org/10.1016/j.exis.2022.101045.
- Rodríguez-Fernández, L., A. B. F. Carvajal, and L. M. Ruiz-Gómez. 2020. “Evolution of European Union’s Energy Security in Gas Supply During Russia–Ukraine Gas Crises (2006–2009).” Energy Strategy Reviews 30:100518. https://doi.org/10.1016/j.esr.2020.100518.
- Stern, J. 2015. “Gazprom: A Long March to Market-Based Pricing in Europe?” Oxford Energy Forum 101:9–12. https://www.oxfordenergy.org/wpcms/wp-content/uploads/2015/09/OEF-101.pdf.
- Szabó, J. 2020. “Climate Action in the European Commission’s Natural Gas Policy.” IWE Working Papers 262. Budapest: Institute of World Economics, Centre for Economic and Regional Studies. http://real.mtak.hu/115932/1/WP262_Szabo_Climate_Action.pdf.
- Takácsné Tóth, B., P. Kotek, G. Horváth, A. Selei, A. Vékony, E. Kácsor, A. Mezősi, and A. Geraskina. 2022. Phasing Out Russian Gas in the Danube Region. Final Report, Danube Region Strategy. https://rekk.hu/downloads/projects/DR_RU_Gas_phaseout_REKK_final.pdf.
- Takácsné Tóth, B., P. Kotek, and A. Selei. 2020. “Rerouting Europe’s Gas Transit Landscape: Effects of Russian Natural Gas Infrastructure Strategy on the V4.” Energy Policy 146:111748. https://doi.org/10.1016/j.enpol.2020.111748.
- Takácsné Tóth, B., P. Kotek, and A. Selei. 2021. “Is Russia to Blame for High European Gas Prices?” REKK Policy Brief 8. https://rekk.hu/downloads/academic_publications/rekk_policybrief_en_2021_08.pdf.
- Tutak, M., and J. Brodny. 2022. “Analysis of the Level of Energy Security in the Three Seas Initiative Countries.” Applied Energy 311:118649. https://doi.org/10.1016/j.apenergy.2022.118649.
- Vatansever, A. 2017. “Is Russia Building Too Many Pipelines? Explaining Russia’s Oil and Gas Export Strategy.” Energy Policy 108:1–11. https://doi.org/10.1016/j.enpol.2017.05.038.
- Weiner, C. 2016. “Central and East European Diversification Under New Gas Market Conditions.” IWE Working Papers 221. Budapest: Institute of World Economics, Centre for Economic and Regional Studies, Hungarian Academy of Sciences. https://real.mtak.hu/33784/1/WP_221_Weiner.pdf.
- Weiner, C. 2021. “Pathways for a Low-Carbon Electricity System in Poland and Hungary.” In From Economic to Energy Transition: Three Decades of Transitions in Central and Eastern Europe, edited by M. Mišík and V. Oravcová, 211–245. Cham: Palgrave Macmillan. https://doi.org/10.1007/978-3-030-55085-1_8.
- Westphal, K., A. Bros, and T. Mitrova. 2017. “German–Russian Gas Relations: A Special Relationship in Troubled Waters.” SWP Research Paper 2017/RP 13. https://www.swp-berlin.org/en/publication/german-russian-gas-relations.
- Wigell, M., and A. Vihma. 2016. “Geopolitics versus Geoeconomics: The Case of Russia’s Geostrategy and Its Effects on the EU.” International Affairs 92 (3): 605–627. https://doi.org/10.1111/1468-2346.12600.
- Yafimava, K. 2015. “European Energy Security and the Role of Russian Gas: Assessing the Feasibility and the Rationale of Reducing Dependence.” IAI Working Papers (Istituto Affari Internazionali) 2015/54. https://www.iai.it/sites/default/files/iaiwp1554.pdf.
- Ye, R., Y. Zhou, J. Chen, and K. Tu. 2021. “Natural Gas Security Evaluation from a Supply vs. Demand Perspective: A Quantitative Application of Four As.” Energy Policy 156:112425. https://doi.org/10.1016/j.enpol.2021.112425.
- Yermakov, V. 2024. Follow the Money: Understanding Russia’s Oil and Gas Revenues. Oxford Energy Comment. https://www.oxfordenergy.org/wpcms/wp-content/uploads/2024/03/Follow-the-Money-Russian-Oil.pdf.
- Ziemba, P. 2022. “Energy Security Assessment Based on a New Dynamic Multi-Criteria Decision-Making Framework.” Energies 15 (24): 9356. https://doi.org/10.3390/en15249356.