
Abstract
This paper introduces the application and the results of a fuzzy number based questionnaire used for evaluating lecturers’ performance in a newly launched peer review programme in order to enhance the reliability of peer evaluations. In our approach, the membership function of the fuzzy number is composed of an increasing and a decreasing sigmoid membership function conjuncted by Dombi’s intersection operator. Compared to the traditional Likert scale-based evaluation, the proposed fuzzy number based methodology allows peer reviewers to express their uncertainty and the variability of the reviewed lecturer’s performance within a single lecture and during a semester in a quantitative way. By utilising the principles of Dombi’s Pliant Arithmetic, fuzzy Likert scale based evaluations given by peer reviewers can be cumulated by aggregating the parameters of the left- and right-hand sides of the fuzzy numbers separately. This property results in a much simpler statistical analysis of the gathered data than the methods previously proposed in the literature. A demonstrative case study illustrates our main contributions in peer evaluation.
1. Introduction
How can we assess the quality of educational services offered by a higher education (HE) institution? How can we know reliably whether the expectations of customers and other stakeholders, primarily of students are met? In order to answer these questions, there is a need to design suitable and reliable methodologies to evaluate performance and to identify appropriate measure units to highlight the achieved service performance level (Lupo, Citation2013; Battisti, Nicolini, & Salini, Citation2005, Citation2010).
Measuring service quality and the satisfaction of stakeholders in HE is mainly realised through the application of Likert scales (see e.g. Brochado, Citation2009; Teeroovengadum, Kamalanabhan, & Seebaluck, Citation2016; Nadiri, Kandampully, & Hussain, Citation2009; Lalla, Facchinetti, & Mastroleo, Citation2005). Chen (Citation2001) argues that the use of these scales reduces the human perception on one concrete number. Others have also claimed that individuals cannot use an exact number to express their opinion about a given situation. Instead of that, linguistic assessment is preferred to represent that specific numerical value (Herrera & Herrera-Viedma, Citation2000; Herrera, López, Mendana, & Rodríguez, Citation1999; Kacprzyk, Citation1986; Andayani, Hartati, Wardoyo, & Mardapi, Citation2017; Carrasco, Villar, Hornos, & Herrera-Viedma, Citation2011; Chang & Wang, Citation2016; Cabrerizo, López-Gijón, Martínez, Morente-Molinera, & Herrera-Viedma, Citation2017). In order to consider human perceptions, the fuzzy set theory is increasingly applied in these situations as they improve successfully the reliability of service process measurements and evaluations (Li, Citation2013; Lupo, Citation2013; Lin, Citation2010a; Deng, Citation2008).
This paper focuses on a challenging problem which is related to how to handle properly the inherent uncertainty of human perceptions. The current study aims to demonstrate the application of fuzzy Likert scales for evaluating lecturers’ performance in the peer review programme launched at the Faculty of Economic and Social Sciences. The proposed approach can help to deal with the vagueness arising either from the uncertainty of the reviewers or from the fluctuation of the observed lecturers’ performance. By providing a fuzzy Likert scale to evaluate lecturers’ performance, reviewers can express their uncertainty, their contrasting perceptions and the variability of the observed lecturers’ performance in a quantitative way.
Despite the fact that fuzzy numbers are able to model human judgement more precisely, the lack of simple methods to carry out statistical analyses has been turned out to be an obstacle in their utilisation. Several methods proposed in the literature (see e.g. Frühwirth-Schnatter, Citation1992 or Amini & Jochem, Citation2011) require both expertise in fuzzy set theory and high calculation efforts, which could hinder their utilisation. By following Dombi’s Pliant Inequality Model (Dombi, Citation2009), the aggregate evaluation can be computed in a convenient way which can serve the purposes of statistical analysis as well and allows the draw of more reliable managerial conclusions.
The paper is structured as follows. The next section highlights the advantages of fuzzy Likert scales compared to traditional Likert scales and provides our problem statement in the light of the peer review programme available at our faculty. Then the fuzzy set theory based methodology is presented. Finally, a case study demonstrates the advantages of the use of fuzzy Likert scales in peer evaluations. At the end we sum up the main findings and outline future research directions.
2. Literature review: traditional rating vs. fuzzy rating
The evaluation of educational activities may be carried out in several ways and shows great diversity. Berk (Citation2005) gives an overview of the possible varieties of evaluation applied in educational context in case of which commonly employed scales are Likert ones (Hartley, Citation2014; Murray, Citation2013). It is a discrete scale by choosing the most appropriate ‘values’ within a class according to the raters’ judgement, opinion, valuation (Gil & González-Rodríguez, Citation2012) and leads to ordinal data from a set of pre-fixed categories. When applying these Likert-type questionnaires and rating scales, responses are averaged in order to express the mean of a specific teaching performance attribute (De Witte & Rogge, Citation2011) which is then utilised as a kind of index and applied as a part of formative and/or summative evaluation. Another possible approach is summing the ratings and expressing them as a percentage to the maximal attainable overall rating (Liaw & Goh, Citation2003). It is also possible to ask students, peer reviewers or other stakeholders to rate the overall, semester-long performance of the lecturer on a single scale (Ellis, Burke, Lomire, & McCormack, Citation2003).
Rating items in a questionnaire can be considered as a complex task as raters make multiple decisions under uncertainty. The number of ‘values’ to choose from is small (Gil & González-Rodríguez, Citation2012) which means that the variability, diversity and subjectivity associated with an accurate rating is usually lost. Another disadvantage originates from the fact that when values are encoded by their relative position in accordance with a certain ranking, differences between codes cannot be interpreted as differences in their magnitude. It means that only statistical conclusions addressed to ordinal data can be reliable and relevant information can be lost (Lubiano, de Sáa, Montenegro, Sinova, & Gil, Citation2016). Another major issue related to the application of Likert scales is the weighting of aspects as they are usually not equally important for the raters. An additional concern arising with expressing overall evaluations is the fact that raters’ attitudes towards the rated item are not homogeneous as time goes on (see e.g. Tóth Zs, Surman, & Árva, Citation2017b). Third, if raters’ preferences are heterogeneous, it matters how and to what extent it influences the overall evaluation of a rated item. Average scores are supposed to hide the real situation, namely, the performance of the rated item (Kuzmanovic, Savic, Popovic, & Martic, Citation2013). Moreover, when Likert-type data are analysed for statistical purposes, the techniques to analyse them are quite limited (Lubiano et al., Citation2016). Different studies have been carried out to discuss the reliability of the analysis of these responses pointing out that increasing the number of responses results in an increase of information and reliability (Lozano, García-Cueto, & Muñiz, Citation2008; de Sáa, Gil, González-Rodríguez, López, & Lubiano, Citation2015). However, it cannot be achieved by using a natural language (Sowa, Citation2013). To manage these disadvantages there is an alternate approach which takes into account that the nature of most attributes related to evaluations, judgements involve subjectivity and certain imprecision (Lubiano et al., Citation2016; Quirós, Alonso, & Pancho, Citation2016).
Hesketh, Pryor, Gleitzman, and Hesketh (Citation1988) proposed the fuzzy rating scale without raters being constrained to choose among a few pre-specified categories. It is expressive enough to find a value in it fitting appropriately the valuation, opinion, judgement involving subjective perceptions in most real life situations (Gil, Lubiano, De Sáa, & Sinova, Citation2015). This kind of scale has the ability to model the imprecision of human rating evaluations, formalise them mathematically, to ‘precisiate’ them in a continuous way, and to develop mathematical computation with them (Gil et al., Citation2015; Calcagnì & Lombardi, Citation2014; Gil & González-Rodríguez, Citation2012). This approach leads to a fuzzy-valued response format enabling a level of variability and accuracy which would not be captured when using a Likert scale.
In the service quality literature several initiatives confirm the recent shift towards the utilisation of fuzzy ratings (Lin, Citation2010b). Liou and Chen (Citation2006) demonstrate that fuzzy linguistic assessment of service quality is much closer to human thinking than methods based on crispy numbers. The recent literature provides a number of modifications of the widely applied service quality models (Liu et al., Citation2015; Mashhadiabdol, Sajadi, & Talebi, Citation2014; Lupo, Citation2016; Zhang, Lin, & Ren, Citation2010).
Fuzzy rating scales have been intensively applied recently in HE context as well to measure quality related issues. Başaran, Kalaycı, and Atay (Citation2011), Lalla et al. (Citation2005) propose a method to implement fuzzy logic in student evaluations of teaching performance. Büyüközkan, Ruan, and Feyzioğlu (Citation2007) evaluate the quality of e-learning websites using fuzzy logic. Yu, Tsang, and Chen (Citation2016) develop a fuzzy linguistic scale to establish a satisfaction index in case of e-learning systems. Lupo (Citation2013) introduces a fuzzy SERVQUAL based method for reliable measurements of education quality. Rouyendegh and Erkan (Citation2013) apply a fuzzy logic based method for academic staff selection, Hammed (Citation2011) introduces one for a student evaluation system.
The membership functions of fuzzy sets can have various shapes (see ). The aforementioned literatures in fuzzy rating of service quality mainly employ triangular or trapezoidal membership functions, however, they are not always consistent with human thinking and judgement, since in these cases the membership functions have the same slope on the whole interval (see e.g. Hammed, Citation2011). In reality, the judgement of the respondent changes only slightly around points that represent the worst and the best possible judgement on the service quality, and the same property holds for the evaluation which is most likely to express the rater’s judgement. Hammed (Citation2011) also pointed out the disadvantages of triangular membership functions and proposed a Gaussian one to enhance the reliability of student evaluations. In our paper, we work with fuzzy numbers the membership function of which is composed of an increasing and a decreasing sigmoid membership function based on its favourable property that it increases or decreases around the above mentioned points less sharply (Dombi, Citation2008, Citation2009). That is, the slope of the sigmoid function is not constant, therefore, applying sigmoid functions to establish fuzzy numbers results in a more precise reflection of human thinking and judgement.
Figure 1. Triangular, trapezoid, Gaussian and sigmoid membership functions.
By following Dombi’s Pliant Inequality Model (Dombi, Citation2009), the aggregate evaluation based on different raters’ judgement can be computed in a convenient way since the parameters of our membership functions are aggregated according to the arithmetic and harmonic mean. This can serve the purposes of statistical analysis as well and allows the draw of more reliable managerial conclusions.
2.1. Peer review framework at the Budapest University of Technology and Economics
Based on the relevant literature and taking international practices into consideration (Samson & McCrea, Citation2008; Ihsan et al., Citation2012; Washer, Citation2006; Blackmore, Citation2005; Courneya, Pratt, & Collins, Citation2008; Brent & Felder, Citation2004), a semester-long peer review of teaching process has been launched at our Faculty. The questionnaires applied to evaluate lecturers’ performance include the observation of lectures, the observation of midterm tests and/or exams, and the overall evaluation of the lecturers’ semester-long performance in case of which most of the aspects of the lecturer’s performance are evaluated using a traditional 5-point Likert scale (Tóth Zs, Andor, & Árva, Citation2017a). Peer evaluations include both formative and summative components, since the applied questionnaires consist of two main parts: a numerical scale assessment of specific skills and of performance attributes and a second part standing for obligatory narrative comments.
For the purposes of this study, we focus on the questionnaire applied during classroom teaching observation. In this questionnaire the following performance dimensions have been evaluated on a traditional Likert scale: (1) Volume, intonation; (2) Grammar, intelligibility, speech rate; (3) Learning, explaining the terminology; (4) Explanatory capability; (5) Maintaining students’ attention; (6) Choosing proper presentation techniques; (7) Quality of the slide show; (8) Consonance of the slide show with verbal communication; (9) Logical structure of the lecture and presentation. This classroom questionnaire includes a second part as well allowing answers for elaborative questions.
The first results of the peer review programme have been already presented by Tóth Zs, Andor, and Árva (Citation2017a). During the evaluation process, we have come across several major constraints arising from the application of traditional Likert scales. Three main problems of feedbacks have been found that can affect the reliability of results originating from the process of peer reviewing, namely, the uncertainty inherent among evaluations, the variation of lecturers’ performance during the semester and the lack of methods available to compare different reviewers’ narrative evaluations (Tóth Zs, Surman, and Árva, Citation2017b). These issues addressed the research problem, namely, the enhancement of the reliability of measurements and evaluations executed in HE context by utilising fuzzy logic.
The evaluations conducted by either peer reviewers, students or other stakeholders can be considered as a complex combination of verbal statements. Evaluators have personal subjective preference or judgment depending on their individual knowledge or experiences. It is suitable for evaluators to use linguistic variables to express their subjective opinions in the assessment process. Researchers usually turn originally verbal data into numerical data by using Likert-type scale questionnaires when they are trying to get the opinions, judgements or valuations of the students, peer reviewers or other stakeholders (Başaran, Kalaycı, and Atay, Citation2011).
2.2. Drawbacks of peer evaluation
The aspects and evaluation dimensions of the questionnaire based on a traditional Likert scale are not able to cover the fluctuation of the observed lecturers’ performance within the same lecture, since evaluations are given at the end of the lecture reflecting an average evaluation in each dimension. Moreover, the retrospective statistics including the mean, the range and the standard deviation of the overall evaluations given at the end of the semester are more likely to reflect the differences between the various reviewers’ judgement than the variability of the lecturers’ performance.
Narrative comments in the questionnaires are of high importance and kindly welcomed from the reviewees’ points of view. They can reflect the variability of the observed lecturer’s performance as well, but there is a lack of simple methods to deal with linguistic feedbacks. This leads to an insufficient elaboration of this kind of information gained during the evaluation process. It means that by comparing and evaluating different lecturers’ performance based solely on numerical assessment, a remarkable part of the information gained is either lost or is not taken into account, which cannot serve the purposes of the faculty as a whole.
A fuzzy Likert scale can help to overcome the aforementioned difficulties. A fuzzy number depicts not only the differences between different colleagues’ judgements, but also the contrasting perceptions and impressions of the same reviewer. The more the uncertainty associated with the judgement and the more unbalanced the observed lecturer’s performance are, the more spread out the fuzzy number is.
3. Methodology
3.1. Fuzzy numbers as intersections of two soft inequalities
In our approach, the values on a Likert scale are represented by fuzzy numbers; that is, instead of expressing an opinion by selecting a particular crisp value on the scale, we allow the evaluator to select an ‘approximately x’ value that is given by a fuzzy number. We will use sigmoid functions to compose the membership functions of fuzzy numbers.
Definition 1
The sigmoid function with parameter
and
is given by
where
and
is nonzero.
The main properties of the sigmoid function are as follows.
Range. The range of
is the interval
Continuity.
Monotony.
o If
o If
Limits.
Role of parameters.
o Parameter
o The slope of
shows examples of sigmoid function graphs. Following Dombi’s Pliant Inequality Model (Dombi, Citation2009), we will use the following definitions where the indexes and
stand for ‘left’ and ‘right’, respectively, and will be used to denote left hand side and right hand side components of fuzzy numbers.
Figure 2. Intersection of two fuzzy sets given by an increasing and a decreasing sigmoid membership function.
Definition 2
The soft inequality is given by the sigmoid function
where
,
,
.
The soft inequality represents the truth of the inequality
. This truth value is in the interval (0, 1) and it depends on
. Since
is positive, the greater the variable
is, the higher the truth of the inequality
is. Notice that the parameter
is responsible for the ‘sharpness’ of the soft inequality
. It can be shown that if
, then
; that is, the truth of the relation
tends to 1, which means that
stands in the traditional manner. This result tells us that the soft inequality
is a generalisation of the crisp inequality
.
Definition 3
The soft inequality is given by the sigmoid function
where
,
,
.
The soft inequalities given by Definitions 1 and 2 allow us to express how much we consider a particular value of being greater than
or less than
. The introduced soft inequalities represent fuzzy sets with the membership functions
and
. That is, for any
,
and
are the membership values of
in the fuzzy sets which contain the numbers that are greater than
and less than
, respectively. Intersection of these two fuzzy sets represents the soft interval
. We will use the Dombi conjunction operator (Dombi intersection) to implement intersection of two fuzzy sets (Dombi, Citation2008).
Definition 4
The Dombi intersection of the fuzzy sets and
that are given by the membership functions
and
, respectively, is the fuzzy set with membership function
:
where
,
,
,
and
denotes the Dombi intersection operator.
If we apply the Dombi intersection to and
with
, we get
Utilising Definition 2 and Definition 3:
shows the intersection of two fuzzy sets given by an increasing and a decreasing sigmoid membership function. The following theorem demonstrates a key property of the soft inequalities given by sigmoid functions.
Theorem 1
If are fuzzy sets with the membership functions
, respectively,
, and the fuzzy set
is given by the linear combination
where
, then
is also sigmoid-shaped with the membership function
, where
Proof:
See Dombi (Citation2009). ▪
Theorem 1 allows us to separately aggregate the left hand sides and right hand sides of fuzzy intervals that are given by like inequalities.
The parameters and
of the sigmoid function
can be unambiguously given by determining two points of the function curve. The sigmoid function neither takes the value 0, nor the value 1, these are its limits. In practical applications, it may be useful if the function is given by two points which have vertical coordinates close to 0 and 1. Let
be a small positive value, for example
, and
If we wish to take the values of
and
at
and
, respectively, the parameters
and
need to be set as follows:
where
. Let
be three (crisp) numbers so that
If we require
to take the values of
and
at
and
, respectively, and we also require
to take the values of
and
at
and
, respectively, then
need to be set as follows:
Next, if we generate the Dombi intersection of the increasing sigmoid fuzzy membership function and the decreasing sigmoid fuzzy membership function
with the above parameters, then we get the membership function
It can be proven that the function has its maximum at
Furthermore, ; that is, the function
may be viewed as the membership function of the fuzzy number ‘approximately
’. Moreover,
that is, if
is close to zero, then
. Since the parameter
is a small positive number (e.g.
), the membership function
approximates quite well the fuzzy number ‘approximately
’. shows an example of the fuzzy number ‘approximately
’ given by the membership function
.
Figure 3. The cut of the fuzzy number ‘approximately m’.
3.2. A possibilistic representation of the perceived performance
We have shown that the function , for any
, approximates the truth of the
soft equality quite well, so we can represent
by the function
. Since
for any
, and
is strictly monotonously increasing, if
; and it is strictly monotonously decreasing, if
, there are exactly two places,
, and
, at which the membership function
takes the value of
, where
. Thus, the
cut of
is the interval
; that is,
Owing to the construction of the function
, the approximate values of
, and
can be computed from the left-hand side and right-hand side sigmoid components of
:
When ‘approximately
’ is utilised for describing a perceived performance, and the fuzzy number ‘approximately
’ is given by the membership function
, then the left- and right ends of the
cut interval of
, respectively,
, and
, can be interpreted as follows. If the perceived performance is between
and
, then the truth level of the statement that the performance is ‘approximately
’ is at least
.
shows a graphical example of the above-mentioned interpretation of , and
.
4. Case study
4.1. Fuzzy Likert scale based evaluation of teaching performance
Based on the favourable properties of fuzzy Likert scales, that can help to overcome the difficulties associated with the peer review process, some aspects of the applied questionnaire have been evaluated by using a fuzzy scale parallel to the traditional Likert scale during the fall semester 2016. Based on various feedbacks, the evaluation dimensions related to the delivery of the lectures have been selected for this purpose, since these dimensions have turned out to be the most difficult to evaluate on a traditional scale. In case of five evaluated lecturers, three reviewers have been asked to express their judgement on a fuzzy Likert scale regarding the dimensions mentioned previously. The scale has been applied with a division of 0.25 units in order to allow the reviewers a more precise reflection of their judgement. Altogether 135 fuzzy evaluations have been collected representing three reviewers’ opinion of performance of five selected reviewees in nine evaluation dimensions listed above. It can be concluded that the reviewers have not experienced any difficulties when making their evaluation; Gil, Lubiano, De Sáa, and Sinova (Citation2015) have come to the same conclusion.
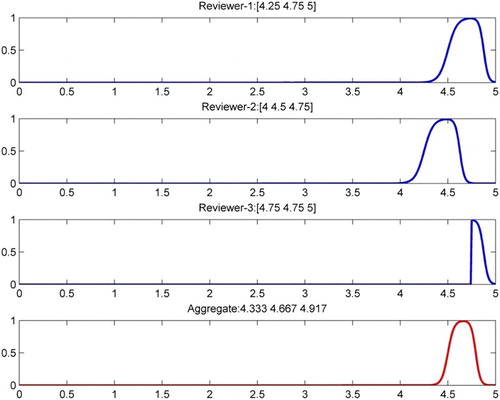
The following figure () illustrates the fuzzy numbers (represented by blue curves) used to evaluate Lecturer 1’s performance as well as the aggregate fuzzy evaluation (denoted by the red curve) in the dimension entitled Learning, explaining the terminology.
Figure 4. Fuzzy numbers based evaluation of dimension Learning, explaining the terminology in case of Lecturer 1.
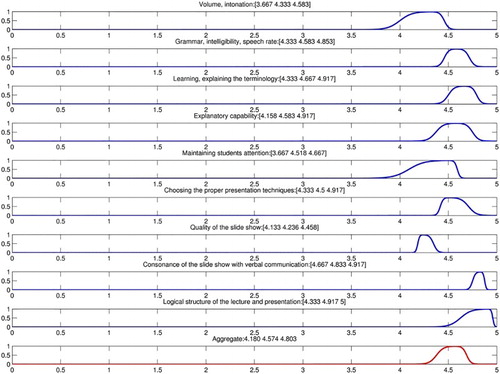
The aggregate evaluations of the other dimensions in case of Lecturer 1 have been computed similarly. represents the aggregated fuzzy evaluations in each dimension as well as the average evaluation of the dimensions, which represents the average evaluation of Lecturer 1’s performance.
Figure 5. Fuzzy numbers based evaluations of Lecturer 1.
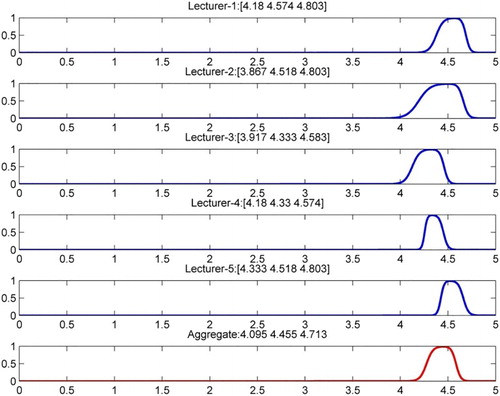
The average evaluations for all involved lecturers are presented in . Based on the evaluations shown in , Lecturer 1, 2 and 5 has approximately the same performance, however, in case of Lecturer 1 and 2, the performance or the judgement of the reviewers is more unbalanced. Based on the traditional Likert scale-based evaluation, however, it was almost impossible to make a distinction between their performance levels.
Figure 6. Aggregate evaluations of the 5 selected lecturers by fuzzy numbers.
Aggregate evaluations can be computed not only for a given lecturer, but for a specific dimension as well. Based on the evaluation of the five involved lecturers, the average judgements in each dimension are presented and listed in . contains the parameters of fuzzy numbers and the average of crisp evaluations given on a traditional Likert scale by the same reviewers in each dimension. It can be concluded that the means of crisp evaluations and the centres of fuzzy numbers do not differ significantly.
Figure 7. The average evaluations of five involved lecturers’ performance in each dimension.
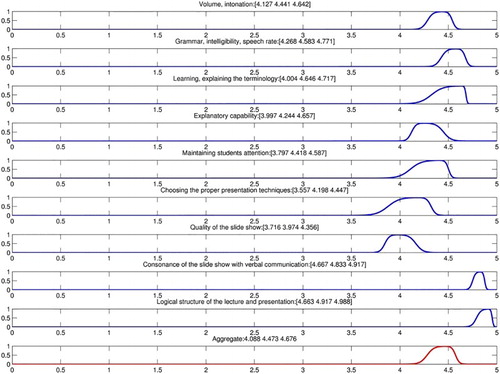
Table 1. Parameters of fuzzy numbers, means and 95% confidence intervals of crisp evaluations representing the average evaluations in each dimension used to evaluate lecturers’ performance.
4.2. Discussion of findings
The main benefit of applying fuzzy numbers to evaluate lecturers’ performance is their ability to model the imprecision and the uncertainty inherent in reviewers’ evaluation as well the representation of the variation of performance. Based on – it can be concluded that the performances of the observed lecturers are unbalanced and reviewers have different perceptions on their performance as well. Utilising traditional Likert scale based evaluation, it is almost impossible to capture accurately this variation of the performance (see and ). As the case study demonstrates, the centres of fuzzy numbers do not differ significantly from the means of crisp evaluations. Despite the fact that fuzzy evaluations do not differ more than half a unit, the information encoded in fuzzy evaluations supports well the identification of areas need to be improved. Moreover, the evaluation dimensions, which turned out to be more unbalanced, were also downgraded by students, further emphasising the need for improvement in these areas. Having investigated the evaluation dimensions in case of which fuzzy numbers indicate a greater diversity and taking the narrative feedbacks of previous evaluations into account, it can be concluded that the variation of the observed lecturer’s performance could be expressed on a fuzzy scale, since the fuzzy numbers are spread out in those dimensions in which the previous narrative comments indicated a more unbalanced performance. That is, by offering the opportunity to use a fuzzy Likert scale to evaluate the observed lecture, reviewers can express their uncertainty and the variability of the observed colleague’s performance during a single lecture in a quantitative way.
5. Conclusions and managerial implications
Based on the first results it can be concluded that the presented fuzzy judgement can help the university staff to overcome several difficulties associated with peer evaluations. It is beneficial from the faculty’s point of view, namely, it allows comparisons between different lecturers’ performance and the identification of best practices and weaknesses as well. Based on the encouraging results, applying fuzzy evaluation in the peer review process may be considered as a viable technique.
5.1. Practical implications
By applying fuzzy numbers for peer reviewing, the faculty can decrease the amount of narrative comments as well, which is beneficial from the statistical point of view of the analyses and allows more information to be taken into account when comparing different lecturers’ performance and identifying best practices.
Besides peer evaluation, the application of the presented methodology may arise in evaluations where Likert-type scales are applied traditionally. The most desirable way is to extend the application of fuzzy scales to student satisfaction measurement, since students face similar difficulties when evaluating courses, which results not only in a low response rate, but also in less reliable information. Moreover, students usually have various perceptions on teaching quality which cannot be measured by a single number on a traditional scale. By applying fuzzy numbers, students can choose more than one single value which represents their opinion, for example, their optimistic and pessimistic judgement on the teachers’ performance.
5.2. Limitations and further research plans
Besides feeding back the results to the peer reviewed lecturers, student satisfaction or course evaluation results should be continually monitored and compared to the results of the peer review programme. In order to evaluate the ultimate impact of peer reviewing on teaching performance and the effectiveness of fuzzy Likert scales used for this purpose, relationships between the results of peer reviewing and student satisfaction surveys should be further investigated. Extending fuzzy evaluations to student satisfaction may result in a more detailed investigation of cause and effect relationships as well. Fuzzy regression (Alfonso, López, de Hierro, & Roldán, Citation2016) or fuzzy inference systems (e.g. Hammed, Citation2011; Jónás & Árva, Citation2016) would be a suitable tool to deal with this challenge.
Disclosure statement
No potential conflict of interest was reported by the authors.
References
- Alfonso, G., López, R., de Hierro, A. F., & Roldán, C. (2016). A fuzzy regression model based on finite fuzzy numbers and its application to real-world financial data. Journal of Computational and Applied Mathematics, 24(2), 344–359.
- Amini, S., & Jochem, R. (2011). A conceptual model based on the fuzzy set theory to measure and evaluate the performance of service processes. Paper presented at enterprise distributed object computing conference workshops (EDOCW), 29 Aug–2 Sept 2011, Helsinki, Finland, pp. 122–131.
- Andayani, S., Hartati, S., Wardoyo, R., & Mardapi, D. (2017). Decision-making model for student assessment by unifying numerical and linguistic data. International Journal of Electrical and Computer Engineering, 7(1), 363–373.
- Başaran, M. A., Kalaycı, N., & Atay, M. T. (2011). A novel hybrid method for better evaluation: Evaluating university instructors teaching performance by combining conventional content analysis with fuzzy rule based systems. Expert Systems with Applications, 38(10), 12565–12568. doi: 10.1016/j.eswa.2011.04.043
- Battisti, F., Nicolini, G., & Salini, S. (2005). The Rasch model to measure service quality. The ICFAI Journal of Services Marketing, 3(3), 58–80.
- Battisti, F., Nicolini, G., & Salini, S. (2010). The Rasch model in customer satisfaction survey data. Quality Technology & Quantitative Management, 7(1), 15–34. doi: 10.1080/16843703.2010.11673216
- Berk, R. A. (2005). Survey of 12 strategies to measure teaching effectiveness. International Journal of Teaching and Learning in Higher Education, 17(1), 48–62.
- Blackmore, J. A. (2005). A critical evaluation of peer review via teaching observation within higher education. International Journal of Educational Management, 19(3), 218–232.
- Brent, R., & Felder, R. M. (2004). A protocol for peer review of teaching. Education designs, North Carolina State University, Session 3530.
- Brochado, A. (2009). Comparing alternative instruments to measure service quality in higher education. Quality Assurance in Education, 17(2), 174–190. doi: 10.1108/09684880910951381
- Büyüközkan, G., Ruan, D., & Feyzioğlu, O. (2007). Evaluating e-learning web site quality in a fuzzy environment. International Journal of Intelligent Systems, 22(5), 567–586. doi: 10.1002/int.20214
- Cabrerizo, F. J., López-Gijón, J., Martínez, M. A., Morente-Molinera, J. A., & Herrera-Viedma, E. (2017). A fuzzy linguistic extended LibQUAL+ model to assess service quality in academic libraries. International Journal of Information Technology & Decision Making, 16(1), 225–244. doi: 10.1142/S0219622015500406
- Calcagnì, A., & Lombardi, L. (2014). Dynamic fuzzy rating tracker (DYFRAT): A novel methodology for modeling real-time dynamic cognitive processes in rating scales. Applied Soft Computing, 24, 948–961. doi: 10.1016/j.asoc.2014.08.049
- Carrasco, R. A., Villar, P., Hornos, M. J., & Herrera-Viedma, E. (2011). A linguistic multi-criteria decision making model applied to the integration of education questionnaires. International Journal of Computational Intelligence Systems, 4(5), 946–959. doi: 10.1080/18756891.2011.9727844
- Chang, T. C., & Wang, H. (2016). A multi criteria group decision-making model for teacher evaluation in higher education based on cloud model and decision tree. Eurasia Journal of Mathematics, Science & Technology Education, 12(5), 1243–1262.
- Chen, T. C. (2001). Applying linguistic decision-making method to deal with service evaluation problems. International Journal of Uncertainty, Fuzziness and Knowledge Based Systems, 9(1), 103–114. doi: 10.1142/S0218488501001022
- Courneya, C. A., Pratt, D. D., & Collins, J. (2008). Through what perspective do we judge the teaching of peers? Teaching and Teacher Education, 24, 69–79. doi: 10.1016/j.tate.2007.01.009
- Deng, W. J. (2008). Fuzzy importance-performance analysis for determining critical service attributes. International Journal of Service Industry Management, 19(2), 252–270. doi: 10.1108/09564230810869766
- de Sáa, S. D. L. R., Gil, MÁ, González-Rodríguez, G., López, M. T., & Lubiano, M. A. (2015). Fuzzy rating scale-based questionnaires and their statistical analysis. IEEE Transactions on Fuzzy Systems, 23(1), 111–126. doi: 10.1109/TFUZZ.2014.2307895
- De Witte, K., & Rogge, N. (2011). Accounting for exogenous influences in performance evaluations of teachers. Economics of Education Review, 30(4), 641–653. doi: 10.1016/j.econedurev.2011.02.002
- Dombi, J. (2008). Towards a general class of operators for fuzzy systems. IEEE Transactions on Fuzzy Systems, 16(2), 477–484. doi: 10.1109/TFUZZ.2007.905910
- Dombi, J. (2009). Pliant arithmetics and pliant arithmetic operations. Acta Polytech Hun, 6(5), 19–49.
- Ellis, L., Burke, D. M., Lomire, P., & McCormack, D. R. (2003). Student grades and average ratings of instructional quality: The need for adjustment. The Journal of Educational Research, 97(1), 35–40. doi: 10.1080/00220670309596626
- Frühwirth-Schnatter, S. (1992). On statistical inference for fuzzy data with applications to descriptive statistics. Fuzzy Sets and Systems, 50, 143–165. doi: 10.1016/0165-0114(92)90213-N
- Gil, M. Á., & González-Rodríguez, G. (2012). Fuzzy vs. Likert scale in statistics. In E. Trillas, P. P. Bonissone, L. Magdalena, & J. Kacprzyk (Eds.), Combining experimentation and theory (pp. 407–420). Berlin, Heidelberg: Springer.
- Gil, M. Á., Lubiano, M. A., De Sáa, S. D. L. R., & Sinova, B. (2015). Analyzing data from a fuzzy rating scale-based questionnaire. A case study. Psicothema, 27(2), 182–191.
- Hammed, I. A. (2011). Using Gaussian membership functions for improving the reliability and robustness of students’ evaluation systems. Expert Systems with Applications, 38, 7135–7142. doi: 10.1016/j.eswa.2010.12.048
- Hartley, J. (2014). Some thoughts on Likert-type scales. International Journal of Clinical and Health Psychology, 14(1), 83–86. doi: 10.1016/S1697-2600(14)70040-7
- Herrera, F., & Herrera-Viedma, E. (2000). Choice functions and mechanisms for linguistic preference relations. European Journal of Operational Research, 120(1), 144–161. doi: 10.1016/S0377-2217(98)00383-X
- Herrera, F., López, E., Mendana, C., & Rodríguez, M. A. (1999). Solving an assignment–selection problem with verbal information and using genetic algorithms. European Journal of Operational Research, 119(2), 326–337. doi: 10.1016/S0377-2217(99)00134-4
- Hesketh, B., Pryor, R., Gleitzman, M., & Hesketh, T. (1988). Practical applications and psychometric evaluation of a computerized fuzzy graphic rating scale. Advances in Psychology, 56, 425–454. doi: 10.1016/S0166-4115(08)60493-8
- Ihsan, A. K. A. M., Taib, K. A., Talib, M. Z. M., Abdullah, S., Husain, H., Wahab, D. A., … Abdul, N. A. (2012). Measurement of course evaluation for lecturers at the faculty of engineering and built environment. Procedia – Social and Behavioral Sciences, 60, 358–364. doi: 10.1016/j.sbspro.2012.09.391
- Jónás, T., & Árva, G. (2016). Application of fuzzy inference systems build from data for quality and service management purposes. In S. M. Dahlgaard-Park & J. J. Dahlgaard (Eds.), 19th QMOD-ICQSS conference international conference on quality and service sciences. Roma, Italy, 21.09.2016–23.09.2016. Lund University Library Press, Lund, pp. 519–534.
- Kacprzyk, J. (1986). Towards a ‘human-consistent’ multistage decision making and control models using fuzzy sets and fuzzy logic. Fuzzy Sets and Systems, 18(3), 299–314. doi: 10.1016/0165-0114(86)90008-4
- Kuzmanovic, M., Savic, G., Popovic, M., & Martic, M. (2013). A new approach to evaluation of university teaching considering heterogeneity of students’ preferences. Higher Education, 66(2), 153–171. doi: 10.1007/s10734-012-9596-2
- Lalla, M., Facchinetti, G., & Mastroleo, G. (2005). Ordinal scales and fuzzy set systems to measure agreement: An application to the evaluation of teaching activity. Quality & Quantity, 38(5), 577–601. doi: 10.1007/s11135-005-8103-6
- Li, Q. (2013). A novel Likert scale based on fuzzy sets theory. Expert Systems with Applications, 40(5), 1609–1618. doi: 10.1016/j.eswa.2012.09.015
- Liaw, S. H., & Goh, K. L. (2003). Evidence and control of biases in student evaluations of teaching. International Journal of Educational Management, 17(1), 37–43.
- Lin, H. F. (2010a). An application of fuzzy AHP for evaluating course website quality. Computers & Education, 54(4), 877–888. doi: 10.1016/j.compedu.2009.09.017
- Lin, H. T. (2010b). Fuzzy application in service quality analysis: An empirical study. Expert Systems with Applications, 37(1), 517–526. doi: 10.1016/j.eswa.2009.05.030
- Liou, T. S., & Chen, C. W. (2006). Subjective appraisal of service quality using fuzzy linguistic assessment. International Journal of Quality & Reliability Management, 23(8), 928–943. doi: 10.1108/02656710610688149
- Liu, R., Cui, L., Zeng, G., Wu, H., Wang, C., Yan, S., & Yan, B. (2015). Applying the fuzzy SERVQUAL method to measure the service quality in certification and inspection industry. Applied Soft Computing, 26, 508–512. doi: 10.1016/j.asoc.2014.10.014
- Lozano, L. M., García-Cueto, E., & Muñiz, J. (2008). Effect of the number of response categories on the reliability and validity of rating scales. Methodology, 4(2), 73–79. doi: 10.1027/1614-2241.4.2.73
- Lubiano, M. A., de Sáa, S. D. L. R., Montenegro, M., Sinova, B., & Gil, M. Á. (2016). Descriptive analysis of responses to items in questionnaires. Why not using a fuzzy rating scale? Information Sciences, 360, 131–148. doi: 10.1016/j.ins.2016.04.029
- Lupo, T. (2013). A fuzzy ServQual based method for reliable measurements of education quality in Italian higher education area. Expert Systems with Applications, 40(17), 7096–7110. doi: 10.1016/j.eswa.2013.06.045
- Lupo, T. (2016). A fuzzy framework to evaluate service quality in the healthcare industry: An empirical case of public hospital service evaluation in Sicily. Applied Soft Computing, 40, 468–478. doi: 10.1016/j.asoc.2015.12.010
- Mashhadiabdol, M., Sajadi, S. M., & Talebi, K. (2014). Analysis of the gap between customers’ perceptions and employees’ expectations of service quality based on fuzzy SERVQUAL logic (case study: Mofid children’s hospital in Tehran, Iran). International Journal of Services and Operations Management, 17(2), 119–141. doi: 10.1504/IJSOM.2014.058840
- Murray, J. (2013). Likert data: What to use, parametric or non-parametric. International Journal of Business and Social Science, 4(11), 258–264.
- Nadiri, H., Kandampully, J., & Hussain, K. (2009). Students’ perceptions of service quality in higher education. Total Quality Management, 20(5), 523–535. doi: 10.1080/14783360902863713
- Quirós, P., Alonso, J. M., & Pancho, D. P. (2016). Descriptive and comparative analysis of human perceptions expressed through fuzzy rating scale-based questionnaires. International Journal of Computational Intelligence Systems, 9(3), 450–467. doi: 10.1080/18756891.2016.1175811
- Rouyendegh, B. D., & Erkan, T. E. (2013). An application of the fuzzy ELECTRE method for academic staff selection. Human Factors and Ergonomics in Manufacturing & Service Industries, 23(2), 107–115. doi: 10.1002/hfm.20301
- Samson, S., & McCrea, D. E. (2008). Using peer review to foster good teaching. Reference Services Review, 36(1), 61–70. doi: 10.1108/00907320810852032
- Sowa, J. F. (2013). What is the source of fuzziness? In R. Seiging, E. Trillas, C. Moraga, & S. Termini (Eds.), On fuzziness (pp. 645–652). Berlin, Heidelberg: Springer.
- Teeroovengadum, V., Kamalanabhan, T. J., & Seebaluck, A. K. (2016). Measuring service quality in higher education: Development of a hierarchical model (HESQUAL). Quality Assurance in Education, 24(2), 244–258. doi: 10.1108/QAE-06-2014-0028
- Tóth Zs, E., Andor, G., & Árva, G. (2017a). Peer review of teaching at Budapest University of technology and economics - faculty of economic and social sciences. International Journal of Quality and Service Sciences, 9(3/4), 402–424. doi: 10.1108/IJQSS-02-2017-0014
- Tóth Zs, E., Surman, V., & Árva, G. (2017b). Challenges in course evaluations at Budapest University of Technology and Economics. In Z. Bekirogullari, M. Y. Minas, & R. X. Thambusamy (Eds.), 8th ICEEPSY - International conference on education and educational psychology. Porto, Portugal, 2017.10.11–2017.10.14. Future Academy, 2017, pp. 629–641.
- Washer, P. (2006). Designing a system for observation of teaching. Quality Assurance in Education, 14(3), 243–250. doi: 10.1108/09684880610678559
- Yu, C. M., Tsang, H. T., & Chen, K. S. (2016). Developing a performance evaluation matrix to enhance the learner satisfaction of an e-learning system. Total Quality Management & Business Excellence, 1–19. Published online 19 Sept 2016. http://doi.org/10.1080/14783363.2016.1233809.
- Zhang, J., Lin, T., & Ren, L. (2010). Dynamic fuzzy evaluation for e-commerce service quality based on the SERVPERF. Paper presented at the International Conference on E-Business and E-Government 2010 (ICEE), pp. 576–579. Retrieved from http://ieeexplore.ieee.org/document/5590689/