
 ?Mathematical formulae have been encoded as MathML and are displayed in this HTML version using MathJax in order to improve their display. Uncheck the box to turn MathJax off. This feature requires Javascript. Click on a formula to zoom.
Abstract
Purpose: The main purpose of this paper is to introduce a flexible fuzzy number based methodology in order to enhance the reliability of traditional Likert scale based evaluations related to the measurement and evaluation of service quality, particularly in the healthcare context. Methodology: Due to the problems arising with the application of traditional Likert scales and to the methodological issues when interpreting the results, the concept of fuzzy scales is increasingly applied in service quality context by adding properties to Likert scales to model human judgement and thinking more precisely and reliably. The proposed fuzzy rating scale based methodology is built on the novelty of presenting multiform fuzzy numbers and by that means the inherent uncertainty, subjectivity and vagueness characterising healthcare stakeholders’ perceptions related to service features could be reflected in various ways. Relevance/findings: The main benefit of the methodology is the ability to model the imprecision and the uncertainty inherent in human evaluations as well as the representation of performance variation in case of specific service features. By being able to express overall evaluations as well, the proposed methodology can be applied to contrast different stakeholders’ perceptions compared to mainly patient-centred adaptations. A demonstrative healthcare example is also included to highlight these methodological benefits. Research implications: The application of the presented methodology may arise in any kind of service quality evaluations where Likert-type scales are applied traditionally. Originality/Value: By providing a fuzzy Likert scale to evaluate specific healthcare service attributes, patients and employees can express their uncertainty, contrasting perceptions and the variability of service features in a quantitative way and they also become comparable in certain aspects. On the other hand, fuzzy evaluation based results support healthcare decision-makers to facilitate effective, efficient and well-grounded strategies related to service quality improvements.
1. Introduction
In all service organisations service quality does matter. As healthcare delivery systems have been undergoing momentous transformation in recent decades all over Europe, quick shift towards systems of managed care has led healthcare providers to recognise that powerful marketisation has been seriously taking place. While significant progress has been made in healthcare worldwide by utilising e.g. accreditation systems, quality management programmes, clinical audit, patient safety systems, clinical practice guidelines and various performance indicators, etc. (e.g. Groene, Botje, Sunol, Lopez, & Wagner, Citation2013), quality issues still persist in healthcare. In order to be successful, it becomes increasingly important to provide healthcare recipients with services that meet or exceed their expectations. To serve that need, it is crucial to have a better understanding of service quality perceptions of both recipients and providers when shaping the healthcare delivery system.
In order to evaluate the quality of services and to ascertain reliably whether the needs and requirements of the various stakeholders primarily that of patients are met it is fundamental that their expectations and perceptions are properly measured and correctly understood (Lupo, Citation2013). In order to serve that purpose, there is a need to design suitable and reliable evaluation methodologies and to identify appropriate measurement units to highlight the achieved service performance level (Battisti, Nicolini, & Salini, Citation2010; Lupo, Citation2013).
Measuring service quality, the satisfaction of stakeholders and the relative importance of service features in healthcare are mainly realised through the application of Likert scales by either utilising the original SERVQUAL methodology (Parasuraman, Zeithaml, & Berry, Citation1988) or its various healthcare modifications (e.g. Vandamme & Leunis, Citation1993; Ramsaran-Fowdar, Citation2008; Al-Borie & Damanhouri, Citation2013). This popularity of Likert scales is primarily owing to the fact that they are easy to conduct and their utilisation usually does not require special training. On the contrary, many researchers have recently underlined that Likert scales are imprecise from a methodological point of view as they contain a high degree of fuzziness and also consider respondents’ judgements in crisp numbers. In order to view human perceptions, the fuzzy set theory is increasingly applied in these situations as they can improve successfully the reliability of service process measurements and evaluations (Lin, Citation2010; Li, Citation2013; Lupo, Citation2016).
Besides the issues arising with the application of Likert scales and the interpretation of evaluation results, our research also deals with the extension of service quality evaluations in healthcare institutions. Most healthcare adaptations of SERVQUAL and other service quality models principally bring patient satisfaction and patient perceptions of service quality to the fore. There are far fewer studies focusing on other stakeholders, namely, on healthcare workers (primarily on nurses, e.g. Lee & Yom, Citation2007; Tsai, Wu, & Tsai, Citation2018) and thereby fewer studies deal with the impact of patients’ and employees’ perceptions on each other (e.g. Lee, Lee, & Kang, Citation2012).
Therefore, the purpose of this paper is two-fold. On the one hand, our aim is to develop a framework for evaluating healthcare service features specially adapted to inpatient units dealing with the possible confrontation of patients’ and healthcare workers’ perceptions. On the other hand, the utilisation of flexible fuzzy numbers for evaluation purposes can enhance the reliability of Likert scale based evaluations. By providing a fuzzy rating scale to evaluate service attributes, patients, healthcare employees and other stakeholders of the healthcare system can express their uncertainty, their contrasting perceptions and the variability of the rated service attribute in a quantitative way. Moreover, the judgements and perceptions of the different stakeholders in healthcare become comparable in a more reliable way.
The paper is structured as follows. The next section provides the state of the art of the relevant literature related to the measurement and evaluation of healthcare service features and to the advantages of fuzzy Likert scales compared to traditional Likert scales. Then flexible fuzzy numbers and some of their properties are introduced, and the applied methodology is detailed. Finally, a brief healthcare example demonstrates the advantages provided by the proposed methodology. In the end, some important conclusions are also drawn and further research directions are outlined.
2. Literature review
Service quality is defined as the difference between expected and perceived service (Parasuraman, Zeithaml, & Berry, Citation1985). The five-dimensional structure of SERVQUAL (Parasuraman et al., Citation1988) has earned a great popularity in the healthcare industry as both the original methodology and its variously modified versions are widely applied for measuring and evaluating service quality in several specific fields of healthcare which has led to a wide range of service quality interpretations proposed in healthcare context. (see. e.g. Bowers, Swan, & Koehler, Citation1994; Mostafa, Citation2005; Yesilada & Direktor, Citation2010; Lee, Citation2017). The Institute of Medicine (Citation2001) has also made a considerable contribution to the internationally mutual understanding of quality in healthcare by conceptualising it with six dimensions, namely, safety, timeliness, efficiency, equity and patient centeredness (known also as STEEP acronym).
Quality of care is also often categorised into technical (referring to what is delivered) and functional (focusing on how care is delivered) quality. When it comes to evaluating perceived service quality, functional quality comes to the forefront rather than the technical (Grönroos, Citation1984; Giovanis, Pierrakos, Rizomyliotis, & Binioris, Citation2018). However, technical and functional quality interrelate as healthcare processes are provided by healthcare workers and the results are obtained by the condition of the patient after treatments. Therefore, these two aspects are evaluated differently by the patient. Since the degree of what the patient feels before and after the treatment varies, the perception of service quality may be different for each patient. Both technical and functional quality have its role in quality improvement plans, verifying functional quality with technical quality standards offers researchers and policymakers the opportunity to identify expectations of patients and healthcare providers, and determine more comprehensive quality improvement actions. In order to link the basic concepts of the two schools, the SERVQUAL methodology primarily focus on the functional aspects of quality.
2.1. Role of patients and employees in assessing service features
It is no question that patients are the main stakeholders, therefore, the most popular method is to collect patient satisfaction and/or perception data to evaluate the characteristics and quality of healthcare services in an institution. Several studies (e.g. Berwick, Citation2009; Miranda, Chamorro, Murillo, & Vega, Citation2012; Turan & Bozaykut-Bük, Citation2016; Giovanis et al., Citation2018) have argued that the feedback of patients serve as an information resource for measuring, evaluating and developing the quality of healthcare service delivery and therefore, contributes significantly and directly to healthcare improvements.
However, assessing patients’ perceptions and satisfaction is of utmost importance, several challenges arise when patient experience is evaluated. Due to the existence of information asymmetry, patients have less clinical knowledge and do not have that quantity and quality of information that is needed to make a responsible decision about their therapy and recovery. Furthermore, the patient may judge the quality of care and the service performance influenced mainly by interpersonal relations and behaviours of healthcare workers performing the care (e.g. Raharjo, Mugion, Di Pietro, & Toni, Citation2016; Vogus & McClelland, Citation2016).
In terms of patients’ satisfaction, employees in healthcare institutions including doctors, nurses and other medical staff have the most significant impact (e.g. Naik, Anand, & Bashir, Citation2015). Schneider, Parkington, and Buxton (Citation1980) establish the linkage between customer and employee perceptions of service quality suggesting that the voices of employees should also be listened to during the process of evaluating and diagnosing a service organisation.
Yoon, Choi, and Park (Citation2007) suggest that employees as internal customers should be able to assess service quality for better patient outcome. Therefore, service quality can also be measured by employees who actually provide service to the patients as service quality can be improved by the efforts of employees. Thus the evaluation of healthcare quality should include not only the patient perspective but that of healthcare workers as well. In accordance with that e.g. Lowe (Citation2012), Lee et al. (Citation2012), Pantouvakis and Mpogiatzidis (Citation2013), Mosadeghrad (Citation2014), Tsai et al. (Citation2018) propose models that take different internal stakeholders’ views into consideration when assessing healthcare service quality attributes.
As the different service attributes have unequal impacts on customers’ quality perceptions or on their satisfaction (Johnston, Citation1995), the same logic can be applied to internal customer service quality. Thus, it is important to identify which features are more crucial than others in enhancing the level of overall internal service quality as perceived by internal customers, and to measure to what extent they should be. By addressing these issues, internal ‘suppliers’ can understand what service areas they should concentrate on to effectively improve the internal service quality and internal customer satisfaction (Oliva, Oliver, & MacMillan, Citation1992).
As a conclusion, we may state that both patients’ and employees’ perspectives are needed since they assess different aspects of the quality of care. Healthcare professionals assess more the technical quality, while patients evaluate more the functional quality. Healthcare organisations primarily focus on delivering technical quality, but do not pay sufficient attention to functional quality, that is, how the patient receives and experiences the service (Kenagy, Berwick, & Shore, Citation1999).
2.2. Problems related to the application of Likert scales
Frequently, the subject of service quality is burdened by fuzzy terms such as attitude, perception, satisfaction, etc. Respondents may fill out the questionnaire subjectively based on their unique experience. This subjective assessment is intrinsically imprecise and ambiguous, possibly inhibiting service quality (Liou & Chen, Citation2006). These methodologies utilise Likert scales by using crisp values to present patients’ and other surveyed stakeholders’ feelings and perceptions related to specific SQ dimensions (Hu, Lee, & Yen, Citation2010). However, due to intangible and subjective information embedded in the evaluation process, crisp values are inadequate to present the evaluation given by customers.
The problems related to the application of traditional Likert scales are diversified. The reliability of Likert-type scales decreases as the number of response options is reduced, because the variability of the scale is also reduced (Lozano, García-Cueto, & Muñiz, Citation2008). When Likert-type data are analysed for statistical purposes, the number of applicable techniques are quite limited (Lubiano, de Sáa, Montenegro, Sinova, & Gil, Citation2016). The weighting of aspects is a major issue as they are usually not equally important for the respondents. An additional concern arising with expressing overall evaluations is the fact that respondents’ attitudes towards the rated item are not homogeneous as time goes on (e.g. Tóth Zs, Surman, & Árva, Citation2017). If raters’ preferences are heterogeneous, it matters how and to what extent it influences the overall evaluation of a rated item.
In order to overcome these difficulties, the concept of fuzzy scale has been introduced with the aim of adding properties to nominal and ordinal scales (Benoit & Foulloy, Citation2003) that can handle uncertainty in case of weakly defined measurements (Benoit, Citation2013; Calcagní & Lombardi, Citation2014). This fuzzy assessment of service quality is much closer to human thinking than the methods based on crisp numbers (Lin & Wu, Citation2008). One group of approaches (Lubiano et al., Citation2016) apply the fuzzy rating scale as an a priori tool to directly assess fuzzy values (see e.g. Hesketh, Pryor, Gleitzman, & Hesketh, Citation1988; de la Rosa de Sáa, Gil, González-Rodríguez, López, & Lubiano, Citation2015).
In the service quality literature several initiatives confirm the recent shift towards the utilisation of fuzzy ratings (Lin, Citation2010). Fuzzy set theory has been increasingly utilised in healthcare service quality evaluations as well (e.g. Hu et al., Citation2010; Büyüközkan, Çifçi, & Güleryüz, Citation2011; Woldegebriel, Kitaw, & Rafele, Citation2015; Lupo, Citation2016; Behdioğlu, Acar, & Burhan, Citation2017; Singh & Prasher, Citation2017).
3. Methodology
In order to be able to confront the perceptions of patients and healthcare workers reliably, the following methodology is able to deal with problems related to Likert scales. Due to intangible and subjective information embedded in the evaluation process, crisp values applied during Likert scale evaluations are inadequate to present the ratings of the different stakeholders (Liou & Chen, Citation2006). This means that people carrying out the analysis of these evaluations would have difficulties in understanding the differences and uncertainties in human’s semantic expression. In the light of these considerations a methodology based on a fuzzy rating scale utilising flexible fuzzy numbers is developed to handle the weaknesses of traditional Likert scale based evaluations in order to assess specific healthcare service attributes.
In our approach, the values on a Likert-scale are represented by fuzzy numbers; that is, instead of expressing an opinion by selecting a particular crisp value on the scale, we allow the evaluator to select an ‘approximately
’ value that is given by a fuzzy number.
3.1. Flexible fuzzy numbers and some of their properties
Definition 1. The membership function of the flexible fuzzy number
is given by
where ,
,
.
The flexible fuzzy number represents the soft equality ‘
is equal to
’ (for more see e.g. Dombi & Jónás, Citation2018). The parameters
and
determine the left-hand side and right-hand side limits of the flexible fuzzy number, respectively; that is, the truth of the statement that ‘
is equal to
’ is zero, if
or
. It can be shown that depending on the value of parameter
the membership function of the fuzzy number
can exhibit various shapes such as triangular (
), bell (
) or ‘reverse bell’ (
). This flexibility of
allows us to represent the vagueness of the performance evaluation in various ways. The parameters can be interpreted as follows. The perceived performance is not less than and not greater than the values of parameters
and
, respectively, while the parameter
may be viewed as the crisp value which represents the most likely perceived performance. shows some membership function plots of flexible fuzzy numbers.
Figure 1. Plots of membership functions of some flexible fuzzy numbers.
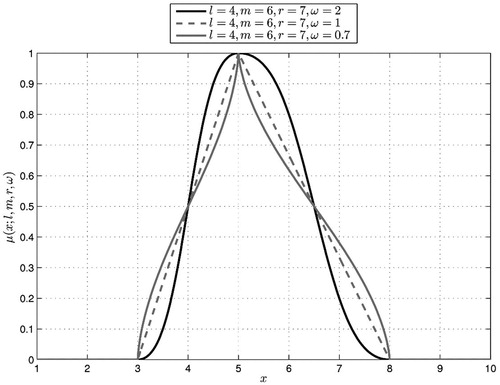
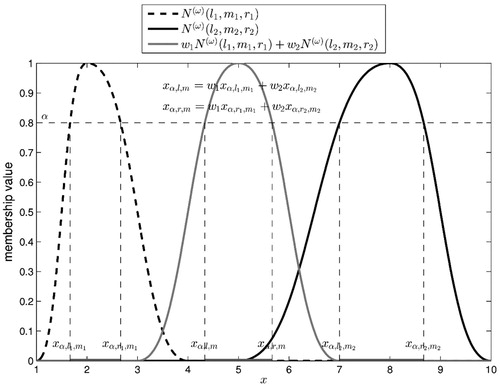
Figure 2. Weighted average of two flexible fuzzy numbers.
Utilising the definition of fuzzy -cut and interval arithmetic operations, the next theorem, which demonstrates a key property of flexible fuzzy numbers allowing us to utilise them in Likert scale-based evaluations, can be proven (
).
Theorem 1. The weighted average of the flexible fuzzy numbers
,
is the flexible fuzzy number
, where
and
Theorem 1 tells us that the weighted sum of flexible fuzzy numbers is a flexible fuzzy number as well; that is, the set of flexible fuzzy numbers is closed under the weighted sum operation.
shows plots of membership functions of the flexible fuzzy numbers and
and a plot of the membership function of their weighted average:
(2)
(2)
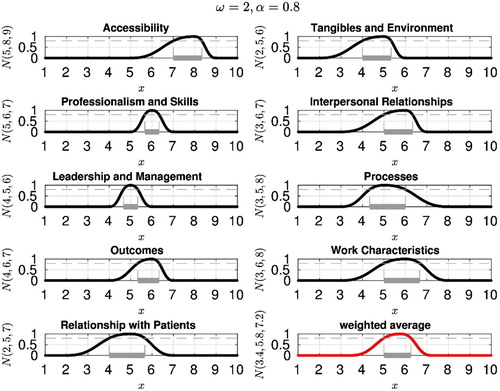
Figure 3. Evaluation of service quality in nine attributes using flexible fuzzy numbers – healthcare workers.
Theorem 1 allows us to utilise the flexible fuzzy numbers for multidimensional evaluation of a service characteristic. Namely, we can evaluate the service in each dimension by a flexible fuzzy number, and then aggregate the results into one flexible fuzzy number which represent the overall goodness of the studied service. Notice that the weighted averaging of flexible fuzzy numbers results a flexible fuzzy number only if the values of parameter are fixed for all the flexible fuzzy numbers.
This fuzzy rating scale based methodology is proposed to handle the weaknesses of Likert scale based evaluations with the aim of assessing specific service attributes more reliably. In this kind of evaluation, the inherent uncertainty, subjectivity and vagueness characterising stakeholders when expressing their own judgements could be handled. This fuzzy evaluation environment aims at supporting healthcare decision-makers in order to facilitate effective and efficient strategies related to service quality improvements by identifying which service features require more consideration. The flexible fuzzy number based methodology introduced in this paper offers a suitable alternative technique for these evaluation goals. Compared to the aforementioned models applied in healthcare context, the novelty of our paper lies in the flexibility of fuzzy numbers, that is, the fuzzy number can present various shapes and therefore, can illustrate uncertainty embedded in evaluation process in various ways.
4. A demonstrative healthcare example
Based on the state of the art in the literature, the long-term goal of our ongoing research is to introduce a model taking the service perceptions of both patients and healthcare workers into consideration. The primary goal is to be able to compare the results originating from the two most important stakeholder groups the collaboration of which is necessary for successful care. When establishing the framework for assessing service features, the methodologies of patient and healthcare worker perception measurement and evaluation and how they relate to each other were developed based on the previous studies of Babakus and Mangold (Citation1992), Bowers et al. (Citation1994), Janicijevic, Seke, Djokovic, and Filipovic (Citation2013) and Lee et al. (Citation2012).
In order to illustrate the application of the introduced flexible fuzzy number based methodology, a healthcare example is introduced. The overall aim of our healthcare research is to compare patients’ and healthcare workers’ perceptions related to service attributes and identify critical ones. Therefore, our framework related to the measurement and evaluation of patients’ and healthcare workers’ perceptions is based on the service features demonstrated in founded on the summary of empirical results originating from the state of the art referenced in details earlier in this paper. In our research, we focus primarily on inpatient services. Taking the information asymmetry, the goals and requirements available between the different stakeholders, there are some service delivery attributes that are common in both cases, while some other features are applied to grab the specialities given in case of specific stakeholder groups. E.g. healthcare workers may give feedback related to professionalism and skills or to leadership and management, while patients do not have enough information and experience to judge these attributes. On the contrary, patients may evaluate care characteristics in the light of their special needs and requirements.
Table 1. Applied service features in our research.
In this example specific service attributes are evaluated by healthcare workers on Likert scales utilising flexible fuzzy numbers. In the framework established for the measurement and evaluation of employees’ perceptions, the statements of the survey have been grouped into nine service attributes including ‘Accessibility’, ‘Tangibles and environment’, ‘Professionalism and skills’, ‘Interpersonal relationships’, ‘Leadership and management’, ‘Processes’, ‘Outcomes’, ‘Work characteristics’ and ‘Relationship with patients’ (see ). In each of these attributes, the evaluation is carried out on a 10-point Likert scale, where value 1 stands for the worst, while value 10 represents the best performance. When expressing their judgement, employees select three values, namely the values of ,
and
on this Likert scale. These three values related to each attribute express that the service performance in the given service attribute is not worse than
, mostly has the value of
, and is not better than
. As a result of the valuations carried out this way and with the pre-set value of the parameter
, a flexible fuzzy number is determined.
In the above-indicated features of service are represented by flexible fuzzy numbers as ,
,
,
,
,
,
,
and
, respectively, while parameter
has the value of 2. According to the introduced methodology, the flexible fuzzy number generally denoted as
express the truth value of the statement that ‘
is equal to
’. This truth value is 0, if
or
, and the truth value is 1, if
. Therefore, for example, the fuzzy number
, which represents the performance in ‘Accessibility’ is around 8, but it is not worse than 5, and it is not better than 9. By using the traditional evaluation, it would denote only that performance in this specific attribute is given by a crisp value of 8. Flexible fuzzy number-based evaluation carries much more information compared to the traditional Likert scale based evaluation as in this case the perceived performance is between 5 and 9, and usually has the value of 8.
Furthermore, another important consequence, which can be drawn based on the application of flexible fuzzy numbers when judging quality attributes, can be demonstrated by the followings. Taking the ‘Leadership and management’ attribute into consideration, the left hand limit and the right hand limit of the fuzzy number are of equal distance from 5 (see ) which means that the performance in this attribute differs from 5 with the same likelihood in either directions. While in case of ‘Accessibility’ with the fuzzy number
the left hand limit is more distant from 8 than the right hand limit expressing that the performance in this attribute is more likely to be lower than 8 than higher. These examples highlight that the
width of the flexible fuzzy number
may generally be viewed as an indication of performance instability, while the asymmetry of
provides information about the direction that the performance more likely tends to differ from the value of
. It means that utilising a flexible fuzzy number for evaluation purposes on a Likert scale allows the assessors to express their uncertainty when judging performance more precisely.
shows not only the flexible fuzzy number-based evaluation for the nine previously addressed service attributes, but also the overall service performance as it may be computed as the weighted average of the attribute specific evaluation results according to the proposed methodology. That is, the weighted average of nine flexible numbers produces the aggregate performance results from the viewpoint of healthcare workers. In our example, each service attribute has the same weight and so the aggregate result was computed as the arithmetic average of the attribute specific evaluation results. The flexible fuzzy number (cited as ‘weigthed average’ in ) illustrating the aggregate performance of the evaluated service can be interpreted so that the aggregate performance of the service lies between 3.4 and 7.2 and its most likely value is 5.8 in case of healthcare workers.
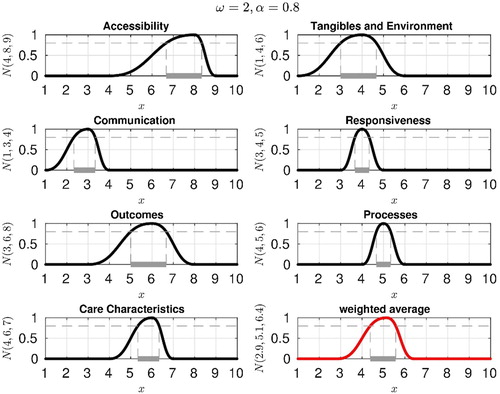
If we follow the same logic both with the evaluation process and the proposed methodology, depicts the results of an evaluation process carried out by patients. The seven attributes applied in the case of patients include ‘Accessibility’, ‘Tangibles and Environment’, ‘Communication’, ‘Responsiveness’, ‘Outcomes’, ‘Processes’ and ‘Care Characteristics’. The flexible fuzzy numbers indicating the evaluation results in these seven cases are ,
,
,
,
,
and
, respectively. Similar to the evaluation given by employees, the weighted average of the seven flexible numbers calls forth the aggregate performance from the viewpoint of patients. Here again, each attribute has the same weight and so the aggregate result is the arithmetic average of the attribute- specific evaluation results. As a consequence, the flexible fuzzy number
(cited as ‘weighted average’ in ) illustrates the aggregate performance that can be interpreted so that the aggregate performance of the service lies between 2.9 and 6.4 and its most likely value is 5.1.
Figure 4. Evaluation of service quality in seven attributes using flexible fuzzy numbers – patients.
Compared to the aggregate evaluation of performance in case of healthcare workers (see , fuzzy number cited as ‘weighted average’) we may conclude that patients’ aggregate evaluation mostly having the value of 5.1 is a bit lower than the same value of healthcare workers. However, the performance instability is slightly higher in case of healthcare workers (where contrary to that of patient perceptions (where
.
The methodology introduced in this paper also allows us to compare the evaluation results given by the different stakeholders in specific attributes. If we take a look at the ‘Accessibility’ both in and (with the flexible fuzzy numbers of and
, respectively), the following differences can be identified in this specific service feature. In this example ‘Accessibility’ shows higher performance instability in case of patient evaluations
compared to healthcare workers’
. Secondly, the asymmetry of both fuzzy numbers depicts that the performance more likely tends to differ from the value of
in the direction of lower values in case of both stakeholder groups. Note that if only the most likely value of
is considered in both cases, no difference could be detected between the evaluations of the two groups of stakeholders reflecting the logic of the traditional Likert scale.
Likewise, if the example of the ‘Outcomes’ is considered (see again and with the flexible fuzzy numbers of and
, respectively) similar conclusions can be drawn. The performance instability is higher in case of patients, while the asymmetry shows similar pattern as the left hand limit is more distant from 6 than the right hand limit expressing that the performance in this attribute is more likely to be lower than 6 than higher in both cases. If only the values of
are considered, no differences could be grabbed between the evaluation of performance in this specific attribute given by the two stakeholder groups. Similar comparisons could be made in case of ‘Tangibles and Environment’ and ‘Processes’ service attributes which appeared in the evaluation process of both stakeholders.
The grey coloured horizontal line segment in each plot of and represents that -cut of the corresponding flexible fuzzy number for
. In case of the ‘Tangibles and Environment’ service attribute, the α-cut of the flexible fuzzy number
(see ) and
(see .) is the interval [4, 5.33] and [3, 4.67], respectively. It means that if the evaluation of ‘Tangibles and Environment’ (healthcare workers) is in the interval [4, 5.33], then the truth of the statement that the perceived quality equals 4 is at least 0.8. Similarly, if the evaluation of ‘Tangibles and Environment’ (patients) is in the interval [3, 4.67], then the truth of the statement that the perceived quality equals 5 is at least 0.8. Recall that we proved earlier that the weighted average of
-cuts of flexible fuzzy numbers is the
-cut of the aggregate flexible fuzzy number. Note that the values of parameters
,
and
of the aggregate fuzzy number are independent of the value of parameter
, but the
-cuts of the individual flexible fuzzy numbers and the
-cut of the aggregate fuzzy number all depend on the value of
.
It is worth mentioning that if a healthcare institution or any of its department carry out a service performance evaluation by involving specific stakeholders and apply the introduced methodology, then the institutional or departmental level of aggregate service performance can be expressed as the average of the flexible fuzzy numbers representing the aggregate performance of the individuals. Since the weighted average calculation over the set of flexible fuzzy numbers is very simple, it is easy to determine the aggregate service level. Moreover, it handles some specific problems of Likert scale based evaluations, namely, that stakeholders in the role of evaluators use only crisp values to present their perceptions related to specific service attributes. Therefore, the fuzzy rating scale has the ability to model the imprecision of human rating evaluations, formalise them mathematically, ‘precisiate’ them in a continuous way, and serve as a basis to develop mathematical computations with them. As it is highlighted in the proposed methodology and the demonstrative example, the application of a fuzzy-valued response format enables a level of variability and accuracy which would not be captured when using a Likert scale.
5. Conclusions and managerial implications
The application of the presented methodology may arise in evaluations where Likert-type scales are applied traditionally. By providing a fuzzy Likert scale to evaluate specific service attributes, raters can express their uncertainty, contrasting perceptions and the variability of service performance in a quantitative way. A fuzzy evaluation environment and the proposed approach can help to deal with the vagueness arising either from the uncertainty of the respondents or from the fluctuation of the service performance in time.
We have primarily focused on the two most important stakeholder groups, namely, on patients as external customers and on healthcare workers as internal customers. The introduced methodology and our healthcare example demonstrating the application highlight the reliability issues originating from the application of traditional Likert scales when it comes to evaluating service attributes either being an internal or an external customer. Therefore, the methodology proposed in this paper may also extend the evidence base that can support healthcare decision-makers and managers to develop adequate strategies related to service quality improvements based on a more reliable judgement of service attributes.
This study should be considered as a theoretical contribution to a more extensive research in the measurement and evaluation of healthcare service quality attributes perceived by different stakeholders. In its practical contribution, the paper has described the flexible fuzzy number based methodology in order to contribute to the service quality literature by extending the original methodology with the fuzzy approach. Our short-term goal is to apply the proposed methodology on real data as demonstrated in the example in order to judge service quality from both the external and internal customers’ point of view. The long term goal is to reflect on which service attributes are determinative to the internal customers and which are crucial for the external customers. The proposed methodology offers the opportunity to compare these evaluations on a more reliable basis from a methodological point of view.
Disclosure statement
No potential conflict of interest was reported by the authors.
References
- Al-Borie, H. M., & Damanhouri, A. M. S. (2013). Patient’s satisfaction of service quality in Saudi hospitals: A SERVQUAL analysis. International Journal of Health Care Quality Assurance, 26(1), 20–30.
- Babakus, E., & Mangold, W. G. (1992). Adapting the SERVQUAL scale to hospital services: An empirical investigation. Health Services Research, 26(6), 767–786.
- Battisti, F., Nicolini, G., & Salini, S. (2010). The Rasch model in customer satisfaction survey data. Quality Technology & Quantitative Management, 7(1), 15–34.
- Behdioğlu, S., Acar, E., & Burhan, H. A. (2017). Evaluating service quality by fuzzy SERVQUAL: A case study in a physiotherapy and rehabilitation hospital. Total Quality Management & Business Excellence, 1–19. doi: 10.1080/14783363.2017.1302796
- Benoit, E. (2013). Expression of uncertainty in fuzzy scales based measurements. Measurement, 46(9), 3778–3782.
- Benoit, E., & Foulloy, L. (2003). Towards fuzzy nominal scales. Measurement, 34(1), 49–55.
- Berwick, D. M. (2009). What ‘patient-centered’ should mean: Confessions of an extremist. Health Affairs, 28(4), 555–565.
- Bowers, M. R., Swan, J. E., & Koehler, W. F. (1994). What attributes determine quality and satisfaction with healthcare delivery? Health Care Management Review, 19(4), 49–55.
- Büyüközkan, G., Çifçi, G., & Güleryüz, S. (2011). Strategic analysis of healthcare service quality using fuzzy AHP methodology. Journal Expert Systems with Applications: An International Journal, 38(8), 9407–9424.
- Calcagní, A., & Lombardi, L. (2014). Dynamic fuzzy rating Tracker (DYFRAT): a novel methodology for modeling real-time dynamic cognitive processes in rating scales. Applied Soft Computing, 24, 948–961.
- de la Rosa de Sáa, S., Gil, MÁ, González-Rodríguez, G., López, M. T., & Lubiano, M. A. (2015). Fuzzy rating scale-based questionnaires and their statistical analysis. IEEE Transactions on Fuzzy Systems, 23(1), 111–126.
- Dombi, J., & Jónás, T. (2018). Approximations to the Normal Probability Distribution function using Operators of continuous-valued logic. Acta Cybernetica, 23(3), 829–852.
- Giovanis, A., Pierrakos, G., Rizomyliotis, I., & Binioris, S. (2018). Assessing service quality and customer behavioral responses in hospital outpatient services: A formative measurement approach. International Journal of Quality and Service Sciences, 10(2), 98–116.
- Groene, O., Botje, D., Sunol, R., Lopez, M. A., & Wagner, C. (2013). A systematic review of instruments that assess the implementation of hospital quality management systems. International Journal for Quality in Health Care, 25(5), 525–541.
- Grönroos, C. (1984). A service quality model and its marketing implications. European Journal of Marketing, 18(4), 36–44.
- Hesketh, B., Pryor, R., Gleitzman, M., & Hesketh, T. (1988). Practical applications and psychometric evaluation of a computerized fuzzy graphic rating scale. Advances in Psychology, 56, 425–454.
- Hu, H.-Y., Lee, C.-H., & Yen, T.-M. (2010). Service quality gaps analysis based on fuzzy linguistic SERVQUAL with a case study in hospital out-patient services. The TQM Journal, 22(5), 499–515.
- Institute of Medicine. (2001). Crossing the quality Chasm: A New health system for the 21st Century. Washington, DC: National Academic Press. Retrieved from https://search.proquest.com/docview/1777613141/fulltextPDF/CDF64EC9FB4847D5PQ/1?accountid=15870
- Janicijevic, I., Seke, K., Djokovic, A., & Filipovic, J. (2013). Healthcare workers satisfaction and patient satisfaction – where is the linkage? Hippokratia, 17(2), 157–162.
- Johnston, R. (1995). The determinants of service quality: Satisfiers and dissatisfiers. International Journal of Service Industry Management, 6(5), 53–71.
- Kenagy, J. W., Berwick, D. M., & Shore, M. F. (1999). Service quality in health care. JAMA, 281(7), 661–665.
- Lee, D. H. (2017). HEALTHQUAL: A multi-item scale for assessing health care service quality. Service Business, 11(3), 491–516.
- Lee, M. S., Lee, D. H., & Kang, C.-Y. (2012). The impact of high performance work systems in the health-care industry: Employee reactions, service quality, customer satisfaction, and customer loyalty. The Service Industries Journal, 32(1), 17–36.
- Lee, M. A., & Yom, Y. H. (2007). A comparative study of patients’ and nurses’ perceptions of the quality of nursing services, satisfaction and intent to revisit the hospital: A questionnaire survey. International Journal of Nursing Studies, 44(4), 545–555.
- Li, Q. (2013). A novel Likert scale based on fuzzy sets theory. Expert Systems with Applications, 40(5), 1609–1618.
- Lin, H. T. (2010). Fuzzy application in service quality analysis: An empirical study. Expert Systems with Applications, 37(1), 517–526.
- Lin, C. J., & Wu, W. W. (2008). A causal analytical method for group decision-making under fuzzy environment. Expert Systems with Applications, 34(1), 205–213.
- Liou, T. S., & Chen, C. W. (2006). Subjective appraisal of service quality using fuzzy linguistic assessment. International Journal of Quality & Reliability Management, 23(8), 928–943.
- Lowe, G. (2012). How employee engagement matters for hospital performance. Healthcare Quarterly, 15(2), 29–39.
- Lozano, L. M., García-Cueto, E., & Muñiz, J. (2008). Effect of the number of response categories on the reliability and validity of rating scales. Methodology, 4(2), 73–79.
- Lubiano, M. A., de Sáa, S. D. L. R., Montenegro, M., Sinova, B., & Gil, MÁ. (2016). Descriptive analysis of responses to items in questionnaires. Why not using a fuzzy rating scale?. Information Sciences, 360, 131–148.
- Lupo, T. (2013). A fuzzy ServQual based method for reliable measurements of education quality in Italian higher education area. Expert Systems with Applications, 40(17), 7096–7110.
- Lupo, T. (2016). A fuzzy framework to evaluate service quality in the healthcare industry: An empirical case of public hospital service evaluation in Sicily. Applied Soft Computing, 40, 468–478.
- Miranda, F. J., Chamorro, A., Murillo, L. R., & Vega, J. (2012). Primary health care services quality in Spain: A formative measurement approach using PLS path modeling. International Journal of Quality and Service Sciences, 4(4), 387–398.
- Mosadeghrad, A. M. (2014). Factors influencing healthcare service quality. International Journal of Health Policy and Management, 3(2), 77–89.
- Mostafa, M. (2005). An empirical study of patients’ expectations and satisfactions in Egyptian hospitals. International Journal of Health Care Quality Assurance, 18(7), 516–532.
- Naik, J. R. K., Anand, B., & Bashir, I. (2015). An empirical investigation to determine patient satisfaction factors at tertiary care hospitals in India. International Journal of Quality and Service Sciences, 7(1), 2–16.
- Oliva, T. A., Oliver, R. L., & MacMillan, I. C. (1992). A catastrophe model for developing service satisfaction strategies'’. Journal of Marketing, 56(July), 83–95.
- Pantouvakis, A., & Mpogiatzidis, P. (2013). The impact of internal service quality and learning organization on clinical leaders’ job satisfaction in hospital care services. Leadership in Health Services, 26(1), 34–49.
- Parasuraman, A., Zeithaml, V. A., & Berry, L. L. (1985). A conceptual model of service quality and its implications for future research. Journal of Marketing, 49(4), 41–50.
- Parasuraman, A., Zeithaml, V. A., & Berry, L. L. (1988). SERVQUAL: A multiple item scale for measuring customer perceptions of service quality. Journal of Retailing, 64(1), 12–40.
- Raharjo, H., Mugion, G. R., Di Pietro, L., & Toni, M. (2016). Do satisfied employees lead to satisfied patients? An empirical study in an Italian hospital. Total Quality Management & Business Excellence, 27(7–8), 853–874.
- Ramsaran-Fowdar, R. R. (2008). The relative importance of service dimensions in a healthcare setting. International Journal of Health Care Quality Assurance, 21(1), 104–124.
- Schneider, B., Parkington, J. J., & Buxton, V. M. (1980). Employee and customer perceptions of service in banks. Administrative Science Quarterly, 25(2), 252–267.
- Singh, A., & Prasher, A. (2017). Measuring healthcare service quality from patients’ perspective: Using fuzzy AHP application. Total Quality Management and Business Excellence, 1–18. doi: 10.1080/14783363.2017.1302794
- Tóth Zs, E., Surman, V., & Árva, G. (2017). Challenges in course evaluations at Budapest University of Technology and Economics. In Z. Bekirogullari, M. Y. Minas, & R. X. Thambusamy (Eds.), 8th ICEEPSY – International Conference on Education and Educational Psychology (pp. 629–641). 2017.10.11-2017.10.14. Porto: Future Academy.
- Tsai, Y., Wu, S. W., & Tsai, Y. H. (2018). Employee perceptions of service quality based on hospital quality improvement strategy. International Journal of Management, Economics and Social Sciences (IJMESS), 7, Special Issue, 13–25.
- Turan, A., & Bozaykut-Bük, T. (2016). Analyzing perceived healthcare service quality on patient related outcomes. International Journal of Quality and Service Sciences, 8(4), 478–497.
- Vandamme, R., & Leunis, J. (1993). Development of a multiple-item scale for measuring hospital service quality. International Journal of Service Industry Management, 4(3), 30–49.
- Vogus, T. J., & McClelland, L. E. (2016). When the customer is the patient: Lessons from healthcare research on patient satisfaction and service quality ratings. Human Resource Management Review, 26(1), 37–49.
- Woldegebriel, S., Kitaw, D., & Rafele, C. (2015). Application of fuzzy logic for Prioritizing service quality improvement in healthcare. International Journal of Scientific and Engineering Research, 6(5), 530–537.
- Yesilada, F., & Direktor, E. (2010). Health service quality: A comparison of public and private hospitals. African Journal of Business Management, 4(6), 962–971.
- Yoon, S. J., Choi, D. C., & Park, J. W. (2007). Service orientation: Its impact on business performance in the medical service industry. Service Industries Journal, 27(4), 371–388.