
 ?Mathematical formulae have been encoded as MathML and are displayed in this HTML version using MathJax in order to improve their display. Uncheck the box to turn MathJax off. This feature requires Javascript. Click on a formula to zoom.
Abstract
Standardised Work (STW) is one of the most effective but least utilized Lean tools for business process improvement initiatives in the transactional office environment known as the ‘Lean office’. The STW not only establishes a baseline for continuous improvement initiatives but also facilitates them by giving indications of key improvement opportunities in the present best practice. The STW is a thorough document in which the process workflow is broken into a number of consecutive work elements whose processing times are labelled according to their nature and required resources. Developing the STW for business processes in the manufacturing environment is quite common; however, it is quite rare and limited in the transactional office environment. This is primarily caused by the business-office processes’ complexity or underestimating their influence on overall business success. In this study, we position and highlight the importance of the STW in the Lean office programme and propose a pragmatic and tractable framework for developing the STW for business-office processes through the use of a pilot process. The proposed STW framework was implemented successfully in the pharma industry. Finally, the paper is concluded by discussing the possible obstacles and providing future research directions.
1. Introduction
The global competitive marketplace has turned Lean management into one of the most widely used business strategies from which companies can benefit to survive or thrive (Freitas & Freitas, Citation2020b; Monteiro et al., Citation2015; Unwin, Citation2005). First, Lean was introduced by Taiichi Ohno at Toyota Motor Corporation in the 1990s as a management approach to target a higher performance efficiency on the one hand and higher customers’ satisfaction on the other (Womack et al. (Citation1990) as cited in Bortolotti and Romano (Citation2012)). To achieve these two conflicting targets, Lean focuses on eliminating or reducing activities that need resources and create no value for the customers known as non-value-added activities or wastes (Hung et al., Citation2021; Ohno, Citation1988; Pavnaskar et al., Citation2003; Shamah, Citation2013). Leyer et al. (Citation2021) discovered that Lean can significantly improve staff satisfaction and well-being in an organization if it is seen as a tool for improving efficiency rather than a method of reducing the workforce.
For business processes in the manufacturing environment, seven types of wastes (i.e. also known as Toyota’s seven wastes) such as excessive transportation, unnecessary inventory, unnecessary motion, waiting times, overproduction, over-processing, and defective products have been recognized (Besser Freitag et al., Citation2018; Freitas & Freitas, Citation2020a; Pereira Librelato et al., Citation2014; Sabur & Simatupang, Citation2015). These seven wastes should be identified and eliminated using Lean tools and techniques.
In the recent century, different Lean techniques such as Gemba, Ando, Jidoka, Heijunka, Six Sigma, Kanban, Poka-Yoke, Takt time, Just-in-Time (JIT), Pull system, one-piece follow, 5S, 5Whys, Fishbone diagram, Total Productive Maintenance (TPM), Overall Equipment Effectiveness (OEE), Value Stream Mapping (VSM), Single Minute Exchange of Die (SMED), Business Process Mapping (BPM), Standardized Work (STW), and so on, have been developed and implemented by practitioners in a wide range of industries (Dennis, Citation2015; Fiorillo et al., Citation2021; Ohno, Citation1988). Because Lean management has its roots in the manufacturing environment, there is a wrong belief that it could not possibly work in the office environment (Nǎftǎnǎilǎ & Mocanu, Citation2014; Direction, Citation2005). Therefore, to the best of our knowledge, some of the aforementioned Lean techniques and specifically STW have not been adapted and applied to the transactional office environment yet (Chiarini & Gabberi, Citation2022).
According to Dennis (Citation2015, p. 25), STW serves as a foundation for Lean management. The STW is a highly detailed work procedure that provides step-by-step guidelines for performing day-to-day process activities. In other words, the STW documents the process knowledge that has become a vital strategic resource for businesses to achieve a competitive advantage (Hu et al., Citation2019). As emphasized by Emiliani (Citation2008), if STW is applied correctly, it provides plenty of opportunities from which businesses can benefit vastly.
First, the STW can create a great learning platform for organizational and individual learning (e.g. new hires) by documenting the current state of the process knowledge. Second, it creates a baseline or a reference point for Kaizen and continuous improvement initiatives by illustrating and comparing the current and future states of the process. Third, it reveals abnormalities and highlights improvement opportunities by breaking down the process into a set of sequential work elements and labelling them in terms of their type and processing time. Fourth, it improves the quality and stability of the process outputs by determining and indicating all the required steps for performing the process sequentially. This last benefit is more emphasised when a process is performed by more than one expert. Finally, the STW can facilitate workforce management by providing information on the required workload in terms of the processing time of the processes (Dennis, Citation2015, p. 69; Emiliani, Citation2008).
It is noteworthy that the STW concept is one of the most misunderstood and misapplied Lean techniques (Liker & Meier, Citation2006, pp. 113–114). The first misunderstanding is mistaking the STW for work standards. Work standards are work procedures defined by management to ensure that each employee puts forth the necessary effort (Emiliani, Citation2008). In other words, management can use the work standard to either penalize employees for non-performance or entice them to exceed the standard. The second misunderstanding is considering STW as a never-changing and set-in-stone document. However, STW changes when people find better ideas for performing the work or when business circumstances change (Emiliani, Citation2008).
Despite the above-mentioned enormous benefits of the STW, mostly it has just been applied to manufacturing processes. This might be either due to underestimating the importance of nonmanufacturing processes in the success of businesses since the costs associated with business-office processes are typically not part of the direct cost of the product (Huls, Citation2005) or due to the complexity of the business-office processes since they have less repetitiveness and different variations compared to the manufacturing processes (Chen & Cox, Citation2012; Pika et al., Citation2016). The office functions (i.e. from product or service design to marketing) can form 60% up to 80% of the efforts associated with delivering a product or service to the customers (Direction, Citation2005). Therefore, the overall business performance can suffer seriously when business-office processes are not efficient (Sousa & Dinis-Carvalho, Citation2021).
Even though Yokoyama et al. (Citation2019) have mentioned six references (i.e. Bodin Danielsson, Citation2013; da Silva et al., Citation2015; Monteiro et al., Citation2015; Năftănăilă & Mocanu, Citation2014; Nǎftǎnǎilǎ & Mocanu, Citation2014; Direction, Citation2005) concerning STW in the office environment, none of the mentioned references proposes how STW might be implemented in the office environment. This study is the first study in the literature of Lean to propose a systematic approach to developing the STW in the transactional office environment and it sheds light on the application of the STW while discussing its challenges and limitations. The remainder of this paper is organised as follows: In Section 2, the STW is positioned in the Lean office programme by discussing the most important events within the programme. Then, an STW tool named STW combination chart is proposed based on the characteristics of the business-office processes work in Section 3. In Section 4, the development of the STW for the business-office processes is illustrated considering the invoice-checking process as a pilot. Afterwards, the limitations and challenges of the STW in the transactional office environment are discussed in Section 5. Finally, Section 6 concludes the paper by summarizing the bottom lines and key points of the paper and proposing directions for future research.
2. Positioning the STW in the Lean office program
The Lean Office programme is an operational excellence programme that aims at applying the principles of lean thinking in administrative areas to eliminate waste in business-office processes and information flows (Freitas & Freitas, Citation2020a). provides a schematic representation of the Lean office programme by analogy with a 2-pillar house. For establishing a successful Lean office programme, the two pillars of BPM and STW should be developed consecutively as the first foundation steps.
Figure 1. The 2-pillar Lean office house.
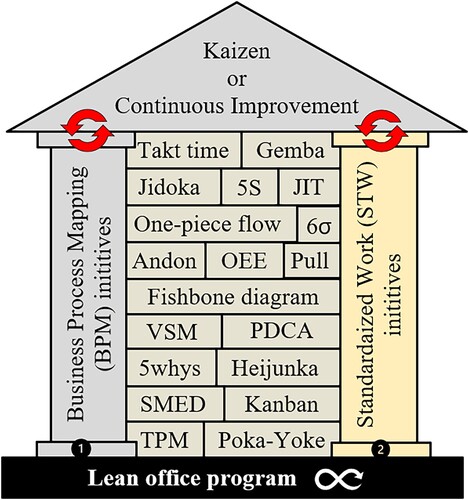
Afterwards, these two pillars are used to facilitate the continuous improvement initiatives known as Kaizen events. In other words, Kaizen events are planned to shine a light on waste in the processes and empower the organizational lean culture by training and engaging all the employees in the Kaizen events. During these Kaizen events, different Lean tools might be used. These Lean tools and techniques have been presented as blocks of the Lean office house in . It is noteworthy that during this continuous improvement journey, after each successful Kaizen event and applying possible changes to the process, the corresponding BPM and STW documents should be updated. In what follows, we briefly discuss the 2-pillar of the Lean office house and Kaizen event.
Business Process Mapping (BPM). BPM is a graphical illustration that models the relationships between the activities, people, data, and objects involved in a process to produce a specific output (Biazzo, Citation2002). In a BPM event, the outline of the process is mapped by the BPM team consisting of a developer and the person who is executing the process (i.e. who possesses the process knowledge) known as the Subject Matter Expert (SME). The BPM for a process can be developed by gathering high-level information about the current state of the process and its flow through interviewing the SME by the BPM developer. As a result, all the variations of a process known as sub-processes are determined. Since the BPM is a high-level document and does not contain detailed information about each segment of the process, it is hard to make a relative comparison between what is happening and what is thought to be happening in the process. As the next step, STW documents resolve this shortcoming of the BPM.
Standardized Work (STW). The STW is a highly detailed work procedure that provides step-by-step guidelines for performing day-to-day process activities by documenting the process knowledge. Similar to the BPM event, an STW team is comprised of a developer and the SME(s). The STW for a process can be developed by gathering detailed information about required steps in the current state of each sub-process and their sequence through interviewing the SME(s) by the STW developer.
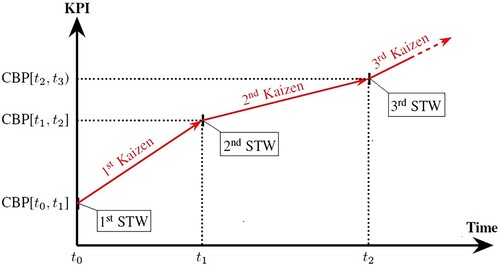
Kaizen. Also known as continuous improvement, can be defined as a procedure for operational process excellence (Pereira Librelato et al., Citation2014). In the Lean office programme, the STW serves as a baseline and a reference for measuring the current and future states of the process. According to M. Chen and Lyu (Citation2009), one of the five phases of the DMAIC (i.e. Define, Measure, Analyse, Improve, and Control) roadmap is ‘Measure’ which refers to measuring the current and the new state of the practice in a continuous improvement project. This indicates that a measurable Key Performance Indicator (KPI) for the continuous improvement project is needed; otherwise, it is almost impossible to calculate the improvement achievement of a Kaizen event. In this study, we consider the efficiency of the Best Practice (BP) as a KPI and we measure it in terms of the required labour hours for completing the process (Rohleder & Silver, Citation1997). As it is illustrated in , continuous improvement initiatives can be performed using consecutive Kaizen events to improve the KPI of the BP. In this case, the KPI of the BP should be measured using STW before and after each Kaizen event. Then, by comparing the performance of the old and new BPs, the amount of improvement can be calculated.
Figure 2. The cycle of the STW-Kaizen in the incremental continuous improvement.
Following , let BP[] represent the BP for the period of [
]. Also, let us assume that through a Kaizen event during this period, the BP is promoted to a new level of BP[
] for the next period of [
]. Then, the improvement can be calculated in percentage as follows.
(1)
(1) According to EquationEquation (1)
(1)
(1) , a bigger Improvement leap (%) shows a bigger improvement achievement and a smaller value shows a smaller improvement achievement. As it is shown in , it is worth mentioning that different Kaizen events may result in different improvements leaps (%), and from a continuous improvement perspective, the continuum of the continuous improvement process is more important than the size of the improvement leaps (Pereira Librelato et al., Citation2014). Remember that after each successful Kaizen event and making possible changes to the process, a new version of the BPM, and STW documents should be developed to capture the new state of the process. Also, it is noteworthy that the latest version of these documents should always be shared on an internal network. From now on, we restrict our focus to the STW as it is our main contribution to the Lean office.
3. An STW tool for the transactional office environment
Most of the manufacturing processes are stable and repeatable while most of the office processes are not, thus the STW has been highly recommended for manufacturing processes (Liker & Meier, Citation2006, p. 125). In this section, we introduce a suitable STW tool for non-manufacturing processes by comparing manufacturing and non-manufacturing processes and adapting the available manufacturing STW tool for non-manufacturing processes. It is worth emphasizing that the intention of the STW is not prescribing how the work should be done; however, it is a representation of what is happening to highlight possible wastes in the BP for improvement purposes.
According to Liker and Meier (Citation2006, p. 126), the STW chart, STW combination table, and production capacity sheet are three primary documents for developing STW in manufacturing environments. Since in the transactional office environment, automatic work done by the machinery without the user’s intervention is rare and the user rarely needs movement within the work area to perform the work, the STW chart and production capacity sheet tools seem irrelevant for developing the STW in the transactional office environment. However, the STW combination table can be modified and used for developing STW in the transactional office environment. We call the modified version the STW combination chart as the graphical part plays a significant role in the Lean office programme. This chart is implemented as a smart Microsoft Excel spreadsheet in which all the required calculations are done, and the outputs are visualized automatically.
In the manufacturing environment, the STW combination table divides the process workflow into a set of consecutive work elements, and each work element is labelled as manual work, automatic work, walking, waiting, or a combination of them. Then, the time required for performing each work element should be presented graphically in terms of its label(s).
Considering the nature of work in the transactional office environment in which machinery with the working cycle of loaded by the user (i.e. manual work element), operating automatically without the user’s intervention (i.e. automatic work element), and unloaded by the user (i.e. manual work element) is rare, we replace manual and automatic labels with more relevant labels for business-office work such as searching, executing, archiving, and checking. Each label is presented with a colour code as shown in and is specified based on their adapted definition provided by Merriam-Webster dictionary (Marriam-Webster, Citation2002) as follows.
walking: to move on foot and advance by steps,
archiving: to save or print a piece of information for retrieving in the future,
searching: to seek something or look for something,
checking: to compare something with a source, original, or authority,
waiting: to stay in place and do nothing in expectation of something, and the remaining business-related activities apart from the above-mentioned activities are classified as execution.
Figure 3. The STW combination chart for developing STW in the office environment.
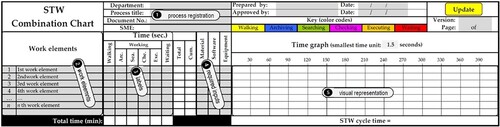
For each (sub-)process, information associated with grey cells should be collected and filled in. First, the process should be registered by filling in the information about the (sub-)process, SME(s), and date in the process registration area. Then, the process flow should be broken down into a set of consecutive work elements in the work element area. Processing time associated with each work element should be labelled based on the nature of the work element in the labelling area. Also, for each work element, the required inputs in terms of consumable material, required software and equipment should be determined by inserting a checkmark in the required input area. This information is used for training and learning purposes in the future.
We designed the STW combination chart in a Microsoft Excel spreadsheet and upgraded it to a smart form using Visual Basic for Applications (VBA) programming language. A smart STW combination chart not only boosts the project performance in terms of project completion time and accuracy of the calculations but also facilitates any possible updates in the continuous improvement journey. We can summarize the main steps required for developing STW for an arbitrary office process in a systematic way as follows.
Developing BPM (i.e. mapping all its sub-processes and their main steps),
Developing the STW for each sub-process in the BPM (i.e. documenting all its required work elements and labelling them in the STW combination chart),
Developing the STW overview chart (i.e. integrating information from all the STW combination charts developed for each sub-process of the process).
4. A case study: invoice checking process
In this section, we consider the invoice-checking process as a pilot business-office process with more than one sub-process to illustrate how STW documents can be developed. For simplicity purposes, we choose the invoice-checking process that has been described and mapped by Dumas et al. (Citation2018, p. 68).
4.1. Description of the Process
The invoice-checking process is an administrative process that can be found in different functions. When an invoice arrives from a customer, it should be checked for possible mismatches. The check may result in either of these three scenarios: i) there are no mismatches, then the invoice should be posted, ii) there are mismatches, but these can be corrected. Then, the invoice should be re-sent to the customer for corrections, iii) there are mismatches, and they cannot be corrected. Then, the invoice should be blocked. Once one of these scenarios occurs and the corresponding action is taken, the invoice is parked, and the process is complete. Recall that for each invoice only one of these scenarios occurs.
4.2. The BPM of the Process
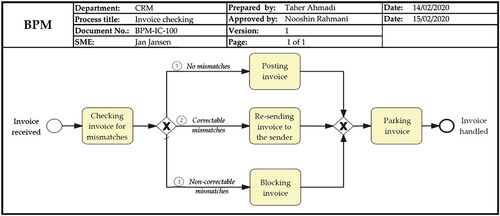
As we mentioned before, one of the differences between processes in the manufacturing and office environments is that business-office processes might have more than one variation. In other words, at some points within the process depending on the condition (i.e. which scenario occurs), the process flow might change. With the help of the corresponding SME(s), the BPM of the invoice-checking process can be developed as follows.
As it is shown in , depending on the outcome of the ‘checking invoice for mismatching’ step, the invoice checking process might take three different possible paths. We refer to each of these paths as a sub-process and code them as Sub-processes ‘IC-100-1’, ‘IC-100-2’, and ‘IC-100-3’. Notice that for each invoice only one of the paths occurs. By collecting information on the occurrence frequency of paths, the occurrence chance of each path can be predicted.
Figure 4. Invoice checking process map (adapted from Dumas et al. (Citation2018, p. 68)).
4.3. STW Combination Chart
According to the depicted BPM in , we can develop the corresponding STW charts for the three sub-processes as presented in . represents the STW chart for Subprocess ‘IC-100-1’ in which with the help of the SME the workflow of the sub-process is broken down into a set of consecutive work elements for each of which the processing time is divided and labelled in terms of walking, searching, executing, archiving, checking, and waiting. Also, the required consumable materials, required software, and equipment are marked by inserting a check mark for each work element. Since the processing times of the work elements may vary in each repetition of the process, the average estimation of the processing times provided by the SME should be considered.
Figure 5. STW combination chart of the no mismatches sub-process.
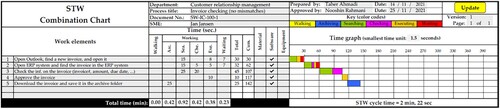
Figure 6. STW combination chart of the correctable mismatches sub-process.
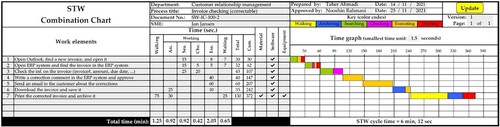
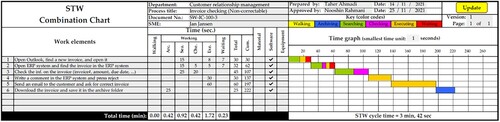
Figure 7. STW combination chart of the non-correctable mismatches sub-process.
For instance, the second work element with the title of ‘open ERP system and find the invoice in the ERP system’ has a processing time of about 32 seconds and needs software (i.e. the ERP system). Moreover, the 32-second processing time of this work element is comprised of a 7-second waiting (i.e. for opening the ERP system), a 15-second searching (i.e. for finding the invoice), and a 5-second checking (i.e. for comparison). After entering all the work elements and labelling their processing times, the reaming calculations and graphical chart will be completed automatically by pressing the Update button. Moreover, the total processing time per label and the STW cycle time of the sub-process will be calculated in minutes. Similarly, the STW for the Sub-process ‘IC-100-2’ can be developed as presented in . As it is seen, the first three work elements are common between all the three sub-process. However, they have unique work elements as well.
Due to unique work elements, the STW cycle time of each sub-process might be different. For instance, Sub-process ‘IC-100-2’ has a longer STW cycle time compared to Sub-process ‘IC-100-1’. Similarly, the STW for the Sub-process ‘IC-100-3’ can be developed as presented in .
To make the development of the STW for processes with more than one sub-process more efficient, we suggest filling in the STW combination chart for the first sub-process and then using the copy workbook button in Excel to create the STW combination chart for the other two sub-processes. Using this trick, all the common information and work elements stay and no reproduction is needed. Of course, the differences can be easily modified.
4.4. An Overview of the Process
After developing the STW combination chart for all the sub-processes of a process, the STW overview chart can be created in which all the sub-processes, their chance of occurrence, STW cycle time, and the amount of time spent on each work element per sub-process are listed. represents the STW overview for the invoice-checking process. The occurrence chance of Sub-processes ‘IC-100-1’, ‘IC-100-2’, and ‘IC-100-3’ are reported as 90%, 6%, and 4%, respectively. As we can see, the Sub-process ‘IC-100-1’ occurs 90% of the time and it is the main sub-process.
Figure 8. The STW overview chart of the invoice-checking process.
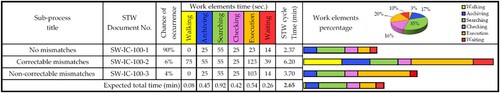
Moreover, the STW overview chart provides a bigger picture of the entire process by calculating the expected STW cycle time and expected time spent on each work element. This general information about the entire process can facilitate the allocation of the workforce and the evaluation of the process for continuous improvement initiatives. In other words, the work elements percentages in the pie chart, highlight the potential improvement opportunities for Kaizen events. For instance, in , 35% of the expected STW cycle time of the entire process is spent on searching which is a non-added value activity. According to such an observation, a Kaizen event can be planned to investigate the necessity and efficiency of searching activities and take proper measures to eliminate them from the process or reduce them.
5. Challenges and limitations
In the literature on Lean management, convincing both the management and front-line staff to truly understand and accept the lean concepts has been mentioned as one of the biggest challenges of Lean implementation (Kuriger et al., Citation2010). Achieving a successful Lean office programme can be represented by sustainable improvement that requires changes to both system and people’s mindset (Direction, Citation2005). Making changes is not straightforward and often comes with challenges. In this section, we list some challenges that the STW team might encounter in developing the STW for business-office processes and provide some remedies to overcome them.
Lack of organizational support. In general, successful continuous improvement initiative projects require full support from the top management and the engagement of the entire organisation. In other words, the management team must not only provide sufficient time and resources for the improvement teams but also ensure appropriate ongoing training concerning Lean tools and techniques for the employees (Rohleder & Silver, Citation1997). This can be easily understood by the iceberg of ignorance that emphasizes the fact that a higher percentage of business problems are visible to the front-line staff rather than the management team. The STW as one of the continuous improvement initiatives is not an exception. Without support from the management and enough cooperation and engagement of the employees and particularly the corresponding SMEs, the STW efforts face major challenges and may fail.
SMEs’ resistance. Before starting the STW efforts for a specific process, all the corresponding SMEs should be informed about the objectives and benefits of the STW and its positive impact on the quality of what they are doing by the STW team. This helps to overcome the SMEs’ attitude of preventing rather than reacting to problems. Without these clarifications, the identification of problems or opportunities for improvement might be mistaken for the negative performance of the SME. In this case, the SMEs may tend to show a preventive attitude rather than a supportive attitude towards the STW efforts even if they know that the STW efforts resolve operational issues and reduce process inefficiencies (Matthews et al., Citation2019). Also, the SMEs might think that the STW might be used for productivity purposes and it might lead to either allocating more work to them (Huls, Citation2005) or laying off employees. The bottom line is that clear communication within the STW team (i.e. between the SMEs and the developer) creates harmony and a supportive atmosphere. This supportive atmosphere not only can increase the success chance of the STW efforts but also can guarantee the engagement of the SMEs in the continuous improvement initiatives with the Lean office programme.
Many sub-processes. Normally, business-office processes are comprised of more than one subprocess. Since the STW is developed for each sub-process, it is obvious that the STW efforts for a process increase as the number of its sub-processes increases. However, the question is what trade-off should be made between the value that STW provides to the Lean office and the effort that is needed for developing the STW. Recall that not all the sub-processes of a process have the same occurrence chance. Some sub-processes occur rarely and developing the STW for such sub-processes doesn’t have enough business value. A useful rule of thumb is ignoring the sub-processes with an occurrence chance of lower than 1% and not having the longest STW cycle time among their sub-processes. Also, subprocesses with a very low chance of occurrence are not eligible for the STW as they might not be repetitive enough. As we proposed, the STW efforts should be designed in a feasible and tractable manner. As we have proposed in this paper, automating the STW combination and the STW overview charts in a Microsoft Excel spreadsheet using VBA programming language makes the STW efforts for processes with a significant number of sub-processes feasible and tractable.
Conflicting information provided by SMEs. Having more than one working shift and consequently, more than one SME for a specific process increases the STW efforts when conflicting process knowledge and information is provided by the SMEs. In this case, all the corresponding SMEs should be involved in the development of the STW. This can be done either by inviting all the SMEs to a meeting or by developing the STW with the help of one SME and reviewing it with the others. We might receive conflicting process knowledge and information from different SMEs. When we are dealing with humans, there will likely be some variability in their behaviour. Therefore, if we ask an SME to repeat a specific task 100 times, some of them will be done faster than others (Cachon & Terwiesch, Citation2019, p. 172).
6. Conclusions and future research directions
In this paper, we addressed the STW as one of the most powerful but least used Lean office tools for business-office process improvement initiatives. Lean philosophy as a management approach for increasing the performance of businesses has been introduced and applied for more than a century. As a result, a wide range of Lean tools and techniques have been introduced and developed by practitioners. However, since Lean was invented and born in the manufacturing environment, there is a misunderstanding that some of the Lean techniques could not possibly work in the transactional office environment. We argued that the office functions can take 60% up to 80% of the business efforts; therefore, the overall business performance can suffer seriously when business-office processes are not efficient. One of the Lean techniques is STW which serves as a foundation for Lean management and to the best of the authors’ knowledge, there is no systematic approach in the Lean literature for utilizing the STW in the transactional office environment.
In this paper, we positioned and highlighted the importance of the STW in the Lean office programme and proposed a pragmatic and tractable framework for developing the STW as a Lean office tool. The STW is a highly detailed work procedure that provides step-by-step guidelines for performing day-to-day process activities. In other words, STW is a document in which the process workflow is broken down into a set of consecutive work elements. If STW is applied correctly, it can provide the following substantial advantages:
creating a learning platform for organisational and individual learning,
creating a baseline for Kaizen and continuous improvement initiatives,
revealing abnormalities and highlighting improvement opportunities,
facilitating the control of the process and reducing variability,
improving quality, flexibility, and stability of the outputs.
Despite the mentioned benefits, STW has been designed based on the nature of processes in the manufacturing environment and it has been argued that it cannot be applied to the business-office processes with more than one sub-process. In this paper, for developing STW in the transactional office environment, we introduced the ‘STW combination chart’ in which each work element is labelled with walking, searching, executing, archiving, checking, and waiting. Also, we provided guidelines on how to develop the STW approach feasibly and practically for a process with more than one sub-process. To do so, we designed the STW combination chart as a smart Microsoft Excel spreadsheet using VBA. In this way, the STW can be developed per sub-process, and consequently, the entire process overview chart is created in an efficient timely manner. We illustrated the entire STW using a pilot process, i.e. the invoice-checking process with three sub-processes. Moreover, we shed light on some challenges and obstacles that the STW team might face during an STW project in the transactional office environment.
The importance of the STW for the business environment is even more highlighted if we notice that the STW is a fundamental baseline and facilitating tool for implementing continuous improvement initiatives such as Kaizen and drive for excellence events. Even, the STW documents can be used for training the new hires. At a higher managerial level, the output of the STW can be used for providing a good approximation of the total workload of a department and making a better balance between workload and the number of employees.
The traditional BPM techniques try to map an idealized version of the business processes based on their static behaviour. However, process mining techniques try to map the business processes based on their dynamic behaviour during real execution by the user. Therefore, using process mining techniques, all the variations of business-office processes can be mapped and recorded substantially (dos Santos Garcia et al., Citation2019). Emerging technologies can facilitate and enrich process mining. For instance, Internet-of-Things (IoT) technology can be utilized for collecting a large amount of real-time data from the dynamic behaviour of a business-office process that may have different variations. Then, data mining techniques can be utilised for discovering workflow patterns (i.e. BPM) in large amounts of data known as Big Data. Furthermore, Artificial Intelligence (AI) techniques can be applied to automatically highlight potential improvement opportunities in the process and provide proper improvement suggestions for implementations. A new direction for future research can be utilizing emerging technologies such as Big Data, IoT, and AI for developing the STW for business-office processes. In other words, the up-to-date actual data and information can be collected using specific software and sensors in the environment (e.g. IoT) and real-time analysis of the collected information can be done by combining data mining and AI techniques with our approach (e.g. deciding upon the number of the sub-processes of a process, number of the work elements of a sub-process, the processing time of work elements and label them, creating the STW overview chart) and fill in the STW combination chart automatically. Finally, the business-office processes can be prioritised for continuous improvement initiatives intelligently based on their potential improvement magnitude.
7. Limitations
The proposed STW framework for the business-office processes becomes time-consuming and burdensome when the business-office processes have many sub-processes. In addition, collecting data for filling the STW combination chart becomes more challenging when the STW developer faces considerable resistance to changes from the SMEs. Also, when the STW project is not fully supported by the organizational management team, especially the top management, the project is likely to fail. Finally, we developed the proposed STW framework based on the business-office processes in the pharma industry. Therefore, implementing this framework in other industries may need some modifications and changes.
Disclosure statement
No potential conflict of interest was reported by the author(s).
References
- Besser Freitag, A. E., Santos, J. D. C., & Reis, A. D. C. (2018). Lean office and digital transformation: A case study in a services company. Brazilian Journal of Operations & Production Management, 15(4), 588–594. https://doi.org/10.14488/BJOPM.2018.v15.n4.a12
- Biazzo, S. (2002). Process mapping techniques and organisational analysis. Business Process Management Journal, 8(1), 42–52. https://doi.org/10.1108/14637150210418629
- Bodin Danielsson, C. (2013). An explorative review of the Lean office concept. Journal of Corporate Real Estate, 15(3/4), 167–180. https://doi.org/10.1108/JCRE-02-2013-0007
- Bortolotti, T., & Romano, P. (2012). ‘Lean first, then automate’: A framework for process improvement in pure service companies. A case study. Production Planning & Control, 23(7), 513–522. https://doi.org/10.1080/09537287.2011.640040
- Cachon, G., & Terwiesch, C. (2019). Matching supply with demand: An introduction to operations management (4th Ed). McGraw-Hill Publishing.
- Chen, J. C., & Cox, R. A. (2012). Value stream management for Lean office—a case study. American Journal of Industrial and Business Management, 2(2), 17–29. https://doi.org/10.4236/ajibm.2012.22004
- Chen, M., & Lyu, J. (2009). A Lean Six-Sigma approach to touch panel quality improvement. Production Planning & Control, 20(5), 445–454. https://doi.org/10.1080/09537280902946343
- Chiarini, A., & Gabberi, P. (2022). Comparing the VSM and Makigami tools in a transactional office environment: Exploratory research from an Italian manufacturing company. Total Quality Management & Business Excellence, 33(1-2), 127–145. https://doi.org/10.1080/14783363.2020.1807927
- da Silva, I. B., Seraphim, E. C., Agostinho, O. L., Lima Junior, O. F., & Batalha, G. F. (2015). Lean office in health organization in the Brazilian Army. International Journal of Lean Six Sigma, 6(1), 2–16. https://doi.org/10.1108/IJLSS-09-2013-0053
- Dennis, P. (2015). Lean production simplified: A plain-language guide to the world’s most powerful production system (3rd Ed). CRC Press.
- Direction, S. (2005). The new improvement frontier: Developing lean administration. Strategic Direction, 21(11), 33–35. https://doi.org/10.1108/02580540510630731
- dos Santos Garcia, C., Meincheim, A., Junior, E. R. F., Dallagassa, M. R., Sato, D. M. V., Carvalho, D. R., Santos, E. A. P., & Scalabrin, E. E. (2019). Process mining techniques and applications – A systematic mapping study. Expert Systems with Applications, 133, 260–295. https://doi.org/10.1016/j.eswa.2019.05.003
- Dumas, M., La Rosa, M., Mendling, J., & Reijers, H. A. (2018). Fundamentals of business process management (1st Ed). Springer Berlin.
- Emiliani, M. L. (2008). Standardized work for executive leadership. Leadership & Organization Development Journal, 29(1), 24–46. https://doi.org/10.1108/01437730810845289
- Fiorillo, A., Sorrentino, A., Scala, A., Abbate, V., & Dell’aversana Orabona, G. (2021). Improving performance of the hospitalization process by applying the principles of Lean thinking. The TQM Journal, 33(7), 253–271. https://doi.org/10.1108/TQM-09-2020-0207
- Freitas, R. D. C., & Freitas, M. D. C. D. (2020). Information management in lean office deployment contexts. International Journal of Lean Six Sigma, 11(6), 1161–1192. https://doi.org/10.1108/IJLSS-10-2019-0105
- Hu, Q., Williams, S., Mason, R., & Found, P. (2019). Knowledge management in consultancy-involved process improvement projects: Cases from Chinese SMEs. Production Planning & Control, 30(10-12), 866–880. https://doi.org/10.1080/09537287.2019.1582095
- Huls, K. (2005). The Antioch Company brings lean into the office. Journal of Organizational Excellence, 24(4), 31–38. https://doi.org/10.1002/joe.20068
- Hung, D. Y., Truong, Q. A., & Liang, S. Y. (2021). Implementing Lean quality improvement in primary care: Impact on efficiency in performing common clinical tasks. Journal of General Internal Medicine, 36(2), 274–279. https://doi.org/10.1007/s11606-020-06317-9
- Kuriger, G. W., Wan, H., Mirehei, S. M., Tamma, S., & Chen, F. F. (2010). A web-based lean simulation game for office operations: Training the other side of a lean enterprise. Simulation & Gaming, 41(4), 487–510. https://doi.org/10.1177/1046878109334945
- Leyer, M., Reus, M., & Moormann, J. (2021). How satisfied are employees with lean environments? Production Planning & Control, 32(1), 52–62. https://doi.org/10.1080/09537287.2020.1711981
- Liker, J. K., & Meier, D. (2006). The Toyota way field book: A practical guide for implementing Toyota’s 4Ps (1st Ed). McGraw-Hill USA.
- Marriam-Webster. (2002). Dictionary by Merriam-Webster: America’s most-trusted online dictionary. In Merriam Webster. Merriam-Webster, Inc.
- Matthews, R. L., Tse, Y. K., O’Meara Wallis, M., & Marzec, P. E. (2019). A stakeholder perspective on process improvement behaviours: Delivering the triple bottom line in SMEs. Production Planning & Control, 30(5-6), 437–447. https://doi.org/10.1080/09537287.2018.1501809
- Monteiro, M., Pacheco, C., Dinis-Carvalho, J., & Paiva, F. (2015). Implementing lean office: A successful case in public sector. FME Transaction, 43(4), 303–310. https://doi.org/10.5937/fmet1504303M
- Nǎftǎnǎilǎ, I., & Mocanu, M. D. (2014). Lean Office (LinOff) 2. Value stream mapping. Quality - Access to Success, 15(141), 75.
- Năftănăilă, I., & Mocanu, M. D. (2014). Lean office (LinOff): 3. Team Dynamics and lean Assessment. Quality - Access to Success, 15(142), 78–82.
- Ohno, T. (1988). Toyota production system beyond large-scale production. CRC Press.
- Pavnaskar, S. J., Gershenson, J. K., & Jambekar, A. B. (2003). Classification scheme for lean manufacturing tools. International Journal of Production Research, 41(13), 3075–3090. https://doi.org/10.1080/0020754021000049817
- Pereira Librelato, T., Pacheco Lacerda, D., Henrique Rodrigues, L., & Rafael Veit, D. (2014). A process improvement approach based on the value stream mapping and the theory of constraints thinking process. Business Process Management Journal, 20(6), 922–949. https://doi.org/10.1108/BPMJ-07-2013-0098
- Pika, A., Van Der Aalst, W. M. P., Wynn, M. T., Fidge, C. J., & Ter Hofstede, A. H. M. (2016). Evaluating and predicting overall process risk using event logs. Information Sciences, 98–120. https://doi.org/10.1016/j.ins.2016.03.003
- Rohleder, T. R., & Silver, E. A. (1997). A tutorial on business process improvement. Journal of Operations Management, 15(2), 139–154. https://doi.org/10.1016/S0272-6963(96)00100-3
- Sabur, V. F., & Simatupang, T. M. (2015). Improvement of customer response time using Lean office. International Journal of Services and Operations Management, 20(1), 59–85. https://doi.org/10.1504/IJSOM.2015.065972
- Shamah, R. A. M. (2013). A model for applying lean thinking to value creation. International Journal of Lean Six Sigma, 4(2), 204–224. https://doi.org/10.1108/20401461311319365
- Sousa, R. M., & Dinis-Carvalho, J. (2021). A game for process mapping in office and knowledge work. Production Planning & Control, 32(6), 463–472. https://doi.org/10.1080/09537287.2020.1742374
- Unwin, S. (2005). Business, science, art and the mindset for excellence. Total Quality Management & Business Excellence, 16(8-9), 1031–1040. https://doi.org/10.1080/14783360500163235
- Womack, J. P., Jones, D. T., & Roos, D. (1990). The machine that changed the world (1st Ed). Rawson Associates.
- Yokoyama, T. T., de Oliveira, M. A., & Futami, A. H. (2019). A systematic literature review on lean office. Industrial Engineering & Management Systems, 18(1), 67–77. https://doi.org/10.7232/iems.2019.18.1.067