
 ?Mathematical formulae have been encoded as MathML and are displayed in this HTML version using MathJax in order to improve their display. Uncheck the box to turn MathJax off. This feature requires Javascript. Click on a formula to zoom.
ABSTRACT
Undeformed tungsten suffers from a brittleness that makes it unsuitable for applications at low temperatures. Cold-worked tungsten materials such as drawn wires or rolled plates can however show considerable ductility even at low temperatures. The reason for this behaviour is so far not understood. We investigated a series of potassium-doped tungsten wires that were subsequently drawn from one sintered ingot, making them chemically identical. Hence, the properties of the wires could be studied without the influence of different impurity levels. Using transient mechanical tests, namely repeated stress relaxation experiments and strain-rate jump tests, the effective activation volumes and strain-rate sensitivities m of the wires were determined at room-temperature. Based on the obtained results, it is deduced that the motion of
screw dislocations by formation and dissociation of kink-pairs is controlling the rate of plastic deformation in all wires that show plasticity at room temperature. It is hence concluded that the ductility of drawn tungsten wires at low temperatures is not due to a change in the rate-controlling deformation mechanisms, but should be a consequence of the microstructural and textural changes during wire drawing.
1. Introduction
Tungsten features properties that render it superior to many other materials when it comes to applications at high temperatures. Due to its high melting point (, [Citation1]), tungsten exhibits a superior resistance against deformation at high temperatures [Citation2]. These properties in combination with a low erosion rate when subjected to a bombardment with fast ions and a low retention of hydrogen isotopes makes tungsten the main candidate for plasma-facing components of a future fusion reactor [Citation3]. The major drawback of polycrystalline tungsten is its brittleness in the undeformed state at temperatures below the so-called ductile-to-brittle transition temperature (
). This limits the use of tungsten as structural material to components operating at temperatures above
. The ductile-to-brittle transition temperature of tungsten is not a material constant but a complex function of microstructure, stress state, chemical composition, and strain rate during loading [Citation4, Citation5]. In 1909, Coolidge [Citation6, Citation7] was the first to produce a tungsten wire that showed plastic deformability at room temperature. Apart from drawn wires, deformed tungsten showing ductile behaviour also includes rolled plates [Citation8] and severely plastically deformed materials [Citation9]. shows the transition temperatures of a batch of K-doped drawn tungsten wires as a function of their diameter. It is apparent from that wires with lower diameter and hence higher accumulated deformation in the drawing process exhibit lower ductile-to-brittle transition temperatures. Thus, cold worked wires can deform plastically at room temperature and below. The ability of these thin wires to show plastic behaviour is exploited for their use as reinforcement fibres in fibre-reinforced composites [Citation10, Citation11].
Figure 1. Ductile-to-brittle transition temperatures (squares, left ordinate) and mean widths of elongated grains (circles, right ordinate) of doped drawn wires (according to A.J. Opinsky, L. Sama and L. Seigle (1958), see [Citation12]).
![Figure 1. Ductile-to-brittle transition temperatures (squares, left ordinate) and mean widths of elongated grains (circles, right ordinate) of doped drawn wires (according to A.J. Opinsky, L. Sama and L. Seigle (1958), see [Citation12]).](/cms/asset/628c7e2d-55f1-40ce-be5e-d444bc02569e/tphm_a_2184877_f0001_oc.jpg)
The reasons for the shift of upon cold working are not yet fully understood, but the change of the materials microstructure as a consequence of the cold working process is believed to play a crucial role. An example of a deformation-induced microstructural change is the decrease of the width of the elongated grains dominating the microstructure of drawn tungsten wires with decreasing wire diameter, which is also shown in . In case of tungsten wires, either a change of the microstructure or texture or the elementary mechanism governing the motion of dislocations as carriers of plastic deformation might be the reason for the ability to deform plastically at low temperatures. The only report of a transient mechanical test performed on a tungsten ribbon, i.e. a flattened drawn wire, was published by Boser [Citation13] in 1971. Based on strain-rate jump tests carried out at different temperatures, it was claimed that the flow stress of the ribbon can be explained by contributions from dislocation-dislocation and dislocation-point defect interactions. Pink and Gáal [Citation14] however put Boser's findings into perspective by interpreting them as a clear hint for the motion of dislocations in deformed tungsten wires/ribbons via the kink-pair mechanism (see Section 2). In order to study the rate-controlling deformation mechanism as a function of the wire diameter and thereby as a function of the accumulated deformation during wire drawing, we performed repeated stress relaxation experiments (RSRE) and strain-rate jump tests (SRJT) at room temperature on tungsten wires drawn to five different strains, i.e. wires with five different diameters. The results of repeated stress relaxation and strain-rate jump tests, namely the effective activation volume and the strain-rate sensitivity, allow for determining the deformation rate-controlling mechanisms. Any difference between the rate-controlling deformation mechanisms of the differently cold-worked tungsten wires could lead to an explanation for their difference in ductility at low temperatures when compared to unworked tungsten. Furthermore determining both the strain-rate sensitivity and the effective activation volume allows for studying the deformation mechanisms in more detail.
2. Theoretical background
The plastic deformation of metals is facilitated by the motion of dislocations. Dislocation motion is driven by an effective stress , which is the excess of the applied stress σ above the athermal component
[Citation15]:
(1)
(1) The athermal stress
is caused by microstructural constituents (grain boundaries, forest dislocations, secondary particles) which interact with dislocations via long-range stress fields [Citation16].
is considered strain-rate independent and is weakly depending on temperature through the temperature dependence of the shear modulus μ. For thermally activated deformation mechanisms, the rate of deformation
is given by
(2)
(2) where
is a pre-factor,
the height of the potential barrier that can be overcome by thermal activation,
the Boltzmann constant and T the absolute temperature. Equation (Equation2
(2)
(2) ) implies that if a metal were to be deformed with constant strain-rate
, the resulting effective stress
would depend on both strain rate and temperature. The rate-controlling mechanisms of the plastic deformation of a material can be characterised by the activation volume V and the strain-rate sensitivity m. The activation volume is defined as the stress dependence of the potential barrier
[Citation17, Citation18]
(3)
(3) The (dimensionless) strain-rate sensitivity describes the response of a material to a change in strain rate
.
(4)
(4) Activation volume and strain-rate sensitivity are related to each other by [Citation18]:
(5)
(5) The rate of plastic deformation of a wide variety of tungsten materials at low temperatures is controlled by the motion of screw dislocations with a Burgers vector of
, where
is the lattice constant of tungsten [Citation19]. Their three-dimensional core structure requires these dislocations to overcome a high potential barrier in order to propagate from one stable configuration (associated to a valley in the energy landscape, the so-called Peierls valley) to the next. The potential follows the periodicity of the crystalline lattice and is described by
, where u denotes the displacement of a dislocation line from a Peierls valley [Citation20]. Under the presence of an acting stress, a dislocation can form a kink-pair along its line. Thereby, a short dislocation segment is moved out of the Peierls valley. Lateral motion of the kinks along the barrier then moves the dislocation line into the neighbouring Peierls valley. The kink-pair mechanism is thermally activated with an activation energy of roughly
in tungsten [Citation5] and is often linked to the low plasticity of bcc metals at low temperatures. The kink-pair mechanism has been studied extensively in high-purity single crystals of various refractory metals (V, Ta, Nb, Mo, W) [Citation17, Citation21–29]. Two main regimes for the formation of kink-pairs can be discerned: In the low-stress regime, the two kinks are clearly separated and the force counteracting the applied stress that drives kink migration is the mutual elastic attraction of the kinks. Thus, the kink properties in this regime can be satisfyingly described by the elastic interaction (EI) approximation. The activation volume characterising the motion of dislocations in the low stress regime is given in [Citation27] as
(6)
(6) Here, λ is the kink height while
is a pre-logarithmic factor characterising the line tension of the screw dislocation
(7)
(7) with
and
being the upper and lower cut-off radii, respectively. In the framework of (screw) dislocations gliding via the kink-pair mechanism,
is of the order of magnitude of the kink width w [Citation27].
At higher effective stresses, when the kink-anti kink separation is too small to be handled by elasticity theory, the kink-pair has to be pictured as a bulge on the dislocation line. In this configuration, the line tension counteracts the applied stress. The activation volume for this so-called line tension (LT) approximation is given as [Citation27]
(8)
(8) where
is the curvature of the Peierls potential at its local minimum λ, and
is a factor that is entirely determined by the shape of the Peierls potential. The change-over from the elastic interaction approximation to the line tension approximation occurs at a stress
. The activation volume for dislocations motion via the kink-pair mechanism generally assumes values between
and
[Citation16]. The strain-rate sensitivity of the kink-pair mechanism may be calculated from Equation (Equation5
(5)
(5) ).
3. Materials and mechanical testing methods
3.1. Materials
The material investigated was potassium-doped, non-sag tungsten wire manufactured by OSRAM GmbH, Schwabmünchen. The starting material for all wires was a single sintered ingot. This ingot was hot worked by rolling, swaging and hammering into a rod of diameter. From this rod, wires were subsequently drawn by multiple passes through dies with different opening diameters. When a certain diameter reduction was achieved, a sufficient length of the wire was cut off and kept for characterisation. Wire drawing starts at temperatures around
[Citation30]. As the wire diameter decreases, the drawing temperature is lowered to approximately
for the thinnest wire. As all wires were drawn from the same sintered ingot, the impurity content is comparable throughout the series. Differences in the mechanical behaviour can hence not be caused by different impurity levels. The chemical composition of the sintered rod is summarised in .
Table 1. Composition of the sintered rod representing the starting point of the wire series investigated in this study.
The (logarithmic) strain accumulated during wire drawing is defined as
(9)
(9) under the assumption that the cross-section of each wire is perfectly circular. In Equation (Equation9
(9)
(9) ),
is the diameter of the rod representing the starting point of wire drawing and d the one of a specific wire, respectively. The wire diameters and corresponding accumulated drawing strains of the materials used in this study are listed in .
Table 2. Diameters and accumulated drawing strains of the tungsten wires investigated.
3.2. Mechanical testing
3.2.1. Sample preparation for mechanical testing
For testing thick wires () a custom-made clamping assembly (see Figure S1 in the Supplementary Material) was used. The assembly is made up of two half-cylinders the wire sample is guided around, while the ends of the wire specimen are fixed using a washer and a screw. The half-cylinders can be moved along a direction perpendicular to the tensile direction. Pure unidirectional tensile stress in the specimens is achieved if the wire is aligned with the axes of force transmission. The friction between the wire specimen and the lateral surface of the half-cylinders results in the maximum stress acting in the free length of the wire while the residual parts of the sample are loaded with lower normal stresses. Before the wire sample is clamped into the assembly, any remnants of graphite that is used as lubricant in the wire drawing process [Citation31] is removed using an aqueous
NaOH solution in which the wire samples are immersed for a duration of
. This cleaning step was only necessary for wires with diameters
.
Thin wires () were readied for mechanical testing following the procedure already developed by Riesch et al. and described in [Citation32]: In order to ensure that the wire specimen fractures in the measuring zone, both ends of a wire sample with a length of
are covered with an epoxy glue (UHU© Endfest 300), thus leaving a free length of
. After the glue has hardened, the glued ends are clamped in the upper and lower crossheads of a universal testing machine. Prior to the mechanical test, the position of the wire is aligned with the load axis using an x-y-table, thereby ensuring that the sample is stressed by pure uniaxial tensile stress.
3.2.2. Transient mechanical tests
All mechanical tests were performed using a TIRAtest® 2820 universal testing machine at room temperature. Load cells with different maximum loads ( for
,
for
and
for
) are used to measure the force. During the mechanical tests, the sample surface is recorded using a camera system consisting of a CMOS image sensor (Toshiba DU657M®) and a telecentric lens (Opto Engineering TC110-08/C®). Using a custom digital image correlation algorithm written in LabView®, the relative elongation of certain regions of the sample and thus the local engineering strain e is calculated. Since the load and the strain signals acquire data with different acquisition frequencies (
,
), averaging of the load signal was necessary. For this, we used the moment of fracture of the sample, since it is easily distinguishable in both signals. Thus, after the last relaxation cycle and the last strain-rate jump was completed, the samples were deformed with a constant crosshead velocity until they fractured. The elastic strain measured in each test was adjusted in a way that the slope in the elastic region matches the Young's modulus of tungsten at room temperature [Citation33]:
Engineering stresses R and strains e were converted into true stresses σ and strains ε, respectively, using [Citation34]
(10)
(10) and
(11)
(11)
3.2.2.1 Determination of strength
Two different parameters characterising the strength of the investigated tungsten wires, namely the yield strength and a maximum strength, were extracted from the stress-strain curves measured during the transient tests. Since both repeated stress relaxation experiments (RSRE) and strain-rate jump tests (SRJT) resemble standard uniaxial tensile tests up to the start of the first relaxation cycle or the first strain-rate jump, respectively, the yield strength can be obtained in the same manner as in standard tensile tests. Due to the high Young's modulus of tungsten, we report the proof stress
as yield stress. Using Equation (Equation11
(11)
(11) ), the (true) yield stress can be determined using
(12)
(12) Continuing the mechanical test after the last relaxation cycle allows for determining a maximum stress
(see also ). This maximum stress is not to be confused with the ultimate tensile strength
which can only be extracted from standard uniaxial tensile tests. Due to several strain-rate changes performed during a SRJT, the maximum stress reached in these experiments was not used for evaluation.
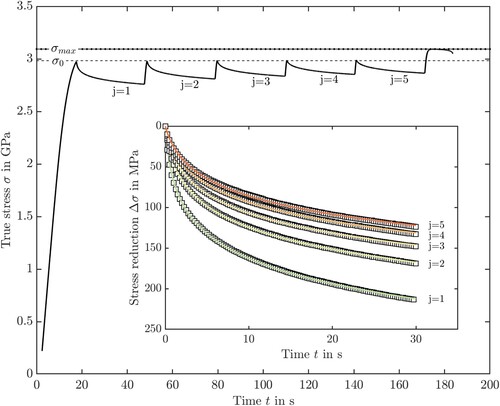
Figure 3. Temporal stress evolution during a repeated stress relaxation experiment performed on a drawn tungsten wire with a diameter of at room temperature. The inset shows the temporal stress decay
during the five relaxation cycles performed. For better visibility, only every fifth measured data point is drawn. The dashed lines represent the fitted stress decays following Equation (Equation15
(15)
(15) ).
3.2.2.2 Strain-rate jump tests (SRJT)
Strain-rate jump tests were carried out in order to determine the strain-rate sensitivity [Citation18]. The tests were performed by changing the crosshead velocity in the plastic region (). The change in crosshead velocity translates into a change from an initial strain rate
to a strain rate
. The material's response is a stress jump from
to
. These parameters are used to calculate the strain-rate sensitivity
(13)
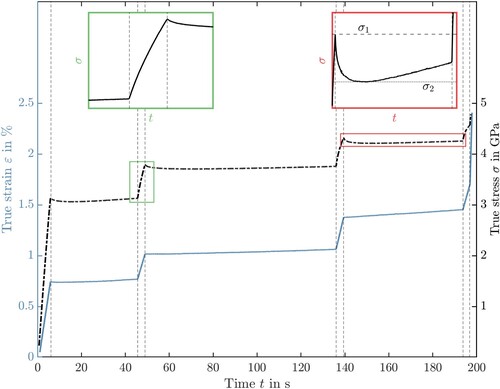
(13) The evolution of true strain and stress during a SRJT is illustrated in .
Figure 2. Temporal evolution of true strain (left y-axis) and stress (right y-axis) during a strain-rate jump test performed on a tungsten wire with a diameter of . Dashed vertical lines mark the times at which a strain-rate jump was performed. The two zoomed insets show jumps from low to high (green, left side) and from high to low strain rate (red, right side).
In addition to the strain-rate sensitivity, the apparent activation volume
(14)
(14) can be determined from a strain-rate jump. Note that the apparent activation volume is usually higher than the effective activation volume by a factor of 2 to 3 [Citation35]. Since the effective activation volume V was also measured in repeated stress relaxation experiments, the apparent activation volume from strain-rate jump tests was not used for subsequent evaluation. Several strain-rate jumps can be performed between the yield point and the maximum stress reached in the experiment. Since the equations for calculating σ and ε are only valid up to the point of ultimate tensile strength, no strain-rate jumps were performed between
and fracture of the sample. Only jumps from a higher to a lower strain rate were considered for determining the strain-rate sensitivity since for these jumps, the determination of
and
is more accurate than for jumps from a low to a higher strain rate. The influence of the magnitude of the ratio
on m was investigated but found to be insignificant, as long as
This value was then used as a lower boundary.
3.2.2.3 Repeated stress relaxation experiments (RSRE)
In the present study, the aim of performing repeated stress relaxation experiments was to determine the effective activation volume . RSRE were conducted following the method developed by Spätig et al. [Citation36]. Although the methodology has been explained in all its details elsewhere [Citation36], its main aspects are recapitulated here: The sample is deformed with constant crosshead velocity until a target load
is reached. At this point, the crosshead motion is stopped, and the sample is given a fixed amount of time
to relax the acting stress. Then, the sample is reloaded to
and the next relaxation cycle starts. In the present study, four to six relaxation cycles and a relaxation time for each cycle of
was used. The temporal stress decay during one relaxation process is described by a logarithmic decay in time
(15)
(15) where
is an apparent activation volume during stress relaxation (not to be confused with the apparent activation volume
accessible from strain-rate jump tests), t the time and
a time constant. The temporal evolution of the stress during a RSRE is shown exemplarily in .
The method developed by Spätig and co-workers involves determining during the first relaxation and the stress drops
for the first and all subsequent relaxations. The maximum decay of the stress
during each relaxation j allows for calculating a correction term for work-hardening
(16)
(16) The effective activation volume is then obtained as the difference between
and
:
(17)
(17) The strain-rate sensitivity is also accessible using the effective activation volume obtained from repeated stress relaxation experiments according to Equation (Equation5
(5)
(5) ):
(18)
(18) Several stress relaxation experiments at different stresses
were conducted for each wire type to probe the stress dependence of the activation volume and the strain-rate sensitivity.
4. Results
4.1. Strength
shows the mean maximum stress and yield strength versus accumulated drawing strain. The mean stresses are furthermore presented in . Two clear trends can be seen: Firstly, both the yield strength as well as the maximum stress increase with increasing logarithmic drawing strain. Secondly, within the measuring uncertainty, also the difference between yield stress and maximum stress increases with increasing accumulated drawing strain until it saturates at (cf. ).
Figure 4. Mean maximum stresses (black symbols, from RSRE) and yield strengths
(blue symbols, from RSRE and SRJT) and the difference
(red symbols) as a function of the accumulated drawing strain φ.
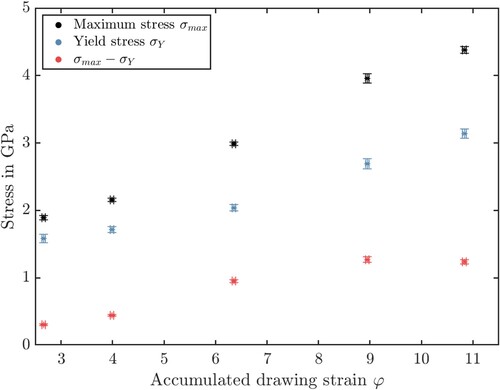
Table 3. Maximum stresses, yield stresses and the difference between both for the wires investigated in the course of this study.
4.2. Effective activation volume
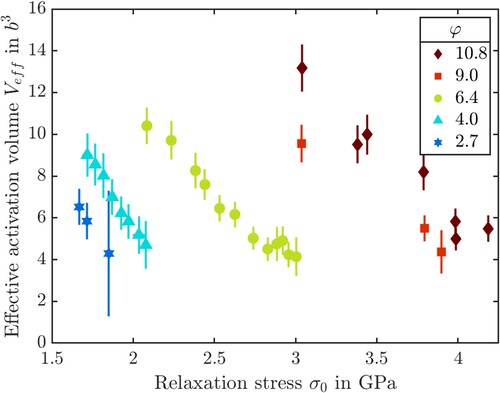
shows the effective activation volume from RSRE measured at different relaxation stresses
. The effective activation volume of each wire type, characterised by its accumulated drawing strain, decreases systematically with increasing relaxation stress. The effective activation volumes obtained from the investigated wires are in the range
.
Figure 5. Effective activation volume in
as a function of the relaxation stress
.
4.3. Strain-rate sensitivity
The stress dependence of the strain-rate sensitivity measured both in RSRE and SRJT is shown in . In case of RSRE the relaxation stresses while in case of SRJT the stress
at the higher strain rate is reported and used for plotting. A good correspondence between both experimental techniques is observed.
Figure 6. Strain-rate sensitivities from RSRE (filled symbols) and from SRJT (empty symbols) as a function of the relaxation and jump stress, respectively.
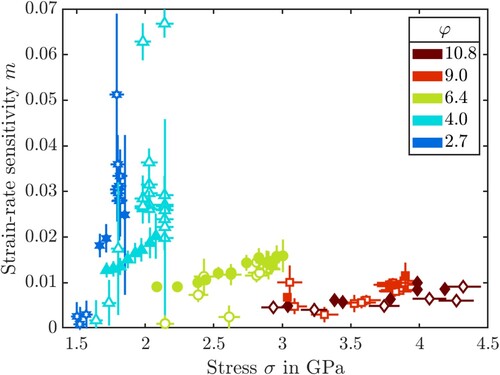
The obtained strain-rate sensitivities of drawn tungsten wires at room temperature are of the order of to
. Wires with higher accumulated drawing strains show overall lower strain-rate sensitivities. Similar to the determination of the effective activation volume from RSRE, the stress range (
, cf. ) in which the strain-rate sensitivity can be investigated shifts to higher stresses for wires with a higher accumulated drawing strain.
5. Discussion
5.1. Rate-controlling deformation mechanisms in drawn tungsten wires
According to [Citation18], the deformation rate-controlling mechanisms can be determined from the strain-rate sensitivity and the effective activation volume. Commonly, values of the strain-rate sensitivity and the activation volume without specification of the corresponding stress or averaged values over a large range of stresses are reported in literature. shows some of those for pure tungsten materials tested at room temperature.
Table 4. Strain-rate sensitivities and activation volumes of different tungsten materials at room temperature.
Judging from the order of magnitude of the obtained effective activation volumes, two rate-controlling deformation mechanisms, namely the overcoming of the Peierls barrier via a kink-pair mechanism, as well as grain boundary sliding (GBS) have to be considered. The characteristic activation volumes and strain-rate sensitivities of these two mechanisms are summarised in .
Table 5. Activation volumes and strain-rate sensitivities of grain boundary sliding and the kink-pair mechanism.
Grain boundary sliding is a deformation mechanism that is observed in coarse-grained (CG) materials at high homologous temperatures (), as well as in ultrafine-grained (UFG) or nanocrystalline (NC) materials at low temperatures [Citation42]. GBS was postulated to be contributing to the deformation of tungsten wires during wire drawing and in mechanical tests by Millner et al. [Citation43] in 1972 and before that by Schultz [Citation44] in 1959. Although stress-driven grain boundary movements have been observed in tungsten materials at room temperature [Citation45], grain boundary sliding is not likely to be rate-controlling the plastic deformation of tungsten wires at room temperature due to the following reasons: Firstly, the activation volumes obtained in the course of the study are still too large for the low values reported in literature for grain boundary sliding, while the measured strain-rate sensitivities of the tungsten wires are too low compared to the value stated for GBS (see ). Secondly, the trend of decreasing strain-rate sensitivity with increasing logarithmic strain measured for tungsten wires contradicts the established models for grain boundary sliding [Citation46, Citation47]. Although the underlying mechanisms for the materials showing GBS (CG or UFG/NC) may be different, they share an increased strain-rate sensitivity [Citation47]. Since the contribution of GBS to the deformation of UFG and NC materials (mirrored by an increased strain-rate sensitivity) is increasing with grain boundary density, i.e. the inverse of the grain size, one would assume an increase of m with the accumulated drawing strain of the tungsten wires. Since the opposite is true, GBS is probably not rate-controlling the plastic deformation of tungsten wires at room temperature. These considerations leave the kink-pair mechanism as active rate-controlling deformation mechanism. This conclusion is in-line with current literature, which refers to the kink-pair mechanism controlling the rate of plastic deformation at temperatures below the knee temperature (
[Citation37]) in various tungsten materials (as well as other refractory metals [Citation48, Citation49]), bridging the range from singe crystals [Citation17, Citation38] over coarse-grained materials [Citation39] to ultrafine-grained materials [Citation38, Citation40, Citation49]. There does not seem to be a significant influence of the manufacturing process (rolling, severe plastic deformation, powder metallurgical route with subsequent hot working) on the rate-controlling deformation process. With this conclusion, we confirm the up to now sole study on the rate-controlling deformation mechanisms in tungsten wires at room temperature [Citation13], which were already interpreted of being indicative of a kink-pair mechanism by Pink and Gaál [Citation14]. As already mentioned, the current study did not reveal any significant differences in the rate-controlling deformation mechanism of wire-drawn and unworked tungsten at room temperature. Hence, the reported shift of the ductile-to-brittle transition temperature upon working is not due to the rate-controlling mechanism of plastic deformation but must rather be rooted in the microstructural and/or textural transformation during wire drawing.
5.2. Outlook and suggestions for further analyses
As predicted by theory (see Equations (Equation6(6)
(6) ) and (Equation8
(8)
(8) )), the effective activation volume of the different tungsten wires decreases with increasing stress. Deciding whether kink-pair formation occurs within the realm of validity of the elastic interaction or the line tension approximations, and beyond that, investigating the kink-pair mechanism in more detail, is not possible with the experimental data obtained from the strain-rate jump tests and repeated stress relaxation experiments presented here. For such an endeavor, further information on the athermal stress component
would be required. Assuming that the athermal stress component stays constant throughout the whole transient mechanical test would be improper since work hardening increases
(see for example the evolution of true stress during a strain-rate jump test in or the decreasing stress drop of subsequent stress relaxation cycles). Several methods to determine the components of the applied stress have recently been reviewed by Kruml et al. [Citation50, Citation51]. They found that rapid stress reduction experiments [Citation52], also called strain dip tests, give the most accurate estimate of the effective and athermal stress component. Thus, we propose to perform strain dip experiments on the tungsten wires investigated in this study. Knowing the evolution of the athermal stress component as a function of strain during a transient mechanical test would allow for fitting the models for the stress dependence of the effective activation volume (Equations (Equation6
(6)
(6) ) and (Equation8
(8)
(8) )) and study e.g. the shape of the Peierls potential that dislocations in tungsten wires have to overcome in order to glide to a greater extend. This proposed analysis would furthermore reveal if there is any influence of the accumulated drawing strain on the kink-pair characteristics in tungsten wires.
6. Summary and conclusions
The present work represents the first systematic study on the deformation rate-controlling mechanisms in drawn tungsten wires over a wide range of accumulated strain during cold working. Using repeated stress relaxation experiments and strain-rate jump tests, the strain-rate sensitivities and effective activation volumes of tungsten wires with five different diameters were determined. It was clearly evidenced that the motion of screw dislocations via the kink-pair mechanism is controlling the rate of plastic deformation of ductile tungsten wires at room temperature. This finding leads to the conclusion that the rate-controlling deformation mechanism of tungsten at room temperature is unaffected by the extent to which it was deformed in a previous working process. It follows that the reason for the shift of the ductile-to-brittle transition temperature (see ) and the obtained room-temperature ductility of worked (rolled/SPD-processed/wire-drawn) tungsten has to lie in the interaction of dislocations with the materials microstructure and texture, which is uniquely changed during the working process. We will thus treat the subject of ductile cold-worked tungsten in a future study focusing on the microstructural evolution of tungsten wires. Furthermore, uniaxial tensile tests performed on the tungsten wires investigated in the course of this study will shed new light on their deformation mechanisms.
Supplemental Material
Download PDF (2.3 MB)Acknowledgments
This work has been carried out within the framework of the EUROfusion Consortium, funded by the European Union via the Euratom Research and Training Programme (Grant Agreement No 101052200 — EUROfusion). Views and opinions expressed are however those of the authors only and do not necessarily reflect those of the European Union or the European Commission. Neither the European Union nor the European Commission can be held responsible for them. The authors would like to thank B. Sancak for his assistance in performing transient mechanical tests. They are furthermore indebted to Dr. U. von Toussaint for sharing his experience in data fitting.
Disclosure statement
No potential conflict of interest was reported by the author(s).
Correction Statement
This article has been corrected with minor changes. These changes do not impact the academic content of the article.
Additional information
Funding
References
- E. Lassner and W.D. Schubert, Tungsten: Properties, Chemistry, Technology of the Element, Alloys, and Chemical Compounds, 1st ed., Springer, 1999.
- G.W. Meetham and M.H. van de Voorde, Refractory metals, in Materials for High Temperature Engineering Applications, G.W. Meetham and M.H. van de Voorde, eds., Springer, Berlin, Heidelberg, 2000, pp. 86–89.
- T. Hirai, S. Panayotis, V. Barabash, C. Amzallag, F. Escourbiac, A. Durocher, M. Merola, J. Linke, T. Loewenhoff, G. Pintsuk, M. Wirtz, and I. Uytdenhouwen, Use of tungsten material for the ITER divertor, Nucl. Mater. Energy 9 (2016), pp. 616–622.
- C. Bonnekoh, U. Jäntsch, J. Hoffmann, H. Leiste, A. Hartmaier, D. Weygand, A. Hoffmann, and J. Reiser, The brittle-to-ductile transition in cold rolled tungsten plates: Impact of crystallographic texture, grain size and dislocation density on the transition temperature, Int. J. Refract. Met. Hard Mater. 78 (2019), pp. 146–163.
- A. Giannattasio and S.G. Roberts, Strain-rate dependence of the brittle-to-ductile transition temperature in tungsten, Philos. Mag. 87 (2007), pp. 2589–2598.
- C.L. Briant and B.P. Bewlay, The coolidge process for making tungsten ductile: The foundation of incandescent lightning, MRS Bull. 20 (1995), pp. 67–73.
- W.D. Coolidge, Tungsten and method of making the same for use as filaments of incandescent electric lamps and for other purposes, U.S. Patent 1 226 470, July 19, 1912.
- C. Bonnekoh, A. Hoffmann, and J. Reiser, The brittle-to-ductile transition in cold rolled tungsten: On the decrease of the brittle-to-ductile transition by 600 K to 65∘C, Int. J. Refract. Met. Hard Mater. 71 (2018), pp. 181–189.
- I.V. Alexandrov, G.I. Raab, V.U. Kazyhanov, L.O. Sheastakova, R.Z. Valiev, and R.J. Dowding, Ultrafine-grained tungsten produced by SPD techniques, in Y. T. Zhu, T. G. Langdon, R. S. Mishra, S. L. Setniatin, M. J. Saran, and T. C. Lowe, eds., Proceedings of a Symposium Sponsored by the Shaping and Forming Committee of the Materials Processing and Manufacturing Division (MPMD) and the Mechanical Behavior Committee (Jt. SMD/ASM–MSCTS) of the Structural Materials Division (SMD) of TMS, Seattle, Washington, John Wiley & Sons, Inc., New York, 2002, pp. 199–207.
- B. Mainzer, C. Lin, M. Frieß, R. Riedel, J. Riesch, A. Feichtmayer, M. Fuhr, J. Almanstötter, and D. Koch, Novel ceramic matrix composites with tungsten and molybdenum fiber reinforcement, J. Eur. Ceram. Soc. 41 (2021), pp. 3030–3036.
- R. Neu, J. Riesch, A. Müller, M. Balden, J.W. Coenen, H. Gietl, T. Höschen, M. Li, S. Wurster, and J.H. You, Tungsten fibre-reinforced composites for advanced plasma facing components, Nucl. Mater. Energy 12 (2017), pp. 1308–1313.
- L.L. Seigle and C.D. Dickinson, Refractory Metals and Alloys: Effect of Mechanical and Structural Variables on the Ductile-Brittle Transition in Refractory Metals, Interscience, New York, 1963.
- O. Boser, The temperature dependence of the flow-stress of heavily-deformed tungsten, J. Less-Common Met. 23 (1971), pp. 427–435.
- E. Pink and I. Gaál, Mechanical properties and deformation mechanisms of non-sag tungsten wires, in The Metallurgy of Doped/Non-Sag Tungsten, E. Pink and L. Bartha, eds., Elsevier Applied Science, Essex, 1989, pp. 209–234.
- A. Seeger, The temperature dependence of the critical shear stress and of work-hardening of metal crystals, Lond. Edinb. Dublin Philos. Mag. J. Sci. 45 (1954), pp. 771–773.
- H. Conrad, Thermally activated deformation of metals, J. Met. 16 (1964), pp. 582–588.
- D. Brunner, Comparison of flow-stress measurements on high-purity tungsten single crystals with the kink-pair theory, Mater. Trans. 41 (2000), pp. 152–160.
- D. Caillard and J.L. Martin, Thermally Activated Mechanisms in Crystal Plasticity, 1st ed., Pergamon Material Series, Vol. 8, Pergamon, Amsterdam, 2003.
- H. Conrad, Yielding and flow of B.C.C metals at low temperatures, in The Relation Between the Structure and Mechanical Properties of Metals: Proceedings, National Physical Laboratory (Great Britain). Metallurgy Division, ed., Symposium (National Physical Laboratory (Great Britain))), H.M. Stationery Office, 1963.
- A. Seeger, Peierls barriers, kinks, and flow stress: Recent progress, Z. Für Metallkunde 93 (2002), pp. 760–777.
- F. Ackermann, H. Mughrabi, and A. Seeger, Temperature- and strain-rate dependence of the flow stress of ultrapure niobium single crystals in cyclic deformation, Acta Metall. 31 (1983), pp. 1353–1366.
- D. Brunner and J. Diehl, Strain-rate and temperature dependence of the tensile flow stress of high-purity-iron above 250 K (Regime I) studied by means of stress-relaxation tests, Phys. Status Solidi A 124 (1991), pp. 155–170.
- D. Brunner and J. Diehl, Temperature and strain-rate dependence of the tensile flow stress of high-purity-iron below 250 K: II. Stress/temperature regime II and its transitions to regimes I and III, Phys. Status Solidi A 125 (1991), pp. 203–216.
- D. Brunner and J. Diehl, Temperature and strain-rate dependence of the tensile flow stress of high-purity-iron below 250 K. I. Stress/temperature regime III, Phys. Status Solidi A 124 (1991), pp. 455–464.
- L. Hollang, D. Brunner, and A. Seeger, Work hardening and flow stress of ultrapure molybdenum single crystals, Mater. Sci. Eng. A 319–321 (2001), pp. 233–236.
- L. Hollang, M. Hommel, and A. Seeger, The flow stress of ultra-high-purity molybdenum single crystals, Phys. Status Solidi A 160 (1997), pp. 329–354.
- A. Seeger and U. Holzwarth, Slip planes and kink properties of screw dislocations in high-purity niobium, Philos. Mag. 86 (2006), pp. 3861–3892.
- A. Seeger, The temperature and strain-rate dependence of the flow stress of body-centred cubic metals: A theory based on kink-kink interactions, Int. J. Mater. Res. 72 (1981), pp. 369–380.
- M. Werner, Temperature and strain-rate dependence of the flow stress of ultrapure tantalum single crystals, Phys. Status Solidi A 104 (1987), pp. 63–78.
- J.A. Mullendore, The technology of doped-tungsten wire manufacturing, in The Metallurgy of Doped/Non-Sag Tungsten, E. Pink and L. Bartha, eds., Elsevier Applied Science, Essex, 1989, pp. 61–82.
- E. Pink and L. Bartha, eds., The Metallurgy of Doped/Non-Sag Tungsten, 1st ed., Elsevier Applied Science, Essex, 1989.
- J. Riesch, Y. Han, J. Almanstötter, J.W. Coenen, T. Höschen, B. Jasper, P. Zhao, C. Linsmeier, and R. Neu, Development of tungsten fibre-reinforced tungsten composites towards their use in DEMO–potassium doped tungsten wire, Phys. Scr. T167 (2016), pp. 014006.
- R. Lowrie and A.M. Gonas, Single-crystal elastic properties of tungsten from 24∘ to 1800∘C, J. Appl. Phys. 38 (1967), pp. 4505–4509.
- J.R. Davis, Tensile Testing, 1st ed., ASM International, Ohio, 2004.
- D.G. Morris, Strengthening Mechanisms in Nanocrystalline Metals, in Nanostructured Metals and Alloys: Processing, Microstructure, Mechanical Properties and Applications, W. H. Wang, eds., Woodhead Publishing, Sawston and Elevier, Amsterdam, 2011, pp. 299–328.
- P. Spätig, J. Bonneville, and J.L. Martin, A new method for activation volume measurements: Application to Ni3(Al,Hf), Mater. Sci. Eng. A 167 (1993), pp. 73–79.
- D. Brunner and V. Glebovsky, Analysis of flow-stress measurements of high-purity tungsten single crystals, Mater. Lett. 44 (2000), pp. 144–152.
- D. Kiener, R. Fritz, M. Alfreider, A. Leitner, R. Pippan, and V. Maier-Kiener, Rate limiting deformation mechanisms of BCC metals in confined volumes, Acta. Mater. 166 (2019), pp. 687–701.
- J. Kappacher, A. Leitner, D. Kiener, H. Clemens, and V. Maier-Kiener, Thermally activated deformation mechanisms and solid solution softening in W-Re alloys investigated via high temperature nanoindentation, Mater. Des. 189 (2020), pp. 108499.
- S.W. Bonk, Plastische Verformungsmechanismen in hochgradig kaltgewalzten, ultrafeinkörnigen Wolframblechen, Ph.D. Thesis, Karlsruher Institut für Technologie, Karlsruhe, 2018.
- Y.M. Wang, A.V. Hamza, and E. Ma, Temperature-dependent strain rate sensitivity and activation volume of nanocrystalline Ni, Acta. Mater. 54 (2006), pp. 2715–2726.
- J. Gubicza, Defect Structure and Properties of Nanomaterials, 1st ed., Elsevier, 2017.
- T. Millner, L. Varga, and B. Verö, The role of fibre boundaries during drawing of powder metallurgical tungsten wires, Z. Für Metallkunde 63 (1972), pp. 754–756.
- H. Schultz, Untersuchungen über Gitterfehlstellen in kaltverformtem Wolfram mit Hilfe von Restwiderstandsmessungen, Z. Für Naturkunde 14 (1959), pp. 361–373.
- F. Javaid and K. Durst, Stress-driven grain boundary movement during nanoindentation in tungsten at room temperature, Materialia 1 (2018), pp. 99–103.
- R.N. Stevens, Grain-boundary sliding in metals, Metall. Rev. 11 (1966), pp. 129–142.
- R.Z. Valiev, I.V. Alexandrov, Y.T. Zhu, and T.C. Lowe, Paradox of strength and ductility in metals processed by severe plastic deformation, J. Mater. Res. 17 (2002), pp. 5–8.
- B.G. Butler, J.D. Paramore, J.P. Ligda, C. Ren, Z.Z. Fang, S.C. Middlemas, and K.J. Hemker, Mechanisms of deformation and ductility in tungsten – a review, Int. J. Refract. Met. Hard Mater. 75 (2018), pp. 248–261.
- Q. Wei, S. Cheng, K. Ramesh, and E. Ma, Effect of nanocrystalline and ultrafine grain sizes on the strain rate sensitivity and activation volume: FCC versus BCC metals, Mater. Sci. Eng. A 381 (2004), pp. 71–79.
- T. Kruml, O. Coddet, and J.L. Martin, About the determination of the thermal and athermal stress components from stress-relaxation experiments, Acta. Mater. 56 (2008), pp. 333–340.
- T. Kruml, O. Coddet, G. Saada, and J.L. Martin, Stress reduction experiments during constant-strain-rate tests in Cu and Ge, Philos. Mag. Lett. 83 (2003), pp. 651–658.
- G.B. Gibbs, The activation parameters for dislocation glide, Philos. Mag. 16 (1967), pp. 97–102.