
 ?Mathematical formulae have been encoded as MathML and are displayed in this HTML version using MathJax in order to improve their display. Uncheck the box to turn MathJax off. This feature requires Javascript. Click on a formula to zoom.
ABSTRACT
An impact test was conducted on a single crystal of an Fe–3mass%Al alloy with a bcc structure. Microstructural changes in the sheared regions resulting from the impact test were examined. Deformation twinning was observed, with the twinning plane and the twinning shear direction
. The conjugate twinning direction
of this mode was discussed. Considering the shear direction required to induce deformation twinning, it can be concluded that
is appropriate for the twinning mode in the Fe–3mass%Al.
1. Introduction
Twinning frequently occurs during the deformation or transformation of metals and alloys. The twinning plane is a fundamental element used to describe atomic arrays after twinning in most metals and alloys [Citation1]. For metals and alloys with body-centred cubic (bcc) structure, it is common to observe the twinning plane
and the twinning shear direction
[Citation1]. The
twinning mode has been extensively studied and observed in
-Fe and its alloys [Citation1,Citation2]. In contrast, the
mode [Citation3], which is an uncommon twinning mode for bcc alloys, has been reported to occur in certain
-Ti alloys [Citation4–6].
Although the occurrence of the mode in
-Fe was not observed for a long time, recent studies have reported its presence [Citation7,Citation8]. However, the number of studies reporting the occurrence of
twinning in
-Fe is still limited [Citation7,Citation8]. This paper presents the occurrence of
deformation twinning in an Fe–3mass%Al alloy. This alloy possesses a bcc structure and a single crystal of this alloy was used to observe the twinning behaviour. The conjugate twinning direction
of this mode is discussed by considering the shear direction required to induce
deformation twinning. The obtained result for
in the Fe–3mass%Al alloy is compared with
reported for the
twinning in
-Ti alloys [Citation3,Citation4,Citation9–11].
2. Experimental
Aluminium is a ferrite stabilising element and Fe–Al solid solution alloys with aluminium content ranging from approximately 2–5 mass% maintain a bcc structure after solidification [Citation12–14]. For the present study, a cast sample of an Fe–3mass%Al alloy with coarse-grained microstructure provided by Nippon Steel Corp, Japan, was utilised. The chemical composition of this alloy is listed in .
Table 1. Chemical composition of the Fe–3mass%Al alloy
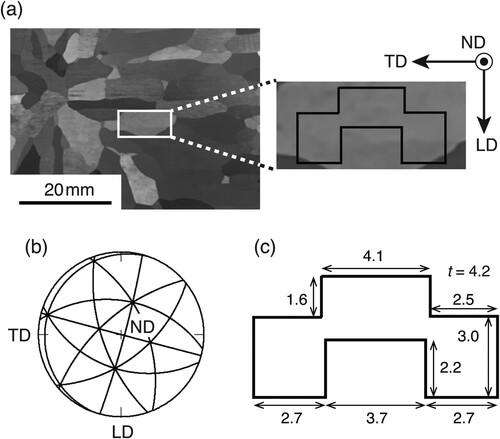
(a) shows the coarse grains of the Fe–3mass%Al alloy cut from the cast alloy. This sample takes the form of a plate with thickness of 4.2 mm, and some of grain boundaries are nearly perpendicular to the surface of the plate. An enlarged section of (a) shows the single-crystal specimen for impact test, which was obtained by electric discharge machining. The specimen has a two-dimensional hat-like shape [Citation15] and the load is applied to a protruded central part during the impact test. In (a), LD represents the direction of the impact load. ND is the normal direction of the specimen's surface, where microstructural observations were made after the impact test. TD is the direction perpendicular to LD and ND. (b) displays a stereographic projection (SGP) showing the orientation of the single-crystal specimen. As shown in this figure, ND is nearly parallel to . (c) presents the dimensions of the specimen.
Figure 1. Single-crystal specimen used in the present study obtained from a cast of an Fe–3mass%Al alloy with a coarse-grained microstructure: (a) shape, (b) orientation shown by stereographic projection (SGP) and (c) dimensions of the specimen. In (c), the unit is mm and t indicates the thickness.
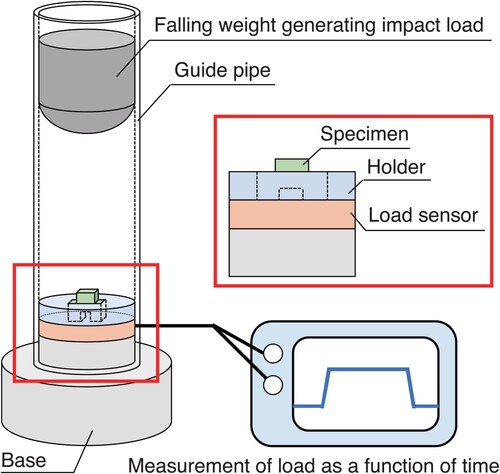
is a schematic illustration of the impact test setup. The single-crystal specimen was placed in a holder on a base. The impact load was applied to the protruded central part of the specimen at room temperature by a weight with the mass of 900 g, which was dropped freely from a height of 500 mm. This impact test is designed to induce localised shear deformation on both sides of the protruded central part. The impact load applied to the specimen was measured using a piezoelectric-film sensor [Citation16] and the load variation was recorded as a function of time.
Figure 2. Schematic illustration showing the impact test setup.
Microstructural changes resulting from the impact test were observed using field-emission scanning electron microscopy (FE-SEM, JSM-7001F, JEOL) and electron backscatter diffraction (EBSD) analysis technique. SEM observations were conducted at 15 kV, and the step sizes for EBSD measurements were from 0.03 to 0.1 μm. Variations of crystal orientations were determined using OIM Data Collection ver. 7.1.0. and the OIM Analysis ver. 7.3.0. (TSL Solutions), based on the results of EBSD measurements.
3. Results
3.1. Deformation of specimen caused by impact test
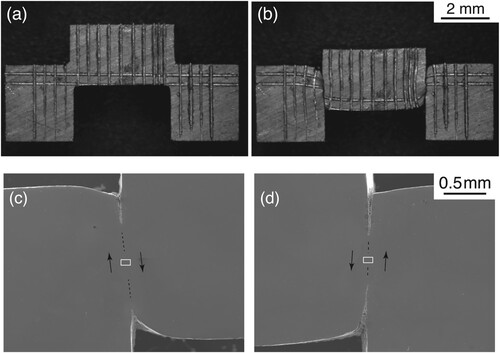
Localised shear deformation occurred by the impact test. (a) and (b) show the specimen before and after the impact test, respectively. The central part of the specimen experienced downward shearing in relation to the right and left sides, with a displacement of the top surface measuring 0.85 mm. Fiducial lines were scribed on the specimen's surface prior to the impact test to assess the extent of deformation. By analysing the local inclination of the horizontal lines after the impact test, the average shear strain in the localised shear zone was evaluated to be approximately
for both the left and right sides. (c) and (d) show polished surfaces of the left and right sides after the impact test, respectively. Cracks formed along the sheared zones on both sides. Results of SEM/EBSD measurements will be presented for the regions marked by white squares in (c) and (d). Although the crystal orientations are the same for both the left and right sides, microstructures in these two regions are different as will be shown later.
Figure 3. Deformation of the specimen caused by the impact test. Specimen shapes (a) before and (b) after the impact test. Polished surfaces of the (c) left and (d) right sides after the impact test. Cracks are visible in (c) and (d) along sheared zones. The white squares in (c) and (d) are the regions of SEM/EBSD measurements.
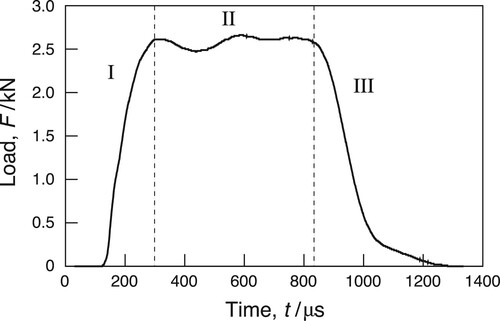
shows the variation of load as a function of time during the impact test. This variation of load is divided into the three stages from I to III. Stage I corresponds to the elastic deformation of the specimen. Plastic deformation occurs in stage II and terminates in stage III. The load during the plastic deformation was approximately 2.5 kN and remained nearly constant. The duration of the plastic deformation stage was around 540
. Using this value, the strain rates
were evaluated to be approximately
for both the left and right sides.
Figure 4. The variation of load as a function of time during the impact test. The load variation is divided into the three stages from I to III.
3.2. Microstructural changes on the right side
shows the SEM/EBSD results for the right-side region marked by the white square in (d). (a) is an inverse pole figure (IPF) map and crystallographic orientations along LD are shown using the colour code at the bottom of . Throughout this paper, all IPF maps show orientations along LD using this colour code. The black regions in the IPF map indicate areas with a confidence index (CI) values of less than 0.1, where orientations could not be determined. The central dark region in (a) corresponds to a macroscopic shear band. The orientations in the green regions adjacent to the shear band remained relatively constant. Drastic changes in orientations occurred at the boundaries of the shear band.
Figure 5. Microstructural changes in the right side resulting from the impact test. Inverse pole figure (IPF) maps for (a) the region within the white square shown in (d), (b) the enlarged region of a yellow square in (a), and (c) a pole figure for the macroscopic shear band shown in (a). The IPF maps show crystallographic orientations along LD using the colour code at the bottom.
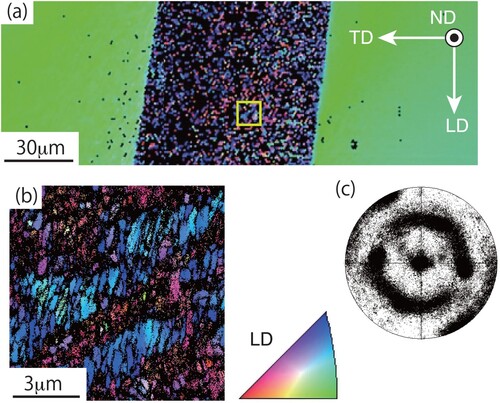
(b) is an enlarged region of a yellow square in (a), revealing fine grains and inclined bands. (c) is a pole figure for the macroscopic shear band shown in (a). This figure demonstrates that the initial
orientation parallel to ND is largely retained within the shear band. The microstructure shown in (b) is formed though rotation around ND. The formation of such fine grains as a result of shear localisation has been reported in previous studies, such as [Citation17].
3.3. Microstructural changes on the left side
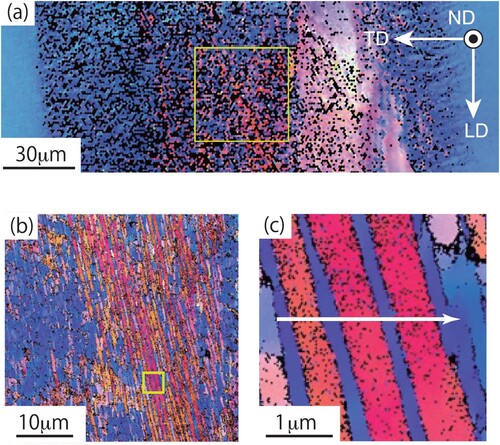
shows the SEM/EBSD results for the left-side region marked by the white square in (c). (a) is an IPF map of the macroscopic sheared region on the left side. The boundaries of the shear band are less distinct, and the microstructure differs significantly from that of the right side. (b) zooms in on a yellow square within (a), revealing red thin parallel bands formed within the blue regions. (c) further zooms in on a yellow square within (b). The red bands observed in (b) and (c) were only present on the left side of the specimen. The width of the red bands was about 0.6 and some of them extended over than 70
in length.
Figure 6. Microstructural changes in the left side resulting from the impact test. IPF maps for (a) the region within the white square shown in (c), (b) the enlarged region of a yellow square in (a) and (c) the further enlarged region of a yellow square in (b).
In addition to the specimen explained using , we conducted impact tests using several single-crystal specimens with different orientations and shear directions. While we observed various deformation microstructures in these specimens, we were unable to fully understand the orientation dependence of the deformation structure, including the differences between the left and right sides depicted in and . From this point forward, we will examine and discuss the unique red bands within the blue regions shown in .
3.4. Red parallel bands on the left side
(a) shows the variation in orientations along a white arrow in (c). The vertical axis of (a) represents the misorientation angles relative to the position at the base of the white arrow. It is noteworthy that orientations change more than at the boundaries between the red and blue regions. (b) presents a pair of SGPs showing orientations at positions of B and R in (a). A
pair which is situated almost on a basic circle of the SGP is indicated in each SGP. The green solid line in each SGP represents the trace of
. Notably, these green lines in the two SGPs are nearly parallel to each other, and the orientations at B and R are almost symmetrical with respect to
. This crystallographic feature indicates that the red bands are twinned in relation to the blue regions with the twinning plane
. The inclinations of the green lines in the SGPs in (b) also match the inclinations of the boundary traces between blue and red regions shown in (b) and (c).
Figure 7. Graphical presentations of the orientation variations shown in (c). (a) Change in orientations as a function of position along a white arrow in (c) and (b) a pair of SGPs showing orientations at the positions of B and R in (a). In (b), a pair and a green solid line showing a trace of
are indicated in each SPG.
![Figure 7. Graphical presentations of the orientation variations shown in Figure 6(c). (a) Change in orientations as a function of position along a white arrow in Figure 6(c) and (b) a pair of SGPs showing orientations at the positions of B and R in (a). In (b), a [332]−[113¯] pair and a green solid line showing a trace of (332) are indicated in each SPG.](/cms/asset/3b987f91-f328-4dd6-add9-9cca2efbf01f/tphm_a_2243831_f0007_oc.jpg)
As shown in (b), the red bands are surrounded by the blue regions. The orientations of the blue regions, such as the one depicted in (b) at B, are close to the initial orientation shown in (b). These indicate that the blue regions represent the parent phase, while the red bands represent the product phase. Additionally, the boundary traces between the blue and red regions shown in (b) are also almost parallel to the shear direction of the impact test shown in (c). These microstructural observations imply that the red bands are deformation twins formed within the blue region by the shear deformation during the impact test with the twinning plane and the twinning direction
.
In the SGP for the orientation at B shown in (b), a pair related to the most probable
twinning mode is depicted. Despite the fact that the
twinning mode experiences a greater amount of shear transfer during the impact test compared to the
twinning mode, the orientation relationship between B and R significantly deviates from that of the
twinning mode. The reason why the
twinning did not occur remains unanswered question in the present study.
4. Discussion
4.1. The  deformation twin
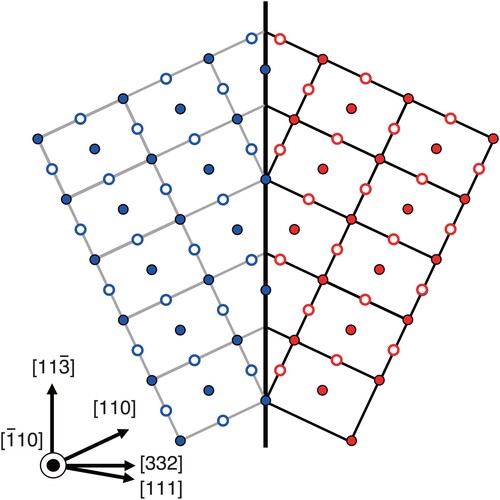
The blue and red circles in represent arrays of atoms on the plane, illustrating the twinning mode of
and
in bcc materials. Open circles represent atoms above the plane, while filled circles represent atoms below it. In relation to (c), blue circles depict a parent crystal corresponding to the blue region, while the red circles represent a twinned crystal corresponding to the red band.
Figure 8. Arrays of atoms on the plane for the twinning mode of
and
in bcc materials. Open circles represent atoms above the plane, and filled circles represent atoms below the plane.
Although displays the ideal atom arrangements for the twinning mode of and
, the observed orientations in the blue and red regions shown in are not exactly the same as those depicted in . For instance, the axis/angle pair representing the orientation relationship of grains for the
twinning mode is
, whereas the pair of SGPs at B and R in (b) correspond to
. The directions of the traces of
in the SGPs of (b) also slightly deviate from the directions of the red bands shown in (b) and (c). Slip and twinning are the two fundamental modes of plastic deformation during the impact test. The shear induced by twinning is at most about unity [Citation1], which is significantly less than the shear amount
of the present impact test. Therefore, both twinning and slip are expected to occur during the impact test. The slip can change the orientations of grains. The differences in crystallographic features between (b) and may be explained by orientation changes resulting from the slip.
As mentioned in the Introduction, the occurrence of the twinning mode has been reported in certain
-Ti alloys [Citation4–6]. Previous studies [Citation5,Citation6] have pointed out the significance of
phase stability in relation to the
twinning, and the twinning mechanism in metastable
-Ti alloys has been discussed [Citation11]. However, bcc is the stable structure for most
-Fe and its alloys and the occurrence of
twinning has been reported in
-Fe only following shock loading [Citation7, Citation8]. The present experiments also satisfy the condition of shock loading.
4.2. The conjugate twinning direction
To discuss the motion of blue atoms generating the twined crystal consisting of red atoms, it is essential to determine the conjugate twinning direction of the twinning mode [Citation1,Citation3]. In previous studies on the
twinning in
-Fe [Citation7,Citation8], the conjugate twinning direction
was not addressed. In the case of the
twinning mode in
-Ti alloys,
is believed to be
[Citation4,Citation9,Citation10,Citation11]. illustrates the atom motion for the
twinning with
. The thin black arrows represent the atom motion of simple twinning shear and shuffling is necessary for the atoms without the arrows. The q value [Citation3] for this mode is
and half of the atoms must shuffle to their correct twin sites [Citation3,Citation9]. To generate the deformation twinning shown in , the shear indicated by the thick black arrows must be applied. However, this applied shear direction is opposite to that on the left side of the specimen shown in (c). Consequently, the
twinning mode with
is not suitable for explaining the deformation twinning observed in the present study.
Figure 9. Motion of blue atoms to generate the twined crystal consisting of red atoms for the twinning with
. The thick black arrows represent the direction of the applied shear to induce this twinning. The thin black arrows indicate the atom motion of simple twinning shear and shuffling is necessary for the atoms without the arrows.
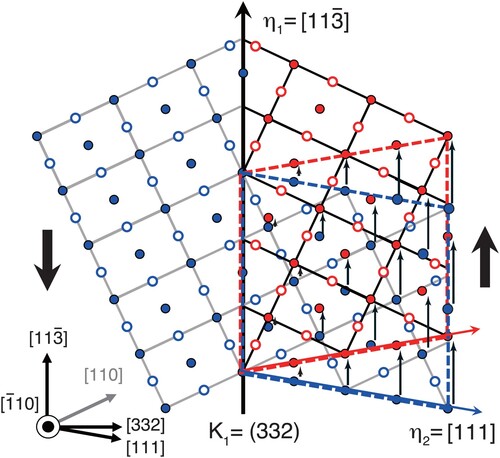
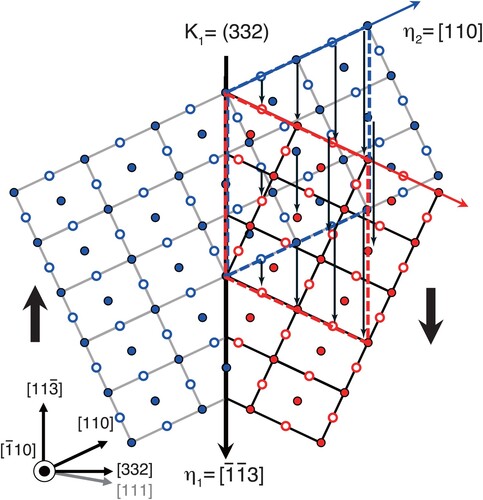
Another possibility of is
. Assuming
, the atom motion is illustrated in . The thick black arrows in represent the direction of applied shear that causes the twinning mode. This direction is consistent with that shown in (c). The thin black arrows in represent the atom motion of simple twinning shear and shuffling is necessary for the atoms without the arrows. The q value for this mode is calculated as
[Citation3], and two-thirds of the atoms must shuffle.
Figure 10. Motion of blue atoms to generate the twined crystal consisting of red atoms for the twinning with
. The thick black arrows represent the direction of the applied shear to induce this twinning. The thin black arrows indicate the atom motion of simple twinning shear and shuffling is necessary for the atoms without the arrows.
Generally, twinning is difficult to occur in modes where many atoms need to shuffle [Citation1,Citation3]. To rationalise the occurrence of this twinning mode with , we would like to point out the following two reasons: First, the sharp rise in temperature during an impact test, and second, the temperature dependence of twinning occurrence. In our experiments, a large shear deformation of approximately
occurred under a high-strain rare of about
. Under such dynamic conditions, adiabatic deformation takes place, leading to a temperature rise of a few hundred degrees Celsius in the sheared region [Citation18,Citation19]. At high temperatures, we can expect the activation of twinning modes that differ from those observed at low temperatures [Citation19,Citation20]. Various twinning modes have been reported for pure Ti, and the
mode is observed only at high temperatures [Citation20,Citation21]. The q value for the
mode is
[Citation20], and three-fourths of atoms must shuffle for this twinning mode to occur. The temperature dependence of this twinning mode is understood by considering that shuffling occurs more easily at high temperatures. This explanation accounts for the occurrence of the
twinning mode with
in the Fe–3mass%Al alloy the during the impact test. The amount of shear
for the twinning mode with
is
. Such a large amount of shear is reasonable for the occurrence of this twinning mode during the present impact test with significant shear strain.
5. Conclusion
An impact test was conducted using a two-dimensional hat-shape specimen made of a single crystal of an Fe–3mass%Al alloy with bcc structure. The impact test resulted in localised shear regions, and microstructural changes were observed in these sheared regions. Deformation twinning occurred in one of the sheared regions, and the twinning plane and the twinning shear direction
were identified for the deformation twinning. The conjugate twinning direction
of this mode was discussed. After considering the shear direction required to induce deformation twinning, it was concluded that
is appropriate for the twinning mode in the Fe–3mass%Al.
Author contributions
S.O. contributed to the study conception and prepared the original draft. T.A. and N.M. carried out the experiments and contributed to the interpretation of the results. All authors read and approved the final manuscript.
Acknowledgment
This work was supported by JSPS KAKENHI Grant Number 22K04668.
Disclosure statement
No potential conflict of interest was reported by the author(s).
Data availability
The datasets used and/or analysed during the current study available from the corresponding author on reasonable request.
Additional information
Funding
References
- S. Mahajan and D.F. Williams, Deformation twinning in metals and alloys. Int. Mater. Rev. 18 (1973), pp. 43–61.
- H.W. Paxton, Experimental verification of the twin system in alpha-iron. Acta. Metall. 1 (1953), pp. 141–143.
- A.G. Crocker, Twinned martensite. Acta. Metall. 10 (1962), pp. 113–122.
- M.J. Blackburn and J.A. Feeney, Stress-induced transformations in Ti–Mo alloys. J. Inst. Metals 99 (1971), pp. 132–134.
- S. Hanada, T. Yoshio, and O. Izumi, Plastic deformation mode of retained β phase in β-eutectoid Ti–Fe alloys. J. Mat. Sci. 21 (1986), pp. 866–870.
- S. Hanada, T. Yoshio, and O. Izumi, Effect of plastic deformation mode on tensile properties of beta titanium alloys. Trans. Japan Inst. Met. 27 (1986), pp. 496–503.
- L.M. Dougherty, G.T. Gray III, E.K. Cerreta, R.J. McCabe, R.D. Field, and J.F. Bingert, Rare twin linked to high-pressure phase transition in iron. Scr. Mater. 60 (2009), pp. 772–775.
- S.J. Wang, M.L. Sui, Y.T. Chen, Q.H. Lu, E. Ma, X.Y. Pei, Q.Z. Li, and H.B. Hu, Microstructural fingerprints of phase transitions in shock-loaded iron alloy. Sci. Rep. 3 (2013), pp. 1086.
- H. Tobe, H.Y. Kim, T. Imamura, H. Hosoda, and S. Miyazaki, Origin of {332} twinning in metastable β-Ti alloys. Acta Mater. 64 (2014), pp. 345–355.
- E. Bertrand, P. Castany, Y. Yang, E. Menou, and T. Gloriant, Deformation twinning in the full-α” martensitic Ti–25Ta–20Nb shape memory alloy. Acta Mater. 105 (2016), pp. 94–103.
- M.J. Lai, C.C. Tasan, and D. Raabe, On the mechanism of {332} twinning in metastable β titanium alloys. Acta Mater. 111 (2016), pp. 173–186.
- J. Herrmann, G. Inden, and G. Sauthoff, Deformation behaviour of iron-rich iron-aluminum alloys at low temperatures. Acta Mater. 51 (2003), pp. 2847–2857.
- J. Herrmann, G. Inden, and G. Sauthoff, Deformation behaviour of iron-rich iron-aluminium alloys at high temperatures. Acta Mater. 51 (2003), pp. 3233–3242.
- R. Rana, C. Liu, and R.K. Ray, Low-density low-carbon Fe–Al ferritic steels. Scr. Mater. 68 (2013), pp. 354–359.
- X. Bian, F. Yuan, Y. Zhu, and X. Wu, Gradient structure produces superior dynamic shear properties. Mater. Res. Lett. 5 (2017), pp. 501–507.
- Y. Fujimoto, E. Shintaku, Y. Tanaka, and J. Fujiyoshi, Pad type compressive force sensor suitable for high-speed impact force measurement. Trans. Jap. Soc. Mech. Eng. C 78 (2012), pp. 2438–2449.
- B. Wang, X. Wang, Z. Li, R. Ma, S. Zhao, F. Xie, and X. Zhang, Shear localization and microstructure in coarse grained beta titanium alloy. Mater. Sci. Eng. A 652 (2016), pp. 287–295.
- J.A. Hines and K.S. Vecchino, Recrystallization kinetics within adiabatic shear bands. Acta Mater. 45 (1997), pp. 635–649.
- Q. Xue, E.K. Cerreta, and G.T. Gray III, Microstructural characteristics of post-shear localization in cold-rolled 316L stainless steel. Acta Mater. 55 (2007), pp. 691–704.
- N.E. Paton and W.A. Bakofen, Plastic deformation of titanium at elevated temperatures. Metall. Trans. 1 (1970), pp. 2839–2847.
- G. Tsukamoto, T. Kunieda, S. Yamasaki, M. Mitsuhara, and H. Nakashima, Effects of temperature and grain size on active twinning systems in commercially pure titanium. J. Alloys Compd. 884 (2021), pp. 161154.