
 ?Mathematical formulae have been encoded as MathML and are displayed in this HTML version using MathJax in order to improve their display. Uncheck the box to turn MathJax off. This feature requires Javascript. Click on a formula to zoom.
ABSTRACT
In this paper, we describe how pre-service teachers portray stereotypical mathematics teachers. Using longitudinal data – from 2007 to 2020 – of pre-service teachers’ drawings (), we report on four clusters of stereotypical mathematics teachers. In all clusters, we find significant gender differences. Stereotypical teachers in two clusters share some physical, often unfavourable, appearances, and the stereotypical teachers in these clusters are primarily men. The remaining clusters show how pre-service teachers associate gender with mathematical content: Women teach simple arithmetic; men teach advanced algebra.
Introduction
Six decades ago, Mead and Metraux (Citation1957) showed that there exist stereotypical images of scientists, and their most prominent result was that children in the 1950s viewed stereotypical scientists almost exclusively as men. More recent studies reveal that stereotypical images persist and apply not only to science but also to other STEM subjects, such as engineering (Danielsson, Gonsalves, Silfver, & Berge, Citation2019) and pure mathematics (Brandell & Staberg, Citation2008). As an illustration, Picker and Berry (Citation2000) examined children’s drawings and concluded that children portray stereotypical mathematicians as “primarily male, all […] white, the majority with glasses and/or a beard, balding or with weird hair, invariably at a blackboard or computer”. From this and related studies, Schoenfeld (Citation2007, p. 4) maintained that “mathematics has an image problem”. It is generally accepted that stereotypical images, for example, those illustrated above, have practical consequences. Jugović, Baranović, and Marušić (Citation2012), for instance, provided evidence that gender stereotypes predict academic achievement. Moreover, Herzig (Citation2004) showed how some women do not “fit in” to male-dominant mathematics departments, and Danielsson et al. (Citation2019) illustrated how male students experience “troubled” identity trajectories due to “laddish” masculinities in engineering contexts.
From studies like these, we know much about how people stereotype “working scientists” and “working mathematicians”, and we know that such stereotypes have psychological effects. Less is known, however, about mathematical or scientific stereotypes outside the pure sciences. In our study, we have addressed this challenge. Specifically, we have researched mathematical stereotypes, but instead of studying stereotypical mathematicians, we have studied stereotypical mathematics teachers. At the general level, this change of context adds information about a central issue, namely, the extent to which stereotypes are context dependent. It is widely accepted that mathematics is context dependent – for instance, how chemists interpret graphs in idiosyncratic ways (e.g. Williams & Wake, Citation2007) – but it is an empirical question whether this context dependency also applies to the stereotypical images we hold about mathematical activities, for example, the view that mathematics is a male domain. The change of context also provides information at a more specific level: If we assume that one of the principles that explain human development is the desire to close the gap between actual and designated identity (e.g. Sfard & Prusak, Citation2005), then understanding how students stereotype mathematics teachers can help understand some of the processes involved when persons choose to become mathematics teachers (Darragh, Citation2013).
Inspired by Picker and Berry (Citation2000), the data in this study are pre-service teachers’ (PST) drawings of mathematics teachers. While Picker and Berry (Citation2000) mainly focused on geographic differences (i.e. they compared drawings in five countries), our study emphasised changes over time. Specifically, we have studied longitudinal data – ten data points between 2007 and 2016 in addition to one data point in 2020. Accordingly, in this paper, we address the following research questions:
What characterises student teachers’ images of mathematics teachers?
How did these stereotypical characteristics change between 2007 and 2020?
In broad strokes, we used a thematic analysis approach (TA) (Braun & Clarke, Citation2006) to find shared codes and themes in Norwegian PSTs’ () drawings of mathematics teachers. Subsequently, we applied hierarchical cluster analysis (HCA) (e.g. Ward, Citation1963) to find underlying clusters and trends in these codes and themes.
Theoretical underpinnings
Defining stereotype
Researchers in education and psychology have studied stereotypes for more than a century (e.g. Brauer, Judd, & Jacquelin, Citation2001; Brigham, Citation1971; Hamilton, Citation1981; Lippmann, Citation1922; Spencer, Steele, & Quinn, Citation1999; Vinacke, Citation1957). Nonetheless, there exists no consensus on how the term should be defined. As a response, Kanahara (Citation2006) synthesised research on stereotypes and concluded that definitions of stereotype share two characteristics: (1) they describe stereotype as related to beliefs (e.g. Allport, Citation1958); and (2) they describe stereotype as a group concept (e.g. Giddens, Citation2001; Krech, Crutchfield, & Ballachey, Citation1962). From this, Kanahara (Citation2006) defined stereotype as “a belief of a group of individuals”. In our study, we have adopted this definition. Accordingly, a stereotype depends not only on who is being stereotyped but also on who is stereotyping. Thus, when we in this paper say “stereotypical mathematics teachers”, we mean “stereotypical mathematics teachers stereotyped by Norwegian pre-service teachers”.
As Kanahara (Citation2006) documented, some researchers add truth-values to their definitions of stereotypes: Some define stereotypes as relatively true beliefs; others define them to be mostly false. For instance, Katz and Braly (Citation1935) defined stereotype as “a fixed impression, which conforms very little to the fact it pretends to represent” (p. 181). However, we agree with Kanahara (Citation2006) that the truth-value of a stereotype is an empirical question that is not bound by definition. In some cases, stereotypes are relatively accurate; in other cases, they represent matters of fact fallaciously. Indeed, in some cases, the truth value is a subjective matter that we cannot assess meaningfully.
Stereotypes and beliefs
One way to understand stereotypes is to contrast the term with beliefs; a nearby construct also contained in the definition of stereotype. As we interpret the term, a stereotype is a subset of beliefs. Specifically, beliefs are typically associated with a true/false dichotomy – people hold beliefs about what they think is objectively true and false (e.g. Philipp, Citation2007, p. 259). Accordingly, when someone experiences that their beliefs do not fit empirical experiences, they tend to change their beliefs. However, as we have argued, stereotypes are less affected by reality. For example, Western literature continues to draw an image of scientists as “an evil maniac and dangerous man” (Haynes, Citation2003, p. 243), even when writers know that, as a matter of empirical fact, this stereotype is false.
Thus, the way we see it, the true/false dichotomy of stereotypes relate not to reality but to other persons’ interpretations. For instance, one of several reasons why writers and filmmakers continue to portray scientists as “evil maniacs and dangerous men” is not that they believe these images to be authentic (as a matter of empirical fact) but because they believe it is true that people who read their books or watch their films associate the stereotyped image with the term “scientist”.
Drawings as representations of stereotypes
A consequence of defining stereotypes as a subset of beliefs is that drawings of mathematics teachers (i.e. the data in our study) do not capture stereotypes directly. That is, stereotype – when we define it as a form of belief – is a cognitive construct (e.g. Kanahara, Citation2006); a drawing, by contrast, is a physical object. Accordingly, although we assume that the drawings are affected by students’ stereotypical beliefs, we accept that the drawings, themselves, are not stereotypes. We see them as mere representations of stereotyped teachers of mathematics (as perceived by PSTs). Consequently, we assume that some characteristics of stereotypes are biased by design. That is to say; we assume that persons are more likely to represent in drawings those characteristics that are relatively easy to draw (say, how the stereotypes dress), and we assume that persons are less likely to represent those characteristics that are relatively hard to draw (say, how the stereotypes think, whether they have a narrow mindset, etc.).
Another assumption we make is that competing social and cognitive processes are involved when respondents draw images of mathematics teachers. For instance, persons who hold absolutistic views – for example, that mathematics is “a system of absolute truths, independent of human construction or knowledge” (Hersh, Citation1999, p. 60) – might emphasise specific characteristics of stereotypical mathematics teachers, while those who hold a fallibilist view – for example, that mathematical proofs are not “carved in granite” (Hersh, Citation1999, p. 60) – might emphasise alternative characteristics. Additionally, the drawings might be affected by the respondents’ values, which, unlike beliefs, are associated with a desirable/undesirable dichotomy (Philipp, Citation2007, p. 259). It might be the case, for example, that persons emphasise characteristics that they regard as highly positive or highly negative, and hence, give rise to extreme stereotypes (e.g. it might be the case that some persons over-emphasise negative experiences with mathematics when they stereotype mathematicians).
Although we assume that cognitive and social factors (e.g. those mentioned above) might affect how persons portray stereotypical mathematics teachers, we stress that none of these factors is the unit of analysis in our study. The results we report in this paper relate exclusively to descriptive representations of stereotypes, ignoring the social or psychological aspects that might have caused these images.
Empirical studies on stereotypes in mathematics education
Although stereotypes might be false (relative to matters of empirical facts), research has shown that they have a significant psychological effect, particularly on members of stereotyped groups. One of the most cited psychological phenomena that demonstrates this relationship is stereotype threat (ST). This phenomenon occurs when negative stereotypes affect persons who believe they belong to the stereotypical group. For instance, Spencer et al. (Citation1999) showed that when women in experimental settings were told that a mathematics test had shown gender differences in the past, the women underperformed relative to equally qualified men. However, when women were told that the test had never shown a gender difference, men and women performed equally.
A contrasting phenomenon associated with ST, is stereotype lift (SL). Persons who are affected by SL experience a performance boost due to a comparison with other stereotyped groups. As an illustration, Walton and Cohen (Citation2003) showed that when members of non-stereotyped groups take an intelligence test, they perform better if a negative stereotype about another group is linked to the test than when it is not. Typically, white males are likely to get performance boosts from SL. These experiments indicate that stereotypes have significant psychological effects, never mind how closely the stereotypes fit reality.
Apart from effect studies, a common aspect of stereotype research is mapping the shared characteristics related to different stereotypes. For example, Mead and Metraux (Citation1957) analysed high school students’ images of scientists and concluded that
the scientist is a man who wears a white coat and works in a laboratory. He is elderly or middle aged and wears glasses. He is small, sometimes small and stout, or tall and thin. He may be bald. He may wear a beard, may be unshaven and unkempt. He may be stooped and tired. (p. 126–127)
Although there seems to be a gender gap in how stereotypes in STEM are portrayed, other studies do not show any gender differences. Taasoobshirazi, Puckett, and Marchand (Citation2019), for instance, showed no gender differences by ST in biology. Moreover, Steinke, Applegate, Penny, and Merlino (Citation2022) provided evidence that adolescents preferred female over male STEM professionals. The following section outlines how we studied gender differences and other variables within mathematics teachers stereotypes in the Norwegian educational context.
Methods
Task and participants
We collected data 11 times between 2007 and 2020 from PSTs () at a Norwegian university. All students had mathematics as one of their subjects: Between 2007 and 2010, all students attended a compulsory mathematics course as part of their teacher education; after 2010, participants in the study consisted of students who chose mathematics voluntarily. In their very first mathematics lecture in their teacher education programme (i.e. before participating in mathematical activities and meeting most faculty members), each student responded to the following task (in Norwegian): “Draw a mathematics teacher (time limit: 10 min). No stick figures!” In , we present the distribution of the number of responses. Participants were provided verbal information about the study, including their rights to withdraw their contributions.
Table 1. Distribution of responses.
Drawing as a research instrument
Cohen, Manion, and Morrison (Citation2018) refer to documents (e.g. drawings) as compressed performances. That is, drawings enable students to express issues they do not have the professional vocabulary to talk about. In some cases, drawings can reveal what students unconsciously believe, for instance, about the nature of the teaching and learning of mathematics. However, drawings are complex documents that make sense only relative to the situations in which they are produced, including the respondents’ preconceptions.
According to Kress and van Leeuwen (Citation1996), drawings may have different characteristics: Some are narrative representations of actual events; others are conceptual representations of typical events. Thus, some drawings in our sample might reflect actual experiences (we assume, for instance, that some PSTs drew an actual teacher). Other drawings, by contrast, might reflect images PSTs hold about typical mathematics teachers. Images of typical mathematics teachers can be affected by multiple sources such as educational experiences, movies, literature, and beliefs about the nature of mathematics. We acknowledge that we do not have data to distinguish these forms of drawings. Accordingly, the results we report in this paper rely on a union of drawings with multiple characteristics. We encourage future research to conduct fine-grained designs that distinguish drawings of actual mathematics teachers from imagined stereotypical mathematics teachers.
Phase 1: qualitative data analysis
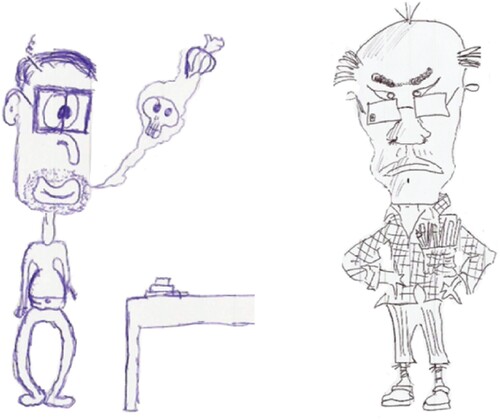
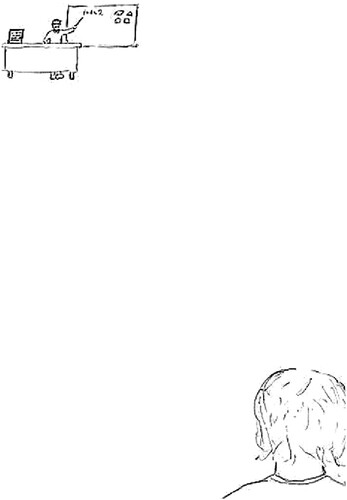
In the analysis, we first conducted a thematic analysis in NVivo (International, Citation1999), inspired by principles presented by Braun and Clarke (Citation2006). Each drawing was first coded openly using both semantic and latent codes. The semantic codes were extracted directly from parts of the drawings. In , we illustrate a drawing with the semantic codes “male”, “pointer”, “calculator”, and “blackboard”. The latent codes required more subjective interpretations than did semantic codes. In , we illustrate how we interpreted the facial expression and the physical posture of a drawn mathematics teacher as “unsympathetic”. Typically, unsympathetic teachers had grumpy expressions, looked frightening, and showed a readiness to “take a mick out of students”. After we had coded each drawing openly, we conducted another iteration of the coding process. This time, we imposed the codes that we discovered in the first phase on all drawings.
Figure 1. Examples of the semantic codes “male”, “pointer”, “calculator”, and “blackboard”.
Note. Speech-bubble (the idiomatic English translation): “Press such and such, and then you press solve! Hehe”.
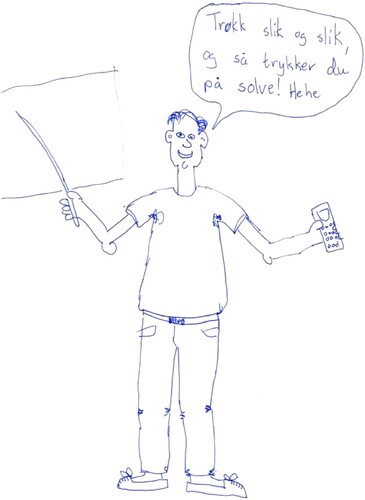
Figure 2. Examples of drawings where the latent codes “unfavourable appearance” (left) and “unsympathetic” (right) were applied.
Phase 2: descriptive analysis
To get a first impression of the characteristics that most students associate with mathematics teachers, we counted the number of drawings that included each code (i.e. each characteristic). Also, to examine whether students’ drawings changed substantially between 2007 and 2020, we compared the results from drawings made in 2007–2011 with the results from drawings made in 2012–2020. For the codes that showed significant differences, we examined the differences year by year to see if the changes were steady or abrupt between 2007 and 2020.
Phase 3: hierarchical cluster analysis
Following the descriptive analysis, we used HCA to examine whether relatively stable subgroup stereotypes existed in the drawings. Like cluster analysis, HCA clusters a heterogeneous sample – in our case, characteristics of mathematics teachers – into fewer, manageable subgroups (Clatworthy, Buick, Hankins, Weinman, & Horne, Citation2005). Specifically, HCA produces dendrograms where more similar items (i.e. characteristics) connect at the more specific nodes, and more different items connect at the more general nodes. In this part of the analysis, we focused on the frequently drawn characteristics; hence, we included only characteristics drawn 100 times or more.
To conduct the HCA, we used R (Team, Citation2020) with the packages tidyverse (Wickham et al., Citation2019), cluster (Maechler, Rousseeuw, Struyf, Hubert, & Hornik, Citation2019), factoextra (Kassambara & Mundt, Citation2020), and dendextend (Galili, Citation2015). For the similarity measures between the characteristics, we used the Euclidean distances on scaled scores, and for the clustering method, we used Ward’s method (Ward, Citation1963). Like other algorithms for hierarchical agglomerative (i.e. “bottom-up”) cluster analysis, Ward’s method is a step-by-step process in which, in the first step, each case (i.e. each characteristic) is regarded as an individual cluster. Then, the most similar clusters are joined for the subsequent steps, leading to the final step in which all cases are joined in one cluster (Clatworthy et al., Citation2005). This method generates a hierarchical tree; determining the number of clusters is a matter of qualitative interpretation.
To seek evidence for stability, we performed analyses multiple times using different subsamples of the data, as explained by Clatworthy et al. (Citation2005). After a first analysis, we randomly removed 50% of the data and conducted a similar analysis to the complete data set. We replicated this procedure ten times and removed the characteristics that appeared unstable in this process. We continued this process until the dendrogram had saturated, that is, when it seemed to be relatively unaffected by which subset of drawings we included in the analysis.
Results
Descriptive analysis
The characteristics that emerged from the Thematic Analyses (TA) are illustrated in . As a first, rough interpretation, the stereotypical mathematics teacher, as drawn by PSTs, is a man who wears glasses and chequered clothes, has facial hair and hair loss (i.e. he is middle-aged), and teaches arithmetic or algebra using a teacher-centred pedagogy. This description fits the stereotype of a male mathematician depicted by Picker and Berry (Citation2000) about twenty years ago.
Figure 3. Characteristics of mathematics teachers in students’ drawings.
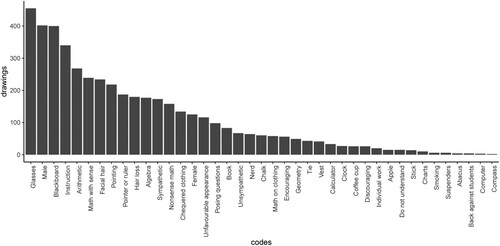
In 24% of the drawings, the respondents drew persons with no features of mathematics or teaching (e.g. ). However, in cases where pedagogical activities were involved, the majority portrayed mathematics teachers as highly teacher-centred. We appreciate that this observation might have been biased by design; for the respondents, it might have been relatively straightforward to draw a teacher-centred than a student-centred activity (mainly when the respondents were prompted to focus on the teacher). Nevertheless, a qualitative interpretation of the drawings supported an impression that at least some of the respondents wished to emphasise that mathematics teachers typically take a teacher-centred approach: some drawings included question marks over students’ heads, and some included a clear power relation between the teacher and the students, for example, when the teacher, through speak bubbles, said things like “If you do not understand this, the Grim Reaper will come to get you”, and “Hate math! Hate you!” Others (e.g. ) illustrated the teacher-centred pedagogy as a physical distance between the teacher and the students.
Figure 4. An example of a mathematics teacher stereotype with no distinguishing features, except for the physical attributes.
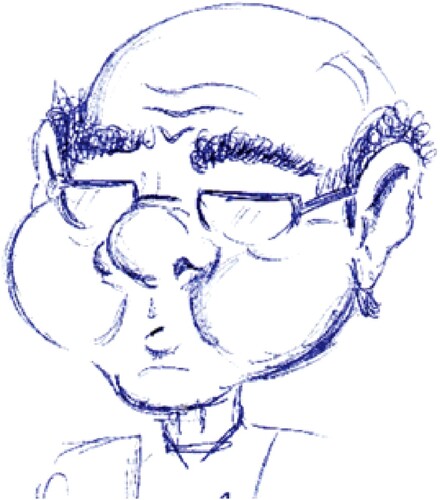
Figure 5. An example of a teacher-centred view of the teaching of mathematics.
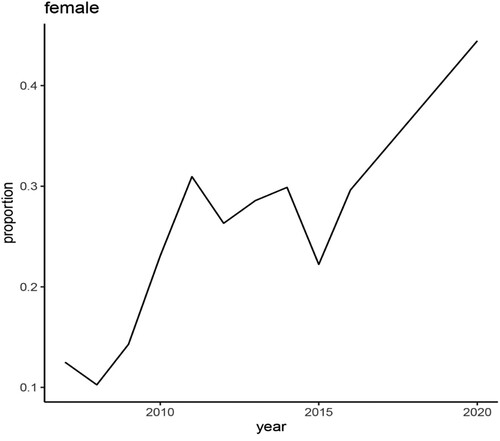
When we examined changes from 2007 to 2020, we found only one characteristic that showed a significant trend. In 2007, the proportion of drawn female teachers was 12.5%, excluding drawings where we could not determine the gender. In 2020, the proportion of drawn female teachers had increased to 44% (see ). Thus, it appears that PSTs around 2007 viewed mathematics more as a male domain than did PSTs in 2020. However, the reported change was only of a quantitative nature (i.e. the proportion of drawn women). As we will show later, the qualitative differences – how male and female teachers were portrayed, never mind the proportion – were relatively small.
Figure 6. The proportion of drawn female mathematics teachers between 2007 and 2020.
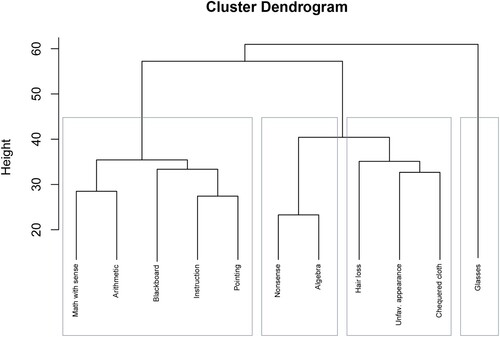
Hierarchical cluster analysis
The HCA indicated four clusters of common characteristics, as illustrated in . Two of the clusters related to the appearances of the mathematics teachers; two clusters related to the mathematical topics. Moreover, males and females were distributed unequally to the clusters. In the rest of this section, we explain the clusters in more detail and how they relate to gender differences.
Figure 7. Dendrogram showing four clusters of mathematics teachers.
The appearances of stereotypical mathematics teachers
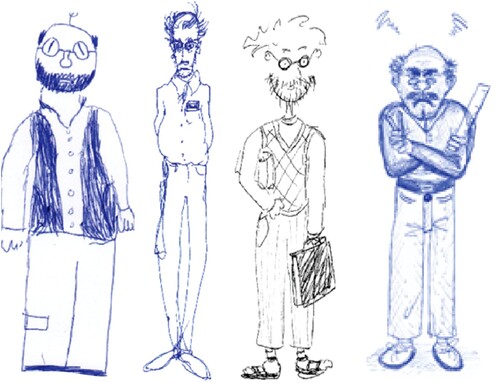
The first cluster comprises drawings that portray mathematics teachers detached from teaching activities. Here, the most stable characteristics, which were relatively unaffected by which drawings we included in the analysis, were “hair loss’, “unfavourable appearance”, and “chequered clothing”. Often, drawings in this cluster included other physical attributes, such as “nerd”, “vest”, and “math on clothing”, but these characteristics were less stable than the characteristics listed in . A line-up of mathematics teachers with such characteristics is illustrated in . As the figure suggests, the drawings in this cluster were primarily men. The likelihood that male teachers had hair loss (41%), unfavourable appearances (20.4%), and chequered clothing (25.6%), for instance, was more significant than the likelihood that females had hair loss (0%), unfavourable appearances (4.8%), and chequered clothing (4.8%). The Fisher-exact test indicated that the differences between males and females were significant () for all characteristics.
Figure 8. A line-up of stereotype mathematics teachers (cluster 1).
Also, the second cluster referred to the appearances of mathematics teachers, but this cluster consisted of one characteristic only: Glasses. This characteristic was also the most frequently drawn, and the likelihood that male teachers wore glasses (72.4%) was significantly greater () than the likelihood that female teachers wore glasses (39.2%). Undoubtedly, the relatively high frequency of this characteristic can be explained by the fact that people, in general, are more likely to wear glasses than, say, a tie or chequered clothing. Nevertheless, the observation adds to the impression that students hold views on the physical appearances of stereotypical mathematics teachers. Indeed, a few cases indicated that the inclusion of glasses was more than accidental. The most illustrative example is the drawing by one respondent who drew a stereotypical mathematics teacher simply as a pair of glasses ().
Figure 9. A portrait of a mathematics teacher (cluster 2).

Stereotypical mathematics teachers and mathematics topics
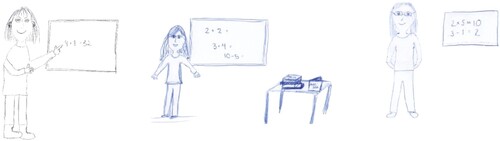
The cluster with most characteristics included drawings of mathematics teachers standing before a blackboard pointing towards scripts of simple arithmetic (most typically or
). Although both males and females were included in this cluster, women were more likely to be associated with simple arithmetic than were men. When we included only drawings that contained mathematics, females were more likely to teach arithmetic (81.0%) than were males (61.6%), and the difference was significant (
). Three examples of stereotypical mathematics teachers who fit closely with cluster 3 are illustrated in .
Figure 10. Women teaching simple arithmetic (cluster 3).
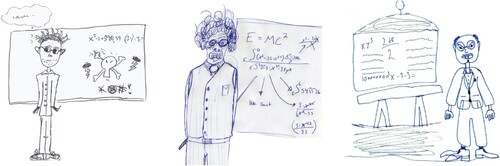
In contrast to women teaching simple arithmetic, a common theme in the drawings was nonsensical algebra (i.e. random symbolic or algebraic expression). Often, the mathematics teachers in this cluster were men. If we consider only drawings that contained mathematics, the likelihood that women were associated with algebra was 30.2%; the likelihood that men were associated with algebra was 50%. The difference was significant (). Also, as illustrated in the dendrogram (), algebra, more often than arithmetic, was associated with the physical attributes of the teacher, such as hair loss, unfavourable appearance, and chequered clothing. In , we illustrate three stereotypical mathematics teachers teaching nonsense algebra.
Figure 11. Men teaching nonsense algebra (cluster 4).
Note. Speech-bubble (the idiomatic English translation): (left) “Idiots’; (centre) “Not true”.
Discussion
Some 20 years ago, Picker and Berry (Citation2000) showed that certain stereotypical images are common when lower-secondary students draw images of mathematicians. In this study, we have found that such stereotypes also exist for mathematics teachers. Specifically, we have shown that PSTs draw stereotypical mathematics teachers as men who wear glasses and chequered clothes, have facial hair, hair loss, and teach arithmetic or algebra using a teacher-centred pedagogy.
Furthermore, when we examined subgroups of stereotyped mathematics teachers, we found a relationship between gender and mathematical topics. Women were more likely than men to be associated with simple arithmetic; men were more likely than women to be associated with advanced (often nonsensical) algebra. This result is consistent with Brandell et al.’s (Brandell, Nyström, & Sundqvist, Citation2004, p. 12) results, which indicate that when students grow older, they are more likely to perceive mathematics when they are exposed to more advanced mathematics as a male domain.
Another observation we make is that the mathematical topics were mixed in ways we found unrealistic in some of the drawings. As an example, several PSTs combined simple arithmetic, advanced calculus, and physics. This finding suggests that at least some PSTs drew what Kress and van Leeuwen (Citation1996) referred to as “conceptual representations” of mathematics teachers, that is, images containing a collection of elements, each of which (in isolation) are typical for mathematics teachers. In some of these “conceptual drawings”, we found traces of the Einstein effect, documented by Picker and Berry (Citation2000). For example, when the formula appeared in drawings, it was most likely combined with unrelated mathematics and physical attributes such as brushy hair and unfavourable appearance (e.g. ).
We acknowledge the limitations of our study. Visual data, for instance, can easily be overinterpreted (Cohen et al., Citation2018), and therefore, we cannot make firm claims about the processes that caused drawings. We cannot say, for instance, whether the PSTs drew images of whom they wanted to become or what they wanted to avoid. We also recognise difficulties in drawing mathematical activities. It is possible, for instance, that some students drew “teachers in front of a blackboard”, partly because this image is relatively static, and hence, easier to draw than the more vigorous activities (e.g. problem-solving and classroom discussions). We maintain, therefore, that characteristics involving vigorous activities are less reliable than those involving static attributes.
Sam and Ernest (Citation2000) argued that, in part, negative images of mathematics explain poor recruitment to mathematics-related subjects. Hence, we maintain that teacher education programmes should challenge negative conceptions, for example the views we found in this study: that women are most fitted to teach simple arithmetic and that algebra is a mean topic taught mainly through men with unfavourable appearances.
Changing preconceptions, however, is a difficult task (Kane, Sandretto, & Heath, Citation2002, p. 180). One reason for this difficulty, we believe, is that our indirect experiences with mathematics – those we encounter in the arts and literature, for instance – contribute, at least partially, to our images of mathematics and mathematics teachers. It has been shown that science fiction affects students’ attitudes toward science education (Surmeli, Citation2012). We have no reason to assume that our mathematics images are immune to similar effects. When popular literature continues to connect advanced mathematics with “weird men”, it might affect the identity work of future mathematics teachers, both men and women.
We propose that future studies examine the extent to which students’ stereotypical images of mathematics teachers are affected, both by direct and indirect experiences with mathematics education. Furthermore, cross-cultural studies could shed a better light on the stereotypical conception of mathematics teachers and how students of various cultural backgrounds perceiveFootnote1 mathematics teachers and teacher education (Farsani, Radmehr, Alizadeh, & Zakariya, Citation2021).
Ethics
The ethical considerations of study has been approved by the Norwegian Centre for Research Data #991438.
Disclosure statement
No potential conflict of interest was reported by the authors.
Notes
1 From students' perspective by adopting a first person's approach.
References
- Allport, G. W. (1958). The nature of prejudice. Garden City, NY: Doubleday Company.
- Brandell, G., Nyström, P., & Sundqvist, C. (2004). Mathematics—a male domain? In ICME 10, topic study group 26, gender and mathematics education. Copenhagen, Denmark. https://www.maths.lth.se/GeMa/konferenser/ICME.pdf
- Brandell, G., & Staberg, E. (2008). Mathematics: A female, male or gender-neutral domain? A study of attitudes among students at secondary level. Gender and Education, 20(5), 495–509.
- Brauer, M., Judd, C. M., & Jacquelin, V. (2001). The communication of social stereotypes: The effects of group discussion and information distribution on stereotypic appraisals. Journal of Personality and Social Psychology, 81(3), 463–475.
- Braun, V., & Clarke, V. (2006). Using thematic analysis in psychology. Qualitative Research in Psychology, 3(2), 77–101.
- Brigham, J. C. (1971). Ethnic stereotypes. Psychological Bulletin, 76(1), 15–38.
- Clatworthy, J., Buick, D., Hankins, M., Weinman, J., & Horne, R. (2005). The use and reporting of cluster analysis in health psychology: A review. British Journal of Health Psychology, 10(3), 329–358.
- Cohen, L., Manion, L., & Morrison, K. (2018). Research methods in education (8th ed.). London; New York: Routledge.
- Copur-Gencturk, Y., Thacker, I., & Quinn, D. (2021). K-8 teachers' overall and gender-specific beliefs about mathematical aptitude. International Journal of Science and Mathematics Education, 19(6), 1251–1269.
- Danielsson, A. T., Gonsalves, A. J., Silfver, E., & Berge, M. (2019). The pride and joy of engineering? The identity work of male working-class engineering students. Engineering Studies, 11(3), 172–195.
- Darragh, L. (2013). Constructing confidence and identities of belonging in mathematics at the transition to secondary school. Research in Mathematics Education, 15(3), 215–229.
- Farsani, D., Radmehr, F., Alizadeh, M., & Zakariya, Y. F. (2021). Unpacking the black-box of students’ visual attention in mathematics and English classrooms: Empirical evidence using mini-video recording gadgets. Journal of Computer Assisted Learning, 37(3), 773–781.
- Galili, T. (2015). Dendextend: An R package for visualizing, adjusting and comparing trees of hierarchical clustering. Bioinformatics (oxford, England), 31(22), 3718–3720.
- Giddens, A. (2001). Sociology (4th ed.). Oxford, UK: Polity.
- Hamilton, D. L. (Ed.). (1981). Cognitive processes in stereotyping and intergroup behavior. Hillsdale, NJ: Lawrence Erlbaum Associates.
- Haynes, R. (2003). From alchemy to artificial intelligence: Stereotypes of the scientist in Western literature. Public Understanding of Science, 12(3), 243–253.
- Hersh, R. (1999). What is mathematics, really? New York, NY: Oxford University Press.
- Herzig, A. H. (2004). ‘Slaughtering this beautiful math’: Graduate women choosing and leaving mathematics. Gender and Education, 16(3), 379–395.
- International Q. (1999). NVivo Qualitative Data Analysis Software.
- Jugović, I., Baranović, B., & Marušić, I. (2012). The role of gender stereotypes and motivation in the explanation of mathematics achievement and anxiety. Suvremena Psihologija, 15(1), 65–78.
- Kanahara, S. (2006). A review of the definitions of stereotype and a proposal for a progressional model. Individual Differences Research, 4(5), 306–321.
- Kane, R., Sandretto, S., & Heath, C. (2002). Telling half the story: A critical review of research on the teaching beliefs and practices of university academics. Review of Educational Research, 72(2), 177–228.
- Kassambara, A., & Mundt, F. (2020). Factoextra: Extract and visualize the results of multivariate data analyses. https://CRAN.R-project.org/package=factoextra.
- Katz, D., & Braly, K. W. (1935). Racial prejudice and racial stereotypes. The Journal of Abnormal and Social Psychology, 30(2), 175–193.
- Krech, D., Crutchfield, R. S., & Ballachey, E. L. (1962). Individual in society: A textbook of social psychology. New York, NY: McGraw-Hill.
- Kress, G. R., & van Leeuwen, T. (1996). Reading images: The grammar of visual design. London, UK; New York, NY: Psychology Press.
- Lippmann, W. (1922). Public opinion. New York, NY: Macmillan.
- Maechler, M., Rousseeuw, P., Struyf, A., Hubert, M., & Hornik, K. (2019). Cluster: Cluster analysis basics and extensions.
- Mead, M., & Metraux, R. (1957). Image of the scientist among high-school students. Science, 126(3270), 384–390.
- Philipp, R. A. (2007). Mathematics teachers’ beliefs and affect. In F. K. Lester, Jr. (Ed.), Second handbook of research on mathematics teaching and learning (pp. 257–315). Charlotte, NC: NCTM.
- Picker, S. H., & Berry, J. S. (2000). Investigating pupils’ images of mathematicians. Educational Studies in Mathematics, 43(1), 65–94.
- Sam, L. C., & Ernest, P. (2000). A survey of public images of mathematics. Research in Mathematics Education, 2(1), 193–206.
- Schoenfeld, A. H. (2011). A practical and theoretical agenda for progress in mathematics education. International Mathematical Union (online paper).
- Sfard, A., & Prusak, A. (2005). Identity that makes a difference: Substantial learning as closing the gap between actual and designated identities. In H. L. Chick, & J. L. Vincent (Eds.), Proceedings of the 29th conference of the international group for the psychology of mathematics education (Vol. 1, pp. 37–52). Melbourne: International Group for the Psychology of Mathematics Education. https://www.emis.de/proceedings/PME29/PME29Plenaries/PME29SfardPrusakPlenary.pdf
- Spencer, S. J., Steele, C. M., & Quinn, D. M. (1999). Stereotype threat and women’s math performance. Journal of Experimental Social Psychology, 35(1), 4–28.
- Steinke, J., Applegate, B., Penny, J. R., & Merlino, S. (2022). Effects of diverse STEM role model videos in promoting adolescents’ identification. International Journal of Science and Mathematics Education, 20, 255–276.
- Sumpter, L. (2016). ‘Boys press all the buttons and hope it will help’: Upper secondary school teachers’ gendered conceptions about students’ mathematical reasoning. International Journal of Science and Mathematics Education, 14(8), 1535–1552.
- Surmeli, H. (2012). Examination the effect of science fiction films on science education students’ attitudes towards STS course. Procedia - Social and Behavioral Sciences, 47, 1012–1016.
- Taasoobshirazi, G., Puckett, C., & Marchand, G. (2019). Stereotype threat and gender differences in biology. International Journal of Science and Mathematics Education, 17(7), 1267–1282.
- Team, R. C. (2020). R: A language and environment for statistical computing. https://www.R-project.org/.
- Vinacke, W. E. (1957). Stereotypes as social concepts. The Journal of Social Psychology, 46(2), 229–243.
- Walton, G. M., & Cohen, G. L. (2003). Stereotype lift. Journal of Experimental Social Psychology, 39(5), 456–467.
- Ward, J. H. (1963). Hierarchical grouping to optimize an objective function. Journal of the American Statistical Association, 58(301), 236–244.
- Wickham, H., Averick, M., Bryan, J., Chang, W., McGowan, L., François, R., … Yutani, H. (2019). Welcome to the Tidyverse. Journal of Open Source Software, 4(43), 1686.
- Williams, J., & Wake, G. (2007). Black boxes in workplace mathematics. Educational Studies in Mathematics, 64(3), 317–343.