
 ?Mathematical formulae have been encoded as MathML and are displayed in this HTML version using MathJax in order to improve their display. Uncheck the box to turn MathJax off. This feature requires Javascript. Click on a formula to zoom.
ABSTRACT
In this paper, we explore how diagram placement in mathematics textbooks influences (i) students' and teachers' perceptions of exposition quality and (ii) students' reading behaviour as indexed by their eye movements. Our findings contribute to research on the spatial contiguity principle, which recommends that related educational pictures and text should be displayed close together. In our first study, we used a comparative judgement technique to ask three groups of textbook users to compare real-world textbook expositions. Participants tended to perceive expositions as higher in quality if diagrams were placed in the main text rather than the margins. In a second study, we used eye tracking to explore whether students read expositions differently when diagrams were placed differently. Participants attended less to diagrams in the margins than to those in the main text. The findings of both studies suggest that authors should attend to the spatial contiguity principle when designing mathematics textbooks.
1. Introduction
Mathematics textbooks are important learning resources. They typically include explanations containing both text and diagrammatic representations. But how should these be arranged? In this paper, we report research on text and diagram placement in relation to the spatial contiguity principle, a design principle developed from CitationMayer's (Citation2005) cognitive theory of multimedia learning. We explore this principle in mathematics and suggest that its application could improve mathematics textbook expositions.
Previous research on mathematics textbooks has often focused on how these are used, with some authors noting an emphasis on teacher textbook use (Fan et al., Citation2013; Rezat & Straesser, Citation2014). Research investigating how students use mathematics textbooks is not extensive (Österholm & Bergqvist, Citation2013; Rezat & Straesser, Citation2014), though evidence suggests that undergraduate students only infrequently use textbook expositions (e.g. Weinberg et al., Citation2012) and that when they do, they do so less than proficiently (e.g. Shepherd et al., Citation2012). Some research has characterised individual reading strategies, aiming to identify which are effective (e.g. Berger, Citation2019; Shepherd & van de Sande, Citation2014). Some has characterised mathematical text itself, aiming to discern whether the use of symbols affects students' reading comprehension (e.g. Österholm, Citation2006).
Regarding mathematical text, it is widely believed that reading mathematics is challenging (Österholm, Citation2008). This is commonly understood to be due to the multiple representations in mathematical text (Aaron, Citation1965; Doerr & Temple, Citation2016) and the fact that integrating text, symbols and diagrams requires multi-directional reading strategies (Barton & Heidema, Citation2002). Empirical research has shown that people do attend differently to different mathematical representations: Andrá et al. (Citation2009) found that novices and experts had different strategies when integrating text and graphs, and Andrá et al. (Citation2015) found that reading behaviours differed for individuals learning from text with graphs and from text with formulae. This aligns with CitationÖsterholm's (Citation2006) research, which found that students had similar levels of comprehension when reading a non-symbolic mathematical text and a historical text, but significantly poorer levels when reading a mathematical text with symbols.
Typically, mathematics-specific challenges inspire recommendations for mathematical reading instruction: Österholm (Citation2008) suggested that teaching students how to read characteristics of mathematical text would help them to avoid developing undesirable reading strategies, and Hodds et al. (Citation2014) demonstrated that self-explanation training could change undergraduates' reading behaviours and improve their proof comprehension. However, explicit reading instruction might not be the only way forward. In the wider literature, CitationMayer's (Citation2005) cognitive theory of multimedia learning has motivated research showing that the design of instructional materials can influence learning outcomes. For instance, outcomes can improve when corresponding text and visualisations are presented together, in line with the spatial contiguity principle. The majority of research on this principle has used science or engineering materials, which also contain multiple representations. So it seems reasonable to suggest that the principle extends to mathematics. But, in mathematics education, there has been little investigation into how representations are displayed and whether different displays might differentially affect engagement and learning.
Accordingly, we asked: does the spatial contiguity principle extend to real-world mathematics textbook expositions? We investigated this question in two ways. In our first study, we investigated whether diagram placement affected mathematics textbook-users' perceptions of exposition quality. We used comparative judgement, asking multiple participants to compare multiple pairs of expositions to judge which is better, and using the judgements collectively to determine a score for each exposition. In our second study, we investigated whether perceptions of exposition quality were reflected in reading behaviours. We used eye-tracking, recording eye movements during exposition reading and comparing the time participants spent inspecting diagrams when these were placed in the text and in the margins.
2. Theoretical and methodological background
2.1. The spatial contiguity principle
The spatial contiguity principle recommends that related text and visualisations should be presented as closely together as is practical. It is a special case of the split-attention effect (Mayer, Citation2020), which says that learning is negatively affected when learners must split their attention across multiple locations (Ayres & Sweller, Citation2005; Sweller et al., Citation1998). Splitting attention increases extraneous cognitive load and can be especially detrimental if the intrinsic load for a task is high (Paas & van Gog, Citation2006): load is summative so increased extraneous load might mean that a learner cannot process all of the presented information (Mayer et al., Citation2019). Integrated designs can help to reduce extraneous cognitive load because learners require fewer cognitive resources to search the page as they keep information in mind (Sweller et al., Citation1998).
Originally, the spatial contiguity principle evolved from CitationTarmizi & Sweller's (Citation1988) investigations into mathematics worked examples: they found that giving diagrams alongside solution steps (rather than just beside the question) improved outcomes in a post-test. Since then, the majority of research on the spatial contiguity principle has investigated science and engineering materials. Moreover, it has often used contrived materials or materials modified from their original real-world versions; typically, one group of students receives a split design and the other an integrated design (e.g. Chandler & Sweller, Citation1991; Johnson & Mayer, Citation2012; Makransky et al., Citation2019; Mayer, Citation1989; Moreno & Mayer, Citation1999; Tindall-Ford et al., Citation1997). The results usually support the principle, but they do not use authentic materials or take into account the constraints under which textbook designers work. We therefore decided to investigate the spatial contiguity principle using unmodified real-world mathematics textbook expositions.
2.2. Comparative judgement
For our first study, we wanted to investigate whether diagram placement affected perceptions of exposition quality. To measure these perceptions, we used comparative judgement, which provides a score for each of a set of objects using paired comparisons. Multiple judges are asked to compare two objects and decide which is better in relation to some abstract quality; they repeat these judgements with varying objects until scores can be calculated. This process evolved from CitationThurstone's (Citation1927) law of comparative judgement, which states that humans are better at comparing two objects than at evaluating one in isolation: it is easier to decide which of two objects is heavier than to state a numerical weight for either.
Comparative judgement is now straightforward to implement: objects can be uploaded to an online tool that assigns paired comparisons to multiple judges. In education, the objects are often pieces of student writing, and judges are experts in the field (e.g. McMahon & Jones, Citation2015) or, in some cases, students (e.g. Verhavert et al., Citation2018). The online tool collates the judgements, and the Bradley–Terry model (Bradley & Terry, Citation1952) is used to calculate a score for each object i in the form of a parameter estimate . The parameter estimates are initially set by counting the number of wins for each object. The model then improves the estimates using iterations of a formula involving the probability that the object is chosen over another (
), the outcome of each actual decision (a binary measure) and the weight provided by the decision (using the previously estimated probability) (Bramley & Vitello, Citation2019; Pollitt, Citation2012).
This method has been used to study educational constructs that resist rubric-based assessment, including the quality of essays (Heldsinger & Humphry, Citation2013) and laboratory reports (McMahon & Jones, Citation2015). In mathematics education, it has been used to assess conceptual understanding in calculus, statistics and algebra (Bisson et al., Citation2016), as well as mathematical problem-solving skills (Jones & Inglis, Citation2015). More recently, it has been used to investigate how mathematicians perceive the explanatoriness of proofs (Mejía Ramos et al., Citation2021), to assess students' proof summaries (Davies et al., Citation2020), and to compare mathematicians' and undergraduates' beliefs about proof (Davies et al., Citation2021).
Our study is similar to many of these in that we wanted to measure a construct—exposition quality—that is not readily captured via simple criteria. However, in most previous studies, each of the compared objects was a response to a single prompt, such as ‘explain the meaning of this concept’ or ‘summarise this proof’. This could be important because one assumption of comparative judgement is that the construct can meaningfully be measured on a single scale (i.e. is unidimensional). Our study prioritised authentic materials and, to ensure that judgements about these were minimally influenced by design and style, we drew these from a single textbook. Naturally, this meant that the expositions covered different topics, so there was potential for factors such as topic preference or difficulty to influence judges' decisions. Consequently, we later discuss reliability measures alongside the comparative judgement outcomes.
2.3. Eye-tracking
For our second study, we wanted to investigate whether textbook-users' perceptions aligned with observable reading behaviour. To investigate this behaviour, we used eye-tracking technology, which records eye movements as participants read from a screen. Analyses rely on the fact that, when processing static images, eye movements form a series of fixations on specific targets, interspersed with rapid saccades from one fixation to another (Rayner, Citation2009; Willingham, Citation2017). Readers fixate on roughly 70% of words in ordinary text and ‘skip’ the rest (Schotter et al., Citation2012), processing those in their peripheral vision (Conklin et al., Citation2018).
Eye-tracking is a common tool in reading research (Strohmaier et al., Citation2020) because it facilitates inferences about underlying cognitive processes (Schroeder & Cenkci, Citation2020). A key assumption is the eye-mind hypothesis (Strohmaier et al., Citation2020), which states that there is a relationship between where an individual focuses and their cognitive processing (Just & Carpenter, Citation1980). On this basis, researchers often set up areas of interest (AOIs) in their stimuli, which are invisible to participants but can be used to analyse the order in which stimuli are inspected (e.g. Dolezalova & Popelka, Citation2016; Ögren et al., Citation2017), to compare total dwell times in different AOIs by summing relevant fixation durations (e.g. Andrá et al., Citation2015), or to infer processing effort, where longer mean fixation durations indicate more effortful processing (e.g. Panse et al., Citation2017). Some inferences to cognitive processing should not be taken for granted and some authors have recently expressed validity concerns (Schindler & Lilienthal, Citation2019; Strohmaier et al., Citation2020). However, the link between eye movements and attention is empirically very well established (Rayner, Citation1998) and concerns can often be resolved by triangulating using other methods (Strohmaier et al., Citation2020). In this paper, we adopt cross-study triangulation, investigating the spatial contiguity principle using both comparative judgement and eye-tracking.
Eye-movement analyses have risen in general popularity recently (Carter & Luke, Citation2020) as hardware and software have become more accessible. This trend is reflected in mathematics education (Strohmaier et al., Citation2020), where researchers have used eye-tracking to study reading behaviours when comparing fraction magnitudes (Atagi et al., Citation2016), validating proofs (e.g. Inglis & Alcock, Citation2012), and reading different mathematical representations (Andrá et al., Citation2015). Most relevant to our study, Ögren et al. (Citation2017) used AOIs to compare dwell times for diagrams and text in mathematics textbooks and to discern whether the presence of diagrams affected students' problem comprehension. So far, however, only a small proportion of eye-tracking research in mathematics education has been concerned with reading (Strohmaier et al., Citation2020), so there is potential for its use to address the lack of empirical research on how people read mathematical expositions (Fan et al., Citation2013; Österholm & Bergqvist, Citation2013).
Certainly, eye-tracking can give insights into multimedia learning: researchers have used it to investigate split-attention effects and have found design-relevant outcomes (e.g. Jarodzka et al., Citation2017, Citation2015; Johnson & Mayer, Citation2012). Holsanova et al. (Citation2009), for instance, compared two groups of adults' eye movements as they read a text-and-picture newspaper extract: one group saw an integrated version and the other saw the text first with all pictures grouped together at the bottom. Readers of the integrated version made significantly more transitions between text and pictures; readers of the separated version appeared to consider the two types of information self-contained and not both necessary, reading the headline and then only the text or only the pictures, with minimal transitions between the two. Saß et al. (Citation2017) tracked students' eye movements as they read science texts including an explanation, a diagram and a question. The texts were in either a non-integrated format (diagrams displayed above the explanation and question), or an integrated format (diagram sandwiched between the explanation above and the question below). Saß et al. (Citation2017) found that diagrams were fixated upon significantly less in the non-integrated format.
Our study differs from these in using unmodified textbook expositions, but is similar in that we use AOIs to examine the effects of diagram placement on reading behaviour. In describing our approach, we are guided by recent observations that although eye-tracking technology has grown more popular and accessible, reporting guidelines have not been standardised, with the result that the quality of eye-tracking data is often not reported (Carter & Luke, Citation2020; Holmqvist et al., Citation2022). Holmqvist et al. (Citation2022) proposed a set of flexible guidelines to support researchers in transparent reporting, and we give validity and reliability measures in accordance with these when we explain our eye-movement measures and analyses.
3. Comparative judgement study
Our first study asked whether real-world mathematics textbook expositions would be perceived as higher in quality if their design was consistent with the spatial contiguity principle.
3.1. Comparative judgement method
3.1.1. Materials
We selected 16 expositions from a first-year A Level mathematicsFootnote1 textbook (Jefferson et al., Citation2017), using only one textbook to minimise variations in design and style. The expositions were all at a similar level and none relied directly upon knowledge from elsewhere in the book. shows the chosen topics, but our materials omitted topic headings to minimise participants' inclination to rank expositions by topic preference or difficulty.
Table 1. Exposition topics ordered by unit within chapters.
We classified all visualisations, including graphs, as diagrams. Some expositions had diagrams in the main text (as in ), some had diagrams in the margin (), some had both, and some had no diagrams. For the analysis reported here, we excluded the last set and categorised the remaining expositions as having at least one diagram in the margin (n = 6) or all diagrams in the main text (n = 3).
Figure 1. An exposition with a diagram in the main text (Jefferson et al., Citation2017, p. 106).
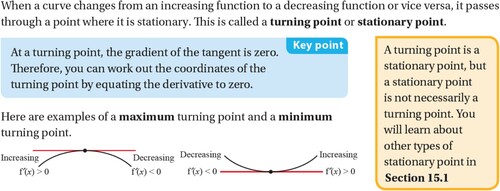
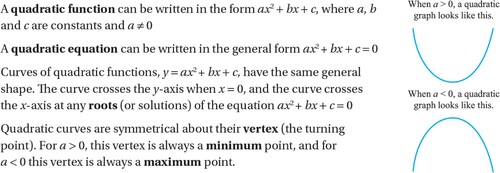
Figure 2. An exposition with diagrams in the margin (Jefferson et al., Citation2017, p. 16).
3.1.2. Participants
We recruited three groups of textbook-users: A Level mathematics students, A Level mathematics teachers, and mathematics undergraduates (henceforth referred to as students, teachers and undergraduates respectively). The students had all completed the first-year A level syllabus, so all groups had some prior knowledge of the exposition topics. We recruited teachers using existing networks and social media. We recruited students via their teachers, contacting former colleagues and every eligible school in Leicestershire, Derbyshire and Nottinghamshire on the UK Government database. We recruited undergraduates via their lecturers, using existing networks to email academics at various UK universities.
We gave all groups an online link which provided information and instructions and required informed consent before they could access the task. Participants accessed the task on the No More Marking site (www.nomoremarking.com), an online comparative judgement engine. Teachers and undergraduates were given the opportunity to take part in a draw to win one of 17 £10 Amazon vouchers on completion. Due to school policies, students were not invited to take part in the draw.
3.1.3. Procedure
Participants were included in the analysis if they made 15 successful paired comparisons; this prevented the task from becoming too laborious and sufficed to check each group of judges' reliability. In each paired comparison, two expositions were displayed onscreen beneath the instruction ‘Choose the better explanation’. Participants chose by clicking on a button above their selected explanation. We used the term ‘explanation’ because this was more familiar vocabulary for the students than ‘exposition’.
Based on a pilot study, we estimated that we should aim for 900 judgements in total for our 16 expositions. This dramatically exceeds CitationVerhavert's (Citation2018) recommended 17 judgements per object to achieve a reliable measure. However, we deemed it appropriate because we were not certain that our judges would share conceptions of quality in relation to our multi-topic real-world expositions, so it was prudent to collect more judgements than would be needed in cases where there is a stronger a priori expectation that judges would agree (e.g. Bisson et al., Citation2016; Mejía Ramos et al., Citation2021). We met the target with varying numbers of judges between groups because students were recruited during the pandemicFootnote2 and our undergraduate database was much larger than the others (see ). In Section 3.2, we discuss the impact of the number of judgements per exposition, and also how we accommodated the different sample sizes.
Table 2. Number of judges and judgements per group.
3.2. Comparative judgement analysis and results
3.2.1. Initial data processing
Participants' paired comparative judgements were analysed in R (R Core Team, Citation2020) using the Bradley-Terry model (Firth, Citation2005). Here, each final parameter estimate represents the perceived quality of an exposition, and this process produces a scaled rank order in which each exposition has a score. Once the scores were calculated, we checked reliability to confirm that comparative judgement was an appropriate tool for our stimuli, then explored whether diagram placement affected textbook-users' perceptions of exposition quality.
3.2.2. Reliability
We used two measures of reliability. The first is Scale Separation Reliability (SSR), which measures the internal reliability of the scaled rank order (Jones et al., Citation2016; Pollitt, Citation2012). SSR is considered to be a measure of the agreement between judgements: the higher the SSR, the more consistent judgements were across judges and the higher the likelihood that the construct can meaningfully be treated as unidimensional.
Normally, an SSR would be interpreted by comparing it with SSRs from similar projects (see Pollitt, Citation2012), but our multi-topic materials and high number of judgements made this challenging. One possible comparator is Holmes et al. (Citation2017), who used comparative judgement to assess questions' likelihoods of eliciting mathematical problem-solving; they reported an SSR of .83. Another is Jones et al. (Citation2016), who used comparative judgement to assess mathematical quality in candidates' responses to A level questions from the 1960s, 1990s and 2010s; they reported an SSR of .80. These studies are not directly comparable because they used fewer judgements (analogously, it would be difficult to compare the internal reliability of a test with many items with the internal reliability of a test with few items). We explore this further in the discussion, and here note that in a more generic interpretation, an SSR of .70 can be considered ‘reasonably high’ (Bramley & Vitello, Citation2019, p. 45).
shows the SSR coefficients for each group in our study, along with the number of judgements for each group. The SSR coefficients were greater than .70 for all groups and, with cautious interpretation due to the point above, were broadly comparable to the values found by Holmes et al. (Citation2017) and Jones et al. (Citation2016).
Table 3. Reliability measures for each group.
The second measure of reliability is Inter-Rater Reliability (IRR), which indicates how likely a ranking of objects would be if another set of judges were taken from the same population (Jones & Wheadon, Citation2015). IRR is calculated by splitting the judges into two groups to produce two sets of scores, then calculating a Pearson correlation between these sets of scores (Verhavert et al., Citation2018). This is repeated for a number of iterations (we chose 1000) and the IRR is the average of the correlations. reports two IRR measures for each of our groups. The standard mean IRR was relatively high for the students and the undergraduates, showing that the judges in these groups tended to agree with one another; the teachers' mean IRR was noticeably lower. The second, adjusted mean IRR was calculated to take account of the groups' different sample sizes. Without adjustment, the correlations used to calculate the IRR were based on differently sized groups. For the adjusted IRR, we randomly selected two groups of 30 judges for each iteration, for all groups (30 being the maximum size possible for the smallest group, the 60 A Level students). This lowered the IRR for the teachers and the undergraduates, see .
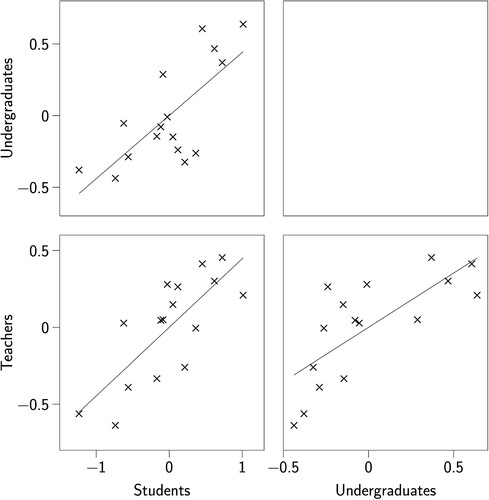
Both standard and adjusted IRR measures suggest that there was less agreement amongst the undergraduates and especially amongst the teachers than there was amongst the students; we consider possible reasons for this in the discussion for this study and the overall paper. For our purpose here, we propose that the SSR measures are high enough to show an overall tendency for judges to agree with one another within groups, meaning that comparative judgement scores for exposition quality can be considered meaningful despite the expositions covering different topics. Moreover, there was broad agreement across groups. There were significant positive correlations between the scores generated by the students and the undergraduates, , the students and the teachers
, and the undergraduates and the teachers
; see .
Figure 3. Correlations between exposition scores generated via comparative judgement by students, teachers and undergraduates.
3.2.3. Diagram placement
To address the question of whether diagram placement affected textbook-users' perceptions of exposition quality, we compared the comparative judgement scores for expositions that had diagrams in the main text with those that had diagrams in the margins. We performed a (group × diagram placement) Analysis of Variance (ANOVA), and found a significant main effect of diagram placement,
, p = .034,
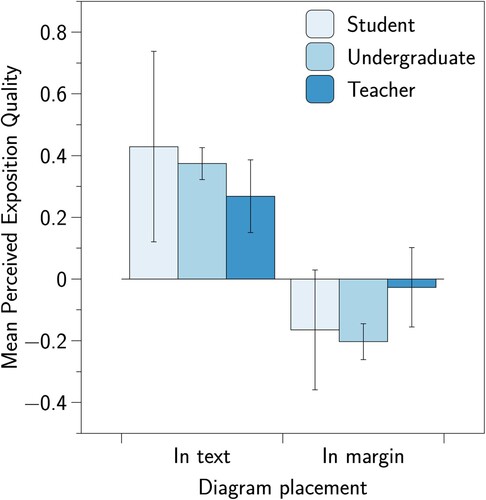
: expositions with diagrams in the text were judged to be better than those with diagrams in the margins, as shown in . There was no significant interaction,
, p = .452,
, suggesting that the effect was not dissimilar for the three groups. This result aligns with the spatial contiguity principle: expositions with diagrams in the text were perceived as better than those with diagrams in the margin.
Figure 4. Mean perceived exposition quality scores for expositions with diagrams in the text and in the margins.
3.3. Comparative judgement discussion
In this first study, we used comparative judgement to examine textbook-users' perceptions of exposition quality. We found that, within groups, the students, teachers and undergraduates all had broadly consistent perceptions of which expositions were better. There is reason for some caution in this interpretation, however, because our reliability measures were based on high numbers of judgements, and because the effect was not uniform: there was less agreement amongst the undergraduates and especially amongst the teachers.
Regarding judgement numbers, two competing methodological considerations are relevant. First, collecting high numbers of judgements was prudent due to the multi-topic nature of our materials and the corresponding uncertainty that our judges would agree; increasing the number of judgements increases SSR (although only to the extent that there is underlying consistency within the judgements). Second, to avoid the task becoming too laborious, we collected data from a large number of judges for each group; increasing the number of judges would increase diversity therefore likely decrease reliability measures (Verhavert et al., Citation2019). This might have affected reliability for undergraduate and teacher data especially.
Regarding agreement, a theoretical consideration is relevant. The lower agreement amongst undergraduates and teachers raises questions about the way in which experience interacts with judgements of exposition quality: these groups have probably seen more explanations of these topics, and teachers in particular are likely to have fine-tuned their own, and therefore developed more fixed preferences. Overt reasons for differences in reliability for teachers and undergraduates are not accessible from our data, but we believe that these merit further investigation.
Our data do, however, show agreement not just within but across the three groups: the exposition scores produced by the students, teachers and undergraduates were all significantly positively correlated. Our results thus indicate that comparative judgement has potential as a method for meaningfully comparing exposition quality, even when expositions explain different topics, and especially for the target audience of A level students. This will interest researchers, teachers and textbook designers who want to produce and use good quality expositions, because it indicates that we might be able to identify characteristics of good explanations and implement these as standard.
One possible such characteristic is that investigated here: diagram placement. The spatial contiguity principle suggests that diagrams should be integrated into the relevant text, and our findings support this: textbook-users tended to prefer expositions with diagrams in the main text rather than in the margins. This provides evidence that the spatial contiguity principle is relevant in mathematics as well as the more extensively studied subjects of science and engineering (Mayer, Citation2020). Indeed, the fact that it shows up in quality judgements could mean that readers are at least implicitly aware of the extra effort required to integrate information that is more spread out.
That said, factors other than diagram placement could have affected these judgements—perhaps the expositions with diagrams in the margin were in some other way more difficult to process. And showing that people prefer expositions consistent with the spatial contiguity principle is not the same as showing that they interact differently with these expositions or learn more from them. For that, we need different approaches, one of which we applied in our second study.
4. Eye-tracking study
Our second study aimed to determine whether the spatial contiguity principle was associated with observable differences in reading behaviour. Specifically, we explored whether expositions with diagrams in the margins were read differently from those with diagrams in the main text.
4.1. Eye-tracking method
4.1.1. Materials
Stimuli were the same 16 expositions as in the comparative judgement study—see Section 3.1.1. Again we used only the expositions with diagrams in the analyses reported here. All expositions had the same dimensions except for four slightly longer expositions which were shrunk slightly in order to fit on a single screen.
4.1.2. Participants
We recruited A Level students because they are the predominant textbook users and because they gave the most reliable data in the comparative judgement study. Students were in their second year of A Level so all had similar prior exposure to the topics. We recruited students via their mathematics teachers, who we contacted using our existing database. We set a minimum sample size of 30, which was flexible so that we could recruit all students at a school even if that surpassed the threshold. Altogether, we recruited 34 students from five different schools; 19 were 17 years old, the remaining 15 were 18. All students (or their parent/guardian if under 18) gave informed consent.
4.1.3. Procedure
We collected data using a Tobii Pro x2-60 remote eye-tracker with sampling rate 60Hz and with Tobii Studio software version 3.4.8. This eye-tracker is a small, oblong device that fits onto the bottom of a laptop screen without obscuring the visual display. The set-up was portable so we could test students at their schools. Students were tested individually in a quiet room and sat 60cm from the screen. We were not able to control lighting conditions across schools, but all participants were tested as far away from natural light as possible.
Before the study began, each participant was able to re-read an information sheet and ask questions. The experimenter then calibrated the eye-tracker using a five-point display, which is the default calibration for the Tobii 3.4.8 software and in line with many previous studies (e.g. Catrysse et al., Citation2018; Holmberg et al., Citation2016; Strukelj et al., Citation2016). If needed, the calibration was repeated. We did not use head stabilisation or re-calibrate during the study because of its short duration and because we were aiming for authenticity. Moreover, the cost-benefit of such precautions remains unclear (Holmqvist et al., Citation2022), especially when considering that our analyses used relatively large areas of interest rather than word-level eye movements.
After calibration, we left the participant alone to complete the task at their own pace. Instructions were given onscreen. The task comprised 16 expositions to be read, each followed by a multiple-choice comprehension question to encourage meaningful reading (not for analysis). Students took between 8:11 and 29:07 minutes to complete the task, averaging 17:38 minutes.
4.2. Eye-tracking analysis and results
4.2.1. Accuracy and initial data processing
We first excluded eye-tracking data that were not sufficiently accurate using weighted gaze samples. According to Just and Carpenter (Citation1976), data below 50% gaze accuracy should be excluded.Footnote3 We excluded one participant with gaze accuracy of 36%; the remaining participants achieved at least 64%, averaging 84% gaze accuracy. Consequently, we used 33 students' data in the analysis. For these participants, we also examined an advanced accuracy score giving ‘the confidence level that the [eyes have] been correctly identified by the eye-tracker’ (Tobii Technology AB, Citation2014, p. 30): a score of 0 indicates high confidence that the eye was found and 4 indicates ‘eye not found’ (CitationTobii Pro, Citationn.d., p. 50). On 90% of all fixations, both eyes were found with high confidence (score (0,0)); the mean proportion of fixations classified as high confidence across participants was 88%.
For the substantive question in this study, we were interested in whether expositions with diagrams in the margin were read differently from those with diagrams in the main text. We therefore made each diagram an Area of Interest (AOI), enabling us to extract the relevant fixation data.
4.2.2. Diagram placement
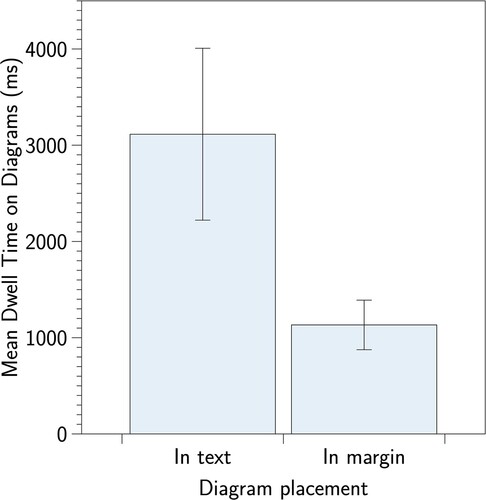
For each diagram, we calculated (i) each participant's dwell time and the mean dwell time across all participants, and (ii) each participant's mean fixation duration and the mean of these mean fixation durations across all participants. We used t-tests to determine whether either of the means across participants differed significantly for diagrams placed in the text versus diagrams placed in the margin. We found that mean dwell time was significantly higher for diagrams placed in the text (,
) than for diagrams placed in the margin (
,
),
, p = .024, d = 1.692,Footnote4 see . The effect size was large: diagrams in the text attracted nearly three times as much attention as those in the margin. Moreover, we found no significant difference between the means of the mean fixation durations for the diagrams placed in the margin (
,
) and those placed in the text (
,
),
, p = .152, d = 0.98. This means that there was no physiological evidence of a difference in processing difficulty—diagram placement seemed to be the key factor.
Figure 5. The mean dwell time spent on diagrams in the text and in the margin; error bars show standard error of the mean.
4.3. Eye-tracking discussion
In this second study, we investigated whether a difference in diagram placement affected not just perceptions of exposition quality but actual reading behaviour. We found that it did: students gave significantly more attention—measured by dwell time—to diagrams placed in the text than to those in the margin. Because we also found that diagram placement had no significant effect on mean fixation durations, we believe that this increased attention was due to diagram placement rather than to some other factor such as processing difficulty.
These findings accord with those of our first study in supporting the spatial contiguity principle in mathematics. Indeed, they contribute evidence on mechanisms behind the effect. In discussing our comparative judgement study, we raised the possibility that participants might have been somewhat aware of the extra effort required to integrate information that is more spread out. From these eye-tracking data, it seems that they might be disinclined to make this effort—that the expositions with diagrams in the margins were experienced as poorer at least partly because people engaged with them less fully. Perhaps one reason for spatial contiguity effects reported in the wider literature is that integrated presentations encourage learners to use all of the available representations, rather than neglecting those that spatial arrangement suggests are less central.
Certainly our results exemplify how eye-tracking can be used to give insights into the effects of multimedia design, as proposed by Jarodzka et al. (Citation2017). And these findings are obviously important and directly applicable for designers of textbooks and other learning resources. It seems that placing diagrams in the margin, away from corresponding text, may considerably reduce the attention that they are given. A relatively low-cost rearrangement of items on a page might affect the chances that students benefit from each diagram's explanatory power.
5. General discussion
In this paper, we used mathematics textbook expositions to investigate the real-world impact of the spatial contiguity principle. We used two approaches, exploring the impact of diagram placement on textbook-users' perceptions of exposition quality and on their physiological reading behaviour. The results of both studies suggest that the spatial contiguity principle holds in mathematics. Our comparative judgement study found that placing diagrams in the margin negatively influenced perceived exposition quality. Our eye-tracking study showed that diagrams placed in the margin received significantly less attention than those placed in the main text, with a large effect size. These findings are the first to suggest that the well-evidenced spatial contiguity effect holds for mathematical expositions.
Our studies also make other methodological and theoretical contributions, both in their own rights and together. Our comparative judgement study showed that students in particular had broadly similar perceptions regarding what makes a good exposition; agreement amongst undergraduates and teachers was also detectable, although lower. Across the three groups, we found significant positive correlations in comparative judgement scores, indicating that these three groups appeared broadly to agree about exposition quality. In terms of methodology, this indicates that perceived exposition quality could reasonably be treated as a unidimensional construct, perhaps with more caution for groups with higher levels of expertise. In terms of theory, it suggests that exposition quality is not simply subjective: a measurable level of underlying agreement opens up the possibility that we might identify characteristics shared by good expositions. Diagram placement is one such characteristic, and further investigations might uncover others.
Our eye-tracking study showed via dwell times that A level students allocated nearly three times as much attention to diagrams in the text as to those in the margins; mean fixation durations showed no such difference in cognitive effort. In terms of methodology, this satisfies CitationJarodzka et al.'s (Citation2017) recommendation that we use varied methods to understand results in multimedia instruction. In terms of theory, it provides insight into the physiological processes behind the spatial contiguity effect. It appears that individuals find it no harder to inspect diagrams in margins, but are less inclined to use them—that they at least subconsciously make choices about where to invest their effort and that these choices can be influenced by layout. If this observation stands up to more direct testing, then it provides a simple way to improve educational materials.
Together, our studies provide a coherent picture of learning from mathematical text: people are somewhat consistent in judging exposition quality, this consistency is systematically related to the spatial contiguity effect, and one mechanism for this appears to be a relative disinclination to inspect suboptimally placed diagrams. Indeed, our two methods provide complementary evidence. Comparative judgement might be seen as partly akin to self-report in that participants give their opinions. If so viewed, then it is stronger than simple interview or rating studies, because it relies on collective rather than individual judging, because judges make relative rather than absolute judgements, and because they are able to make these judgements holistically rather than according to pre-specified characteristics or weightings. Nevertheless, comparative judgement provides no insight into whether expositions perceived as better actually have different effects on learning. Eye-tracking provides exactly such an insight. It relies on physiological measures which are not under participants' conscious control: readers are unaware of researcher-implemented AOIs and they certainly do not choose their fixation durations. Eye-tracking is thus less vulnerable to validity problems based on conscious or unconscious participant adjustment to research conditions, so the consistency of our findings lend credence to the claim that participants' opinions are meaningful. In the other direction, comparative judgement provides cross-study triangulation, in accordance with recommendations for eye-tracking studies to be interpreted with evidence from other sources if they rely on the eye-mind hypothesis (e.g. Jarodzka et al., Citation2017; Schindler & Lilienthal, Citation2019; Strohmaier et al., Citation2020). By using both methods, we strengthen our evidence on the spatial contiguity principle, finding support for this principle through students' perceptions as well as their largely unconscious reading strategies.
Of course, our studies have limitations. One is that comparative judgement and eye-tracking both have a black-box characteristic: we learn about perceived exposition quality and about differences in eye movements, but we do not learn directly about the causes of these. We can infer causes, and we do that here in relation to the spatial contiguity principle. But researchers interested in learner experience and in reasons for their choices will no doubt find our approaches lacking. We tend to be of the opposite view: we see learner experience as pragmatically important in that people will be less inclined to study materials that, for whatever reason, they do not find appealing. But we are aware that what learners think is good for them should not necessarily be taken at face value. What learners like might be detrimental to learning, and what they dislike might be beneficial (e.g. Clark, Citation1982; Kirk-Johnson et al., Citation2019).
A second limitation concerns the relatively small number of expositions included in the study. Specifically, in both studies we studied participants' reactions to only 16 expositions. Further research with a greater number and larger variety of expositions, and perhaps additional physiological measures in addition to eye movements, might help to validate the theoretical claims based on these studies.
A third and more obvious limitation is that our studies did not address learning directly: unlike other research on the spatial contiguity effect (e.g. Johnson & Mayer, Citation2012; Makransky et al., Citation2019; Mayer, Citation1989; Mayer et al., Citation1995; Moreno & Mayer, Citation1999), we had no test of learning outcomes. In part this is a natural consequence of our choice to use real-world materials and to minimise differences in style and layout by selecting all expositions from the same textbook. This meant that we used expositions on different topics, and it is difficult or impossible to design tests to conclude, say, that a student has a ‘better’ understanding of stationary points than of quadratic functions. Happily, the coherence of our results points to obvious manipulations for future experimental studies: expositions could be modified to produce systematic diagram-in-text and diagram-in-margin versions for multiple topics, with learning outcomes then tested. Including eye-movement analyses too would confirm or disconfirm that any differences found were consistent with learners giving more or less attention to diagrams with different placements.
In the meantime, our present findings contribute to the limited literature on student textbook use and reading behaviour, and especially on the specific challenges of integrating information from multiple representations in mathematics texts. It seems that textbook-users prefer expositions where related representations are closer together, perhaps indicating awareness of the importance of such integration. They can be put off by suboptimal placement of features such as diagrams, indicating that they are disinclined or unable to integrate information if the design is unhelpful. It thus seems that learners can be straightforwardly assisted: we can encourage students to use a representation by ensuring its appropriate display. This means that reading instruction might not be the only way to alleviate the challenges of mathematical reading. If the effects shown here stand up to experimental testing, then the spatial contiguity principle offers a low-cost strategy for teachers and textbook publishers to improve their mathematical texts.
Acknowledgments
We thank Dr Ian Jones for his support with the comparative judgement study, and the STEM team at OUP, especially Felicity Acton. Both studies received full ethical approval from Loughborough University's Ethics Approvals (Human Participants) Sub-Committee. Located in the Research Office, Hazlerigg Building, Loughborough University, Epinal Way, Loughborough, Leicestershire, LE11 3TU. Tel: 01509 222423. Email: [email protected]. Comparative judgement study approval number: HSPC Ref No.: C19-10 Eye-tracking study approval number: HSPC Ref No.: R19-P192. All data files that were used for the analysis in both studies can be found at https://figshare.com/s/59e3a7a57251ccd101dc.
Disclosure statement
No potential conflict of interest was reported by the author(s).
Additional information
Funding
Notes
1 A Levels are 2-year post-compulsory mathematics qualifications taken by 16–18 year olds in England, Wales and Northern Ireland.
2 In spring 2020, the Covid-19 pandemic caused a national lockdown in the UK. Schools were closed and students were expected to work remotely, so schools and students were harder than usual to recruit.
3 Some data loss is expected: usually 5–10% of data is missed due to blinking (CitationTobii Pro, Citationn.d., p. 7), and excessive head movements or heavy eye make-up can all affect gaze accuracy (Holmqvist et al., Citation2022; Rahal & Fiedler, Citation2019).
4 We found a significant effect when testing for violations of normality and equality of variances for dwell time, so conducted a Mann–Whitney to verify the result. The result held: .
References
- Aaron, I. E. (1965). Reading in mathematics. Journal of Reading, 8(6), 391–395. http://www.jstor.org/stable/40017213
- Andrá, C., Arzarello, F., Ferrara, F., Holmqvist, K., Lindström, P., Robutti, O., & Sabena, C. (2009). How students read mathematical representations: An eye tracking study. Proceedings of the 33rd Conference of the International Group for the Psychology of Mathematics Education, 1, 49–56. https://doi.org/10.1007/s10763-013-9484-y
- Andrá, C., Lindström, P., Arzarello, F., Holmqvist, K., Robutti, O., & Sabena, C. (2015). Reading mathematics representations: An eye- tracking study. International Journal of Science and Mathematics Education, 13(Suppl. 2), 237–259. https://doi.org/10.1007/s10763-013-9484-y
- Atagi, N., DeWolf, M., Stigler, J. W., & Johnson, S. P. (2016). The role of visual representations in college students' understanding of mathematical notation. Journal of Experimental Psychology: Applied, 22(3), 295–304. https://doi.org/10.1037/xap0000090
- Ayres, P., & Sweller, J. (2005). The split-attention principle in multimedia learning. In R. E. Mayer (Ed.), The Cambridge handbook of multimedia learning (pp. 135–146). Cambridge University Press.. doi:10.1017/CBO9781139547369.011 .
- Barton, M. L., & Heidema, C. (2002). Teaching reading in mathematics (2 ed.). Mid-continent Research for Education and Learning.
- Berger, M. (2019). Reading mathematics text: A study of two empirical readings. International Journal of Science and Mathematics Education, 17(2), 385–404. https://doi.org/10.1007/s10763-017-9867-6
- Bisson, M. J., Gilmore, C., Inglis, M., & Jones, I. (2016). Measuring conceptual understanding using comparative judgement. International Journal of Research in Undergraduate Mathematics Education, 2(2), 141–164. https://doi.org/10.1007/s40753-016-0024-3
- Bradley, R. A., & Terry, M. E. (1952). Rank analysis of incomplete block designs: I. The method of paired comparisons. Biometrika, 39(3), 324. https://doi.org/10.2307/2334029
- Bramley, T., & Vitello, S. (2019). The effect of adaptivity on the reliability coefficient in adaptive comparative judgement. Assessment in Education: Principles, Policy & Practice, 26(1), 43–58. https://doi.org/10.1080/0969594X.2017.1418734
- Carter, B. T., & Luke, S. G. (2020). Best practices in eye tracking research. International Journal of Psychophysiology, 155, 49–62. https://doi.org/10.1016/j.ijpsycho.2020.05.010
- Catrysse, L., Gijbels, D., Donche, V., De Maeyer, S., Lesterhuis, M., & P. Van den Bossche (2018). How are learning strategies reflected in the eyes? Combining results from self-reports and eye-tracking. British Journal of Educational Psychology, 88(1), 118–137. https://doi.org/10.1111/bjep.2018.88.issue-1
- Chandler, P., & Sweller, J. (1991). Cognitive load theory and the format of instruction. Cognition and Instruction, 8(4), 293–332. https://doi.org/10.1207/s1532690xci0804_2
- Clark, R. E. (1982). Antagonism between achievement and enjoyment in ATI studies. Educational Psychologist, 17(2), 92–101. https://doi.org/10.1080/00461528209529247
- Conklin, K., Pellicer-Sánchez, A., & Carrol, G. (2018). Eye-tracking: a guide for applied linguistics research. Cambridge University Press.
- Davies, B., Alcock, L., & Jones, I. (2020). Comparative judgement, proof summaries and proof comprehension. Educational Studies in Mathematics, 105(2), 181–197. https://doi.org/10.1007/s10649-020-09984-x
- Davies, B., Alcock, L., & Jones, I. (2021). What do mathematicians mean by proof? A comparative-judgement study of students' and mathematicians' views. The Journal of Mathematical Behavior, 61, 100824. https://doi.org/10.1016/j.jmathb.2020.100824
- Doerr, H. M., & Temple, C. (2016). It's a different kind of reading. Journal of Literacy Research, 48(1), 5–38. https://doi.org/10.1177/1086296X16637180
- Dolezalova, J., & Popelka, S. (2016). Scangraph: A novel scanpath comparison method using visualisation of graph cliques. Journal of Eye Movement Research, 9(4), 1–13. https://doi.org/10.16910/jemr.9.4.5
- Fan, L., Zhu, Y., & Miao, Z. (2013). Textbook research in mathematics education: Development status and directions. ZDM, 45(5), 633–646. https://doi.org/10.1007/s11858-013-0539-x
- Firth, D. (2005). Bradley–Terry models in R. Journal of Statistical Software, 12(1), 1–12. https://doi.org/10.18637/jss.v012.i01
- Heldsinger, S. A., & Humphry, S. M. (2013). Using calibrated exemplars in the teacher-assessment of writing: an empirical study. Educational Research, 55(3), 219–235. https://doi.org/10.1080/00131881.2013.825159
- Hodds, M., Alcock, L., & Inglis, M. (2014). Self-explanation training improves proof comprehension. Journal for Research in Mathematics Education, 45(1), 62–101. https://doi.org/10.5951/jresematheduc.45.1.0062
- Holmberg, N., Sandberg, H., & Holmqvist, K. (2016). Advert saliency distracts children's visual attentionduring task-oriented internet use. Frontiers in Psychology, 5, 51. https://doi.org/10.3389/fpsyg.2014.00051
- Holmes, S. D., He, Q., & Meadows, M. (2017). An investigation of construct relevant and irrelevant features of mathematics problem-solving questions using comparative judgement and Kelly's repertory grid. Research in Mathematics Education, 19(2), 112–129. https://doi.org/10.1080/14794802.2017.1334576
- Holmqvist, K., Örbom, S. L., Hooge, I. T. C., Niehorster, D. C., Alexander, R. G., Andersson, R., & Hessels, R. S. (2022). Eye tracking: Empirical foundations for a minimal reporting guideline. Behavior Research Methods. https://doi.org/10.3758/s13428-021-01762-8
- Holsanova, J., Holmberg, N., & Holmqvist, K. (2009). Reading information graphics: The role of spatial contiguity and dual attentional guidance. Applied Cognitive Psychology, 23(9), 1215–1226. https://doi.org/10.1002/acp.v23:9
- Inglis, M., & Alcock, L. (2012). Expert and novice approaches to reading mathematical proofs. Journal for Research in Mathematics Education, 43(4), 358–390. https://doi.org/10.5951/jresematheduc.43.4.0358
- Jarodzka, H., Holmqvist, K., & Gruber, H. (2017). Eye tracking in educational science: Theoretical frameworks and research agendas. Journal of Eye Movement Research, 10(1), 1–18. https://doi.org/10.16910/jemr.10.1.3
- Jarodzka, H., Janssen, N., Kirschner, P. A., & Erkens, G. (2015). Avoiding split attention in computer-based testing: Is neglecting additional information facilitative? British Journal of Educational Technology, 46(4), 803–817. https://doi.org/10.1111/bjet.12174
- Jefferson, B., Bowles, D., Mullan, E., Wiseman, G., Rayneau, J., Wood, K., & Wagner, R. (2017). AQA A level maths: year 1 + year 2 AQA A level maths: year 1 + year 2. Oxford University Press.
- Johnson, C. I., & Mayer, R. E. (2012). An eye movement analysis of the spatial contiguity effect in multimedia learning. Journal of Experimental Psychology: Applied, 18(2), 178–191. https://doi.org/10.1037/a0026923
- Jones, I., & Inglis, M. (2015). The problem of assessing problem solving: Can comparative judgement help? Educational Studies in Mathematics, 89(3), 337–355. https://doi.org/10.1007/s10649-015-9607-1
- Jones, I., & Wheadon, C. (2015). Peer assessment using comparative and absolute judgement. Studies in Educational Evaluation, 47, 93–101. https://doi.org/10.1016/j.stueduc.2015.09.004
- Jones, I., Wheadon, C., Humphries, S., & Inglis, M. (2016). Fifty years of A-level mathematics: Have standards changed? British Educational Research Journal, 42(4), 543–560. https://doi.org/10.1002/berj.3224
- Just, M. A., & Carpenter, P. A. (1976). Eye fixations and cognitive processes. Cognitive Psychology, 8(4), 441–480. https://doi.org/10.1016/0010-0285(76)90015-3
- Just, M. A., & Carpenter, P. A. (1980). A theory of reading: From eye fixations to comprehension. Psychological Review, 87(4), 329–354. https://doi.org/10.1037/0033-295X.87.4.329
- Kirk-Johnson, A., Galla, B. M., & Fraundorf, S. H. (2019). Perceiving effort as poor learning: The misinterpreted-effort hypothesis of how experienced effort and perceived learning relate to study strategy choice. Cognitive Psychology, 115, 101237. https://doi.org/10.1016/j.cogpsych.2019.101237
- Makransky, G., Terkildsen, T. S., & Mayer, R. E. (2019). Role of subjective and objective measures of cognitive processing during learning in explaining the spatial contiguity effect. Learning and Instruction, 61, 23–34. https://doi.org/10.1016/j.learninstruc.2018.12.001
- Mayer, R. E. (1989). Systematic thinking fostered by illustrations in scientific text. Journal of Educational Psychology, 81(2), 240–246. https://doi.org/10.1037/0022-0663.81.2.240
- Mayer, R. E. (2005). Cognitive theory of multimedia learning. In R. E. Mayer (Ed.), The Cambridge handbook of multimedia learning (pp. 31–48). Cambridge University Press.. doi:10.1017/9781316941355 .
- Mayer, R. E. (2020). Multimedia learning. Cambridge University Press. https://doi.org/10.1017/9781316941355
- Mayer, R. E., Steinhoff, K., Bower, G., & Mars, R. (1995). A generative theory of textbook design: Using annotated illustrations to foster meaningful learning of science text. Educational Technology Research and Development, 43(1), 31–41. https://doi.org/10.1007/BF02300480
- Mayer, R. E., Wells, A., Parong, J., & Howarth, J. T. (2019). Learner control of the pacing of an online slideshow lesson: Does segmenting help? Applied Cognitive Psychology, 33(5), 930–935. https://doi.org/10.1002/acp.v33.5
- McMahon, S., & Jones, I. (2015). A comparative judgement approach to teacher assessment. Assessment in Education: Principles, Policy & Practice, 22(3), 368–389. https://doi.org/10.1080/0969594X.2014.978839
- Mejía Ramos, J. P., Evans, T., Rittberg, C., & Inglis, M. (2021). Mathematicians' assessments of the explanatory value of proofs. Axiomathes, 31(5), 575–599. https://doi.org/10.1007/s10516-021-09545-8
- Moreno, R., & Mayer, R. E. (1999). Cognitive principles of multimedia learning: The role of modality and contiguity. Journal of Educational Psychology, 91(2), 358–368. https://doi.org/10.1037/0022-0663.91.2.358
- Ögren, M., Nyström, M., & Jarodzka, H. (2017). There's more to the multimedia effect than meets the eye: Is seeing pictures believing? Instructional Science, 45(2), 263–287. https://doi.org/10.1007/s11251-016-9397-6
- Österholm, M. (2006). Characterizing reading comprehension of mathematical texts. Educational Studies in Mathematics, 63(3), 325–346. https://doi.org/10.1007/s10649-005-9016-y
- Österholm, M. (2008). Do students need to learn how to use their mathematics textbooks? The case of reading comprehension. Nordic Studies in Mathematics, 13(3), 7–27. https://www.diva-portal.org/smash/record.jsf?dswid=-3318&pid=diva2%3A150875
- Österholm, M., & Bergqvist, E. (2013). What is so special about mathematical texts? Analyses of common claims in research literature and of properties of textbooks. ZDM, 45(5), 751–763. https://doi.org/10.1007/s11858-013-0522-6
- Paas, F., & van Gog, T. (2006). Optimising worked example instruction: Different ways to increase germane cognitive load. Learning and Instruction, 16(2), 87–91. https://doi.org/10.1016/j.learninstruc.2006.02.004
- Panse, A., Alcock, L., & Inglis, M. (2017). Reading proofs for validation and comprehension: An expert-novice eye-movement study. International Journal of Research in Undergraduate Mathematics Education, 4(3), 357–375. https://doi.org/10.1007/s40753-018-0077-6
- Pollitt, A. (2012). The method of adaptive comparative judgement. Assessment in Education: Principles, Policy & Practice, 19(3), 281–300. https://doi.org/10.1080/0969594X.2012.665354
- R Core Team (2020). R: A language and environment for statistical computing. R Foundation for Statistical Computing.
- Rahal, R. M., & Fiedler, S. (2019). Understanding cognitive and affective mechanisms in social psychology through eye-tracking. Journal of Experimental Social Psychology, 85, 103842. https://doi.org/10.1016/j.jesp.2019.103842
- Rayner, K. (1998). Eye movements in reading and information processing: 20 years of research. Psychological Bulletin, 124(3), 372–422. https://doi.org/10.1037/0033-2909.124.3.372
- Rayner, K. (2009). The 35th sir Frederick Bartlett Lecture: Eye movements and attention in reading, scene perception, and visual search. Quarterly Journal of Experimental Psychology, 62(8), 1457–1506. https://doi.org/10.1080/17470210902816461
- Rezat, S., & Straesser, R. (2014). Mathematics textbooks and how they are used. In P. Andrews & T. Rowland (Eds.), Masterclass in mathematics education: International perspectives on teaching and learning (pp. 51–62). Bloomsbury.
- Saß, S., Schütte, K., & Lindner, M. A. (2017). Test-takers' eye movements: Effects of integration aids and types of graphical representations. Computers and Education, 109, 85–97. https://doi.org/10.1016/j.compedu.2017.02.007
- Schindler, M., & Lilienthal, A. J. (2019). Domain-specific interpretation of eye tracking data: towards a refined use of the eye-mind hypothesis for the field of geometry. Educational Studies in Mathematics, 101(1), 123–139. https://doi.org/10.1007/s10649-019-9878-z
- Schotter, E. R., Angele, B., & Rayner, K. (2012). Parafoveal processing in reading. Attention, Perception, and Psychophysics, 74(1), 5–35. https://doi.org/10.3758/s13414-011-0219-2
- Schroeder, N. L., & Cenkci, A. T. (2020). Do measures of cognitive load explain the spatial split-attention principle in multimedia learning environments? A systematic review. Journal of Educational Psychology, 112(2), 254–270. https://doi.org/10.1037/edu0000372
- Shepherd, M. D., Selden, A., & Selden, J. (2012). University students' reading of their first-year mathematics textbooks. Mathematical Thinking and Learning, 14(3), 226–256. https://doi.org/10.1080/10986065.2012.682959
- Shepherd, M. D., & van de Sande, C. C. (2014). Reading mathematics for understanding-from novice to expert. Journal of Mathematical Behavior, 35, 74–86. https://doi.org/10.1016/j.jmathb.2014.06.003
- Strohmaier, A. R., MacKay, K. J., Obersteiner, A., & Reiss, K. M. (2020). Eye-tracking methodology in mathematics education research: A systematic literature review. Educational Studies in Mathematics, 104(2), 147–200. https://doi.org/10.1007/s10649-020-09948-1
- Strukelj, A., Scheiter, K., Nyström, M., & Holmqvist, K. (2016). Exploring the lack of a disfluency effect: Evidence from eye movements. Metacognition and Learning, 11(1), 71–88. https://doi.org/10.1007/s11409-015-9146-2
- Sweller, J., van Merrienboer, J. J., & Paas, F. G. (1998). Cognitive architecture and instructional design. Educational Psychology Review, 10(3), 251–296. https://doi.org/10.1023/A:1022193728205
- Tarmizi, R. A., & Sweller, J. (1988). Guidance during mathematical problem solving. Journal of Educational Psychology, 80(4), 424–436. https://doi.org/10.1037/0022-0663.80.4.424
- Thurstone, L. L. (1927). A law of comparative judgement. Psychological Review, 34(4), 273–286. https://doi.org/10.1037/h0070288
- Tindall-Ford, S., Chandler, P., & Sweller, J. (1997). When two sensory modes are better than one. Journal of Experimental Psychology: Applied, 3(4), 257–287. https://doi.org/10.1037/1076-898X.3.4.257
- Tobii Pro (n.d.). Tobii Pro Lab: User's Manual v.1.86.
- Tobii Technology AB (2014). Tobii X2-60 Eye Tracker User's manual v.1.0.3.
- Verhavert, S. (2018). Beyond a mere rank order: The method, the reliability and the efficiency of comparative judgement [Unpublished doctoral dissertation]. University of Antwerp.
- Verhavert, S., Bouwer, R., Donche, V., & De Maeyer, S. (2019). A meta-analysis on the reliability of comparative judgement. Assessment in Education: Principles, Policy and Practice, 26(5), 541–562. https://doi.org/10.1080/0969594X.2019.1602027
- Verhavert, S., De Maeyer, S., Donche, V., & Coertjens, L. (2018). Scale separation reliability: What does it mean in the context of comparative judgement? Applied Psychological Measurement, 42(6), 428–445. https://doi.org/10.1177/0146621617748321
- Weinberg, A., Wiesner, E., Benesh, B., & Boester, T. (2012). Undergraduate students' self-reported use of mathematics textbooks. Primus, 22(2), 152–175. https://doi.org/10.1080/10511970.2010.509336
- Willingham, D. T. (2017). The reading mind: A cognitive approach to understanding how the mind reads. Jossey-Bass.