
Abstract
Aim: Novel treatment options for relapsed/refractory diffuse large B-cell lymphoma include T-cell targeting therapies. Practice efficiency and cost are important for informed treatment decisions. Materials/methods: An institutional decision-maker cost model was developed for 6-month, 1-year and median cycles of treatment time horizons comparing practice efficiency and costs of epcoritamab vs glofitamab and axicabtagene ciloleucel (axi-cel). Results: Overall, epcoritamab required the shortest personnel and chair time, except over 1 year (second shortest chair time). Across all time horizons, epcoritamab was cost-saving vs axi-cel and had similar costs to glofitamab on a per-month basis. Conclusion: Epcoritamab reduced personnel and chair time. Additionally, epcoritamab was cost-saving vs axi-cel and had similar costs to glofitamab on a per-month basis.
Plain language summary
There are new ways to treat diffuse large B-cell lymphoma, which is a type of cancer called lymphoma. When new treatments are available it is important to see if they take more or less time to give to patients and how much they cost versus other treatments. This study looked at three drugs used to treat diffuse large B-cell lymphoma, including epcoritamab, axi-cel and glofitamab. It estimated the time and cost with those treatments in patients who get them for 6 months, 1 year or for the most common length of time in the clinical trials. In most of the scenarios, epcoritamab had the least time needed for nurses or doctors and the least time needed for a patient to be in a chair in a clinic. When thinking about the cost per month, epcoritamab saved money versus axi-cel and was similar to glofitamab.
Diffuse large B-cell lymphoma (DLBCL) is the most common type of non-Hodgkin lymphoma in the USA and, despite aggressive treatment, approximately 35% of patients treated in the second-line setting will require third-line and subsequent treatment.
In 2023, epcoritamab was the first bispecific antibody approved by the US FDA for the treatment of adult patients with relapsed/refractory (R/R) DLBCL; shortly thereafter, glofitamab was approved as the second bispecific antibody by the FDA for the same patient population.
Despite the increased availability of R/R DLBCL treatment options, the ongoing healthcare capacity strain poses a significant obstacle to patients receiving timely care, as many of these treatments require inpatient administration and monitoring.
Therefore, it is increasingly important for institutions to be informed on the impact of treatment choice on clinical practice efficiency and cost to make informed treatment decisions.
A clinical efficiency analysis based on time-and-motion data along with a micro-costing analysis with a variable time horizon of up to 1 year (6 months, 1 year or median cycles received by patients of each comparator) was developed to compare practice efficiency and total costs of epcoritamab to glofitamab and axi-cel for the treatment of patients with R/R DLBCL.
Epcoritamab was associated with more favorable personnel and chair time relative to axi-cel and glofitamab and, as epcoritamab is administered subcutaneously, treatment with epcoritamab reduced personnel costs and inpatient costs despite more frequent dosing.
Pressures on care delivery and patient scheduling due to capacity constraints at infusion centers may be alleviated with utilization uptake of epcoritamab, and the institutional resources saved (e.g., staff time, chair time, inpatient monitoring) may be redirected to other care needs to improve the availability and quality of healthcare services for patients.
When examining total costs of care, epcoritamab was cost-saving vs axi-cel and had similar costs to glofitamab on a per-month basis, but cost differences vs glofitamab were shown to vary depending on the time horizon, which may be important to healthcare decision-makers who evaluate costs based on median treatment durations and over defined 6-month and 1-year time horizons.
1. Background
Diffuse large B-cell lymphoma (DLBCL) is the most common type of non-Hodgkin lymphoma with more than 31,000 new cases diagnosed per year in the USA [Citation1–3]. Despite aggressive treatment, approximately 35% of patients treated in the second-line setting will require third-line and subsequent (3L+) treatment [Citation4,Citation5]. These patients represent a difficult-to-treat relapsed or refractory patient population [Citation6]. Approved treatment options for patients with relapsed/refractory (R/R) DLBCL include polatuzumab + bendamustine and rituximab, tafasitamab + lenalidomide and chimeric antigen receptor (CAR) T-cell therapy [Citation7]. In 2023, epcoritamab was the first bispecific antibody approved by the US FDA for the treatment of adult patients with R/R DLBCL, not otherwise specified (NOS), including DLBCL arising from indolent lymphoma, and high-grade B-cell lymphoma after ≥2 lines of systemic therapy in the 3L+ setting [Citation8]. Shortly thereafter, glofitamab was approved as the second bispecific antibody by the FDA for the treatment of adult patients with R/R DLBCL, NOS, or large B-cell lymphoma arising from follicular lymphoma after ≥2 lines of systemic therapy in the 3L+ setting [Citation9].
Despite the increased availability of R/R DLBCL treatment options, the ongoing healthcare capacity strain highlighted by critical staffing shortages, high patient volumes and constraints on physical space poses a significant obstacle to patients receiving timely care, as many of these treatments require inpatient administration and monitoring [Citation10,Citation11]. While epcoritamab and glofitamab are both novel agents in this space, epcoritamab is administered via subcutaneous (SC) administration. Compared with intravenous (iv.) administration, SC administration is associated with reduced direct and indirect costs, increased health-related quality of life in patients and reduced healthcare resource utilization [Citation12–16]. Furthermore, the time to peak levels of cytokines associated with cytokine release syndrome (CRS) with SC administration is prolonged compared with that of iv. administration and is associated with a longer median time to onset of CRS. This shorter administration duration and longer median time to onset of CRS compared with agents that require iv. administration may be more advantageous in terms of cost and practice efficiency. Oncology treatments such as rituximab, bortezomib and daratumumab, which are available in both iv. and SC formulations, have demonstrated comparable efficacy and reduction of administration-related reactions when given via SC administration [Citation17–19]. In addition, SC formulations of oncology treatments are generally associated with cost and time savings compared with iv. formulations as well as allow for the potential for home administration [Citation12,Citation14].
With the availability of both bispecific monoclonal antibodies and CAR T-cell therapies, treatment selection for patients with R/R DLBCL will likely begin to involve considerations on the sequencing of these T-cell-targeting therapies. This choice will be influenced by multiple factors including patient preference, patient-specific factors, such as stem cell transplant or CAR T-cell eligibility, prior treatments received and resolution of adverse events (AEs) from those treatments. Clinical data factors such as durability of response will also be influenced by site-specific factors such as availability of CAR T-cell treatments, experience in managing CRS, neurotoxicity and other AEs and inpatient/outpatient capacity. Therefore, it is increasingly important for institutions to be informed on the impact of treatment choice on clinical practice efficiency and cost to make informed treatment decisions, particularly with the availability of novel treatment options that vary in their administration requirements. This institutional model was developed to compare the practice efficiency and costs of T-cell-targeting therapies including epcoritamab, glofitamab and axicabtagene ciloleucel (axi-cel) for the treatment of patients with R/R DLBCL.
2. Materials & methods
2.1. Population & model design
A clinical efficiency analysis based on time-and-motion data along with micro-costing analysis with a variable time horizon of up to 1 year (6-month, 1-year or median cycles received by patients of each comparator as documented in the drug's prescribing information [PI]) was developed to compare practice efficiency and total costs of epcoritamab to glofitamab and axi-cel for the treatment of patients with R/R DLBCL (). The model was developed in Microsoft Excel® 365.
Figure 1. Model structure.
DLBCL: Diffuse large B-cell lymphoma; R/R: Relapsed/refractory.
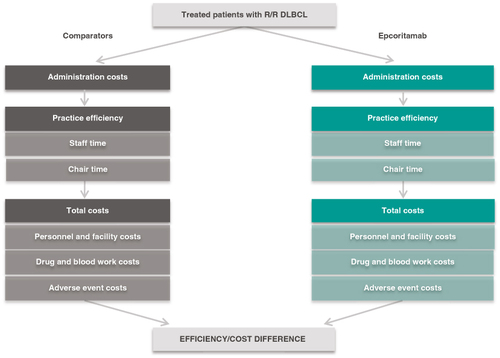
Administration of treatments followed the dosing schedules and durations in each products' PI [Citation8,Citation9,Citation20]. For the 1-year time horizon, it was assumed epcoritamab patients were on treatment for the full year and glofitamab patients stopped treatment at cycle 12 (~9 months), as indicated in each PI. For the 6-month scenario, it was assumed that epcoritamab patients and glofitamab patients were on treatment for the full 6 months. For the median cycles scenario, it was assumed patients were on each treatment for the median duration of treatment as indicated in each PI. Clinical efficiency was calculated from personnel (pharmacy technician, pharmacist and nurse) time and chair time to administer select 3L+ DLBCL treatments and their corresponding premedications and/or bridging and conditioning therapies. They were estimated throughout treatment stages (pre-dosing, blood work, premedications, primary treatment injection/infusion) and in post-treatment monitoring. Total costs were calculated as the sum of costs for medications, blood work, personnel, AE management and hospitalizations. The base case assumed no hydration due to variation in practice, with a scenario where 1-year results were analyzed with hydration included.
2.2. Inputs, data sources & assumptions
Inputs included dosing schedules, time-and-motion parameters during treatment administration and post-treatment monitoring, AE rates and costs ().
Table 1. Model inputs and sources.
Administration inputs included time inputs for pre-dosing, blood work, premedication (or bridging/conditioning therapies as needed based on regimen), infusion/injection of primary treatments and monitoring. Personnel and chair time were derived from published literature and clinical expert opinion. Healthcare resources required for clinical activities were entered on a per-dose basis. The same clinical activity was assumed to require the same amount of personnel time and chair time per dose across drugs, unless specified in the PI.
For premedications, when drug PIs mentioned multiple options for glucocorticoids, clinical opinion was sought to inform the choice of medication. For epcoritamab, premedication consisted of dexamethasone and prednisone, with use split evenly between each (prednisone was used based on clinical input, although the epcoritamab PI recommends prednisolone as premedication). For all treatments, mandatory, unconditional premedication doses were included. Subsequent conditional premedication doses per infusion reactions were not included. For premedications without a specified route of administration in the PI, a 50/50 split was assumed between oral and iv. administration. The only exceptions were with acetaminophen, which was assumed to be only by mouth, and methylprednisolone, which was assumed to be only iv.. Prednisone was prescribed as an oral steroid for patients to take at home on days 2 to 4 following each dose of epcoritamab where premedications were required.
With primary treatment administration, initial step-up doses were assumed to require additional dose calculation time by pharmacy technicians. Full and maintenance doses were assumed to require no dose calculation. For treatment stages where chair time was applicable, chair time was estimated using the sum of staff time. The exception was with drug infusions, where infusion time in the PI informed chair time, and staff time was back-calculated using the literature-based percentage of staff effort during the infusion (64%) [Citation32].
Facility time for inpatient monitoring was calculated based on the recommendation on hospitalization in FDA labels and CRS rates following initial doses reported in pivotal trials. For epcoritamab, patients were hospitalized after the first full dose per PI. Additional hospitalization after the second full dose was included for patients who experienced grade 3 CRS with the previous infusion. For glofitamab, patients were hospitalized after step-up doses 1 and 2 (if any grade CRS was experienced during step-up dose 1) per PI recommendation. The glofitamab PI also recommends that with subsequent doses, patients should be hospitalized if they experienced grade 2 or 3 CRS with previous infusions. The model built in hospitalization with the first full dose based on grade 2+ CRS rates (1.5%) after step-up dose 2. No hospitalization was incorporated for subsequent doses given that the CRS rate was low after step-up dose 2, acknowledging that there could be need of hospitalization for subsequent doses of glofitamab. A 30-minute check-in/paperwork staff time was applied to each inpatient admission. It was assumed that one nurse oversaw four patients during hospitalization, equivalent to a 25% staff effort ratio for every hour a patient was hospitalized. Occurrences of AEs were based on clinical trial experience reported in drug PI.
Cost inputs included unit costs of medications, estimated costs for clinical personnel efforts, costs of blood tests, costs for AE management and costs for inpatient stays. USA-based micro-costing evidence on SC and iv. administration was limited. Best data sources from other countries were used as a proxy. Clinical expert opinion was sought to validate international sources and to fill gaps in staff time and chair time data. Personnel costs were based on US Bureau of Labor Statistics wages and a fringe benefit rate to estimate institutional costs from staff wages [Citation28]. Costs of primary treatment drugs were sourced from Merative Micromedex Red Book, and costs of premedications were obtained from the Centers for Medicare & Medicaid Services (CMS) Average Sales Price (ASP) Pricing Files and Medicaid National Average Drug Acquisition Cost (NADAC) prices [Citation21–23]. Institutional costs of blood tests were derived using the CMS Clinical Laboratory Fee Schedule (CLFS) and the ratio between institutional cost and CMS CLFS rates [Citation30]. An option is available to use Medicare-submitted charges instead of Medicare payment from CLFS; the ratio between institutional cost and submitted charge is used when this option is selected in the model. Costs of hospitalization were based on published hospital expense per inpatient day in the USA and costs to manage AEs were calculated from literature-reported data and CMS hospital cost data [Citation24]. All costs are presented in 2023 US dollars.
A separate scenario assumed that 25% of patients required hydration during treatment administration for all comparators. Unless otherwise specified, hydration with normal saline was provided with an equal split of one 500 ml bag and two 500 ml bags. For epcoritamab, hydration was provided along with the first two full doses. For glofitamab, hydration was provided during the pre-dosing stage while receiving the required single-dose obinutuzumab (all patients receiving 500 ml) and during glofitamab infusion on day 15 of cycle 1 and day 1 of cycle 2. For axi-cel, hydration was provided along with the first two doses of polatuzumab-rituximab bridging therapy and during the one-dose axi-cel administration. Infusion time was assumed to be 60 min per 500 ml of hydration.
2.3. Model outcomes
Results included personnel and chair time required per drug over each time horizon. Total costs for each of the regimens consisted of drug costs (primary treatment drug and other relevant medications), blood work costs, personnel costs, costs of AE management and hospitalization costs. The results were analyzed for all time horizons to account for the different dosing schedules associated with each respective treatment and to analyze the consistency of model results. A separate scenario analyzed the efficiency and cost outcomes when hydration was included.
3. Results
3.1. Base case: 1-year time horizon
The base case examined practice efficiency and costs over a 1-year time horizon for a treated patient with R/R DLBCL. The total number of doses of each treatment over the 1-year time horizon is shown in . Overall, epcoritamab required the shortest personnel time (35 h per patient) and the second shortest chair time (22 h per patient). The shortest chair time was seen with axi-cel (20 h per patient), which required 2 h less than epcoritamab due to the one-time nature of administration of this therapy (, ). SC administration of epcoritamab allowed 30 h of reduced personnel time and 53 h of reduced chair time per patient vs glofitamab iv., resulting in improved practice efficiency.
Table 2. Total number of doses for each treatment during 1-year, 6-month and median cycles time horizons.
Table 3. Per-patient personnel and chair time and costs by drug.
Improved practice efficiency of epcoritamab translated into institutional personnel cost savings per patient of $1563 vs glofitamab and $1300 vs axi-cel (). Post-treatment inpatient monitoring varied across the treatments based on PI-recommended monitoring time and incidence of CRS and was estimated to be 24.6 h per patient for epcoritamab, 37.8 h per patient for glofitamab and 7 days per patient for axi-cel. Reduced inpatient monitoring of epcoritamab resulted in inpatient cost savings of $6891 vs glofitamab and $19,234 vs axi-cel. When total costs were considered, epcoritamab was cost-saving compared with axi-cel (28.9% cost decrease) but modestly cost-increasing vs glofitamab over 1 year (7.8% cost increase). The average monthly cost was $37,288 for epcoritamab, with a marginal increase of $2713 vs that of glofitamab, indicating comparable costs between these bispecific agents despite more frequent dosing and more doses with epcoritamab.
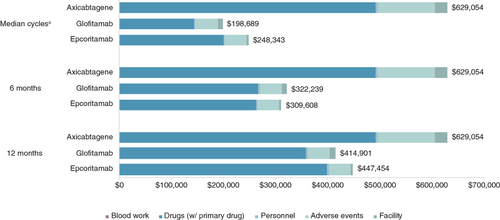
Figure 2. Total cost breakdown over each time horizon.
aNote: When examining costs over median duration of treatment, total costs were lower for glofitamab, while monthly costs were lower for epcoritamab.
3.2. Six-month time horizon scenario
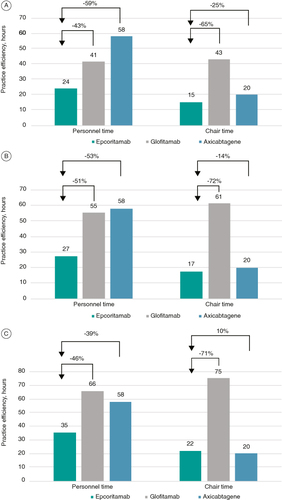
The total number of doses over the 6-month time horizon is shown in . Similar trends were observed when applying a 6-month time horizon, with epcoritamab associated with the shortest personnel (27 h per patient) and chair (17 h per patient) time. Compared with other treatments, epcoritamab reduced personnel time per patient by 28 h vs glofitamab and by 31 h vs axi-cel, and chair time by 44 h vs glofitamab and by 3 h vs axi-cel (, ).
Figure 3. Per-patient personnel and chair time of comparators vs epcoritamab. (A) 1-year time horizon. (B) 6-month time horizon. (C) Median cycles time horizon.
Savings in personnel cost per patient amounted to $1511 vs glofitamab and $1837 vs axi-cel (). Estimated post-treatment monitoring time and inpatient cost savings remained the same over each time horizon, as these costs are incurred directly after treatment administration. Considering total costs over the 6-month period, epcoritamab was cost-saving vs glofitamab (3.9% cost decrease) and axi-cel (50.8% cost decrease). Average monthly cost savings were $2105 vs glofitamab and $53,241 vs axi-cel.
3.3. Median cycles time horizon scenario
This scenario explored the outcomes when patients' duration of treatment equaled the median number of cycles for each treatment. Median cycles were based on the key clinical trials for the included drugs and varied across the comparators. This scenario deviated from the fixed cutoff time frame for all treatments and may potentially better reflect the real-world use of these treatments.
The total number of doses over the median cycles time horizon is shown in . Similar to the 1-year and 6-month time horizons, the shortest personnel (24 h per patient) and chair (15 h per patient) times were seen with epcoritamab (, ). Epcoritamab reduced personnel time per patient by 18 h vs glofitamab and by 34 h vs axi-cel, and chair time by 28 h vs glofitamab and by 5 h relative to axi-cel.
Reduction of personnel cost per patient was $964 vs glofitamab and $2075 vs axi-cel (). Total costs were lower with epcoritamab vs axi-cel when using median cycles for included treatments. Although total costs were higher for epcoritamab ($248,343) vs glofitamab ($198,689) in the median cycle scenario, median time on treatment was also longer for epcoritamab than glofitamab (4.5 vs 3.5 months, respectively). Thus, when examining costs per month, treatment with glofitamab incurred higher monthly costs ($56,768) than treatment with epcoritamab ($55,187).
3.4. Hydration scenario: 1-year time horizon
This scenario evaluated practice efficiency and cost outcomes when hydration was included for all treatments, with an equal split of 12.5% of patients receiving one 500 ml bag of hydration and 12.5% of patients receiving two 500 ml bags of hydration. Personnel and chair time increased by less than 1 h across all treatments, and the differences between treatments remained similar. Total costs were similar to results in the base case, with epcoritamab being cost-saving vs axi-cel. In the 1-year time horizon, the average monthly cost of epcoritamab was $2714 higher than that of glofitamab.
4. Discussion
In this practice efficiency and cost analysis, epcoritamab demonstrated reduced personnel and chair time vs comparator therapies for the treatment of patients with R/R DLBCL. Total costs were comparable between epcoritamab and glofitamab. The results were similar in 6-month, 1-year and median cycles time horizons, with epcoritamab demonstrating a reduced personnel and chair time profile than comparator treatments for these time frames. Inclusion of hydration did not change the results of the model.
These findings are consistent with results from prior studies comparing the practice efficiency of SC vs iv. treatments in oncology. In a real-world assessment comparing the practice efficiency of SC vs iv. rituximab, SC rituximab demonstrated a 37% relative reduction in chair time [Citation40]. In a retrospective efficiency and survey study that compared practice efficiency variables of SC vs iv. bortezomib, SC bortezomib was associated with a 38% reduction in chair time and a 27% reduction in infusion center visit time [Citation41]. Similarly, a model-based cost-minimization analysis of SC vs iv. trastuzumab demonstrated overall savings of $6241.40 associated with SC trastuzumab treatment for 1 year [Citation42]. One difference to note is that the current study focused on multiple SC and iv. treatments indicated for R/R DLBCL, while prior studies regarding the practice efficiency of SC vs iv. treatments compared the SC vs iv. administration of the same oncology treatment or were broad systematic reviews of SC vs iv. oncology treatments.
As the population of newly diagnosed patients with cancer continues to grow, the estimated incidence is projected to reach over 1.8 million by 2040 [Citation43]. The current capacity constraint in oncology care is projected to worsen, which may further limit the quality of care that patients require [Citation44,Citation45]. By 2025, overall demand for oncologist services is projected to increase by 40% while the supply may only grow by 25%, resulting in a shortage of 2258 full-time equivalents of patient care personnel [Citation46].
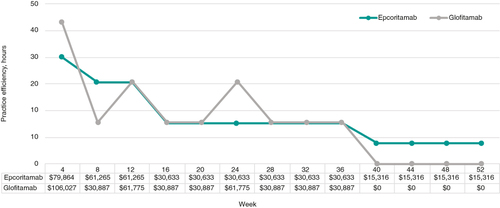
By comparing the practice efficiency of available treatment options for R/R DLBCL, payers and clinicians will be able to evaluate the impact of available treatment options on infusion capacity and personnel resources in continuing to provide safe and high-quality patient care. The marginally higher costs of epcoritamab come from more frequent dosing during weeks 5 to 8, and that treatment with epcoritamab continues until disease progression throughout the time horizon while glofitamab stops at 12 cycles (). Lastly, the differences in cost between these two bispecific agents is minimal and should also be weighed alongside the institutional impact of care delivery for these treatments. As data mature on outpatient dosing and monitoring of epcoritamab for patients with R/R DLBCL, the cost of care may continue to decrease.
Figure 4. Total costs for epcoritamab and glofitamab by 4-week interval over 1-year time horizon.
Note: The spikes with the glofitamab line are due to the cluster of two doses during weeks 9 to 12 and 21 to 24 when the 3-week cycle is mapped over to a 4-week interval.
It is important to note that recent evidence on CRS management has been published for bispecific agents. Both epcoritamab and glofitamab achieved lower CRS rates with dexamethasone prophylaxis. In our model, premedication was split between dexamethasone and prednisone but may clinically be composed solely of dexamethasone based on these updated data. However, the change to dexamethasone as premedication would be expected to minimally impact our model results. In these updated analyses, the incidence of grade 2+ CRS with glofitamab was 19.6% [Citation47], while no grade 2+ CRS events were reported with epcoritamab [Citation48]. Using the data in our model, the cost of AEs decreased for both treatments, but, as expected, to a greater extent for epcoritamab (from $42,697 to $34,119; reduced by 20.1%) than for glofitamab (from $42,719 to $38,462; reduced by 10.0%); this further decreased the total cost of epcoritamab compared with glofitamab. However, sample sizes for the published data thus far are small and may not be representative of all patients, such as those with higher tumor burden who are more likely to experience CRS and have more severe CRS. Further investigation will be needed to understand the impact of dexamethasone as the corticosteroid of choice for prevention of CRS and its impact on the economic considerations of T-cell-targeting therapies.
4.1. Limitations
This model is limited by assumptions inherent to economic modeling regarding disease states, treatment patterns and costs and cannot reflect patient heterogeneity or variability in practice patterns. The interplay of these factors in the real world is more complex. Premedications were administered for initial required cycles, with optional doses omitted regardless of presence of infusion-related reactions in initial cycles. Axi-cel was used to provide a representation of a CAR T-cell therapy, given that the administration process and involvement by clinical personnel are expected to be similar between treatments within this category, hence the same practice efficiency results when compared with epcoritamab. Other CAR T-cell therapies, such as lisocabtagene maraleucel (liso-cel), may be associated with a lower total cost of care than axi-cel due to differences in their toxicity profiles [Citation49]. However, epcoritamab is still expected to provide a less costly alternative compared with liso-cel because of the difference between drug prices. Costs may be institution- or plan-specific due to discounts or other variations; therefore, the published costs utilized as model inputs may not be generalizable to every scenario. USA-based time and motion evidence on SC and iv. administration is limited. The best data sources from other countries were used as a proxy and gaps were validated by US clinical experts. The same clinical activity was assumed to require the same amount of personnel time and chair time per dose across drugs, unless specified in the PI.
While patients receiving epcoritamab may remain on treatment for longer than 1 year in the absence of disease progression or unacceptable toxicity, the intent of this model was the capture to total cost of care within time horizons that are meaningful to institutional decision-makers and not to capture long-term cost-effectiveness of the treatments, which considers both long-term costs and long-term clinical benefits. Further analyses examining cost-effectiveness may provide additional context on the value of bispecific antibodies.
5. Conclusion
In this practice efficiency analysis, epcoritamab was associated with more favorable personnel and chair time relative to axi-cel and glofitamab. As epcoritamab is administered SC, treatment with epcoritamab reduced personnel costs and inpatient costs despite more frequent dosing. Pressures on care delivery and patient scheduling due to capacity constraints at infusion centers may be alleviated with utilization uptake of epcoritamab. The institutional resources saved (e.g., staff time, chair time, inpatient monitoring) may be redirected to other care needs to improve the availability and quality of healthcare services for patients.
When examining total costs of care, epcoritamab was cost-saving vs axi-cel and had similar costs to glofitamab on a per-month basis. Cost differences vs glofitamab were shown to vary depending on the time horizon. At the 1-year time horizon, total costs were marginally higher, and the increase was primarily driven by the more frequent dosing with epcoritamab and that patients may remain on treatment with epcoritamab until disease progression. At the 6-month time horizon, total costs for glofitamab were marginally higher. When examining costs over median duration of treatment, while total costs were lower for glofitamab, monthly costs were lower for epcoritamab. This information may be important to healthcare decision-makers who evaluate costs based on median treatment durations and over defined 6-month and 1-year time horizons.
Author contributions
All authors have substantially contributed to the conception and design of the article and interpreting the relevant literature. All authors have been substantially involved in writing the article or revising it for intellectual content. All authors agreed on the journal to which the article has been submitted and reviewed and agreed on all versions of the article before submission and during revision. Q Li, K O'Day, K Meyer were involved in the model design and analysis and interpretation of data. M Lei, A Wang, MP Jun were involved in the model design and data interpretation. All authors agree to take responsibility and be accountable for the contents of the article and to share responsibility to resolve any questions raised about the accuracy or integrity of the published work.
Financial disclosure
Genmab and AbbVie provided funding for this study and the development of the manuscript. Q Li, K O'Day and K Meyer are employees of Cencora. MP Jun is an employee of Genmab. A Wang is an employee of AbbVie. M Lei receives honoraria from AstraZeneca, BTG Therapeutics, Genentech, Genmab, MJH Life Sciences and TScan Therapeutics. The authors have no other relevant affiliations or financial involvement with any organization or entity with a financial interest in or financial conflict with the subject matter or materials discussed in the manuscript apart from those disclosed.
Writing disclosure
Medical writing support was provided by J Jung and BK Schroader from Cencora and was funded by Genmab US, Inc.
Ethical conduct of research
No institutional board review or approval was required for this research as it is a hypothetical model with data sourced from publicly available information, as noted throughout the manuscript.
Conflict of interests disclosure
Q Li, K O'Day and K Meyer are employees of Cencora. MP Jun is an employee of Genmab. A Wang is an employee of AbbVie. M Lei receives honoraria from AstraZeneca, BTG Therapeutics, Genentech, Genmab, MJH Life Sciences and TScan Therapeutics. The authors have no other competing interests or relevant affiliations with any organization or entity with the subject matter or materials discussed in the manuscript. This includes employment, consultancies, honoraria, stock ownership or options, expert testimony, grants or patents received or pending, or royalties.
Additional information
Funding
Notes
1 This article was originally published with errors, which have now been corrected in the online version. Please see Correction (http://dx.doi.org/10.1080/14796694.2024.2375846).
References
- Teras LR, DeSantis CE, Cerhan JR, et al. 2016 US lymphoid malignancy statistics by World Health Organization subtypes. CA Cancer J Clin. 2016;66(6):443–459. doi:10.3322/caac.21357
- National Cancer Institute. Surveillance Epidemiology, and End Results Program. Cancer stat facts: NHL—diffuse large B-cell lymphoma (DLBCL). Accessed September 22, 2023. Available from: https://seer.cancer.gov/statfacts/html/dlbcl.html
- Crump M, Neelapu SS, Farooq U, et al. Outcomes in refractory diffuse large B-cell lymphoma: results from the international SCHOLAR-1 study. Blood. 2017;130(16):1800–1808. doi:10.1182/blood-2017-03-769620
- Sehn LH, Salles G. Diffuse large B-cell lymphoma. N Engl J Med. 2021;384(9):842–858. doi:10.1056/NEJMra2027612
- Johnston KJ, Jun M, Davies K, et al. Estimating the incidence of diffuse large B-cell lymphoma by line of therapy in the US using an epidemiological model to examine patient flow and treatment patterns. Poster presented at: American Managed Care Pharmacy Nexus National Meeting. National Harbor, MD, and virtual; October 11–14, 2022.
- Alderuccio JP, Sharman JP. ABCs of ADCs in management of relapsed/refractory diffuse large B-cell lymphoma. Blood Rev. 2022;56:100967. doi:10.1016/j.blre.2022.100967
- Nedved A, Maddocks K, Nowakowski GS. Clinical treatment guidelines for tafasitamab plus lenalidomide in patients with relapsed or refractory diffuse large B-cell lymphoma. Oncologist. 2023;28(3):199–207. doi:10.1093/oncolo/oyac256
- Epkinly. Prescribing information. Genmab US, Inc; 2023. Accessed October 2, 2023. Available from: www.genmab-pi.com/prescribing-information/epkinly-pi.pdf
- Columvi. Prescribing information. Genentech, Inc; 2023. Accessed October 2, 2023. Available from: www.gene.com/download/pdf/columvi_prescribing.pdf
- Vokes EE. Amid healthcare workforce shortages, staffing guidance should ensure protection of individuals with cancer. American Society of Clinical Oncology (ASCO). Accessed September 25, 2023. Available from: https://old-prod.asco.org/news-initiatives/policy-news-analysis/amid-healthcare-workforce-shortages-staffing-guidance-should
- Bailey V. Hospitals increase recruitment strategies amid workforce shortages. Xtelligent Healthcare Media a division of TechTarget. Accessed September 25, 2023. Available from: https://revcycleintelligence.com/news/hospitals-increase-recruitment-strategies-amid-workforce-shortages
- Anderson KC, Landgren O, Arend RC, et al. Humanistic and economic impact of subcutaneous versus intravenous administration of oncology biologics. Future Oncol. 2019;15(28):3267–3281. doi:10.2217/fon-2019-0368
- Epstein RS. Payer perspectives on intravenous versus subcutaneous administration of drugs. Clinicoecon Outcomes Res. 2021;13:801–807. doi:10.2147/ceor.S317687
- McCloskey C, Ortega MT, Nair S, et al. A systematic review of time and resource use costs of subcutaneous versus intravenous administration of oncology biologics in a hospital setting. PharmacoEconomics - Open. 2023;7(1):3–36. doi:10.1007/s41669-022-00361-3
- Stenger M. Subcutaneous vs. IV administration of medications and fluids in patients with cancer: U.S. vs Canadian cancer center methods. American Society of Clinical Oncology (ASCO). Accessed September 29, 2023. Available from: https://ascopost.com/news/march-2023/subcutaneous-vs.-iv-administration-of-medications-and-fluids-in-patients-with-cancer/
- Tang M, Abdelaal M, Lau J, et al. Subcutaneous vs intravenous administration of medications and fluids for patients with cancer in the US and Canada. JAMA Oncol. 2023;9(5):717–719. doi:10.1001/jamaoncol.2023.0239
- Lugtenburg P, Avivi I, Berenschot H, et al. Efficacy and safety of subcutaneous and intravenous rituximab plus cyclophosphamide, doxorubicin, vincristine, and prednisone in first-line diffuse large B-cell lymphoma: the randomized MabEase study. Haematologica. 2017;102(11):1913–1922. doi:10.3324/haematol.2017.173583
- Moreau P, Pylypenko H, Grosicki S, et al. Subcutaneous versus intravenous administration of bortezomib in patients with relapsed multiple myeloma: a randomised, Phase III, non-inferiority study. Lancet Oncol. 2011;12(5):431–440. doi:10.1016/s1470-2045(11)70081-x
- Usmani SZ, Nahi H, Legiec W, et al. Final analysis of the Phase III non-inferiority COLUMBA study of subcutaneous versus intravenous daratumumab in patients with relapsed or refractory multiple myeloma. Haematologica. 2022;107(10):2408–2417. doi:10.3324/haematol.2021.279459
- Yescarta. Prescribing information. Kite Pharma, Inc; 2023. Accessed January 11, 2024. Available from: www.gilead.com/-/media/files/pdfs/medicines/oncology/yescarta/yescarta-pi.pdf
- Centers for Medicare & Medicaid Services. Average sales price pricing files. April 2023. Accessed May 15, 2023. Available from: www.cms.gov/medicare/payment/all-fee-service-providers/medicare-part-b-drug-average-sales-price/asp-pricing-files
- Data.Medicaid.gov. National average drug acquisition cost. Accessed May 31, 2022. Available from: https://data.medicaid.gov/nadac
- Merative Micromedex. Merative Micromedex RED BOOK. Accessed April 2023. Available from: www.micromedexsolutions.com/home/dispatch
- Centers for Medicare & Medicaid Services. Addendum A and Addendum B updates. 2023. Accessed May 15, 2023. Available from: www.cms.gov/medicare/payment/prospective-payment-systems/hospital-outpatient/addendum-a-b-updates
- Abramson JS, Siddiqi T, Garcia J, et al. Cytokine release syndrome and neurological event costs in lisocabtagene maraleucel-treated patients in the TRANSCEND NHL 001 trial. Blood Adv. 2021;5(6):1695–1705. doi:10.1182/bloodadvances.2020003531
- Dasta JF, McLaughlin TP, Mody SH, et al. Daily cost of an intensive care unit day: the contribution of mechanical ventilation. Crit Care Med. 2005;33(6):1266–1271. doi:10.1097/01.ccm.0000164543.14619.00
- Kaiser Family Foundation. Hospital adjusted expenses per inpatient day. 2021. Accessed May 15, 2023. Available from: www.kff.org/health-costs/state-indicator/expenses-per-inpatient-day/?currentTimeframe=0&sortModel=%7B%22colId%22:%22Location%22,%22sort%22:%22asc%22%7D
- U.S. Bureau of Labor Statistics. Occupational employment and wage statistics. May 2022. Accessed May 15, 2023. Available from: www.bls.gov/oes/current/oes_stru.htm
- U.S. Bureau of Labor Statistics. Data Tools. 2022. Accessed May 24, 2023. Available from: www.bls.gov/data/home.htm
- Centers for Medicare & Medicaid Services. Clinical laboratory fee schedule files. 2023. Accessed May 15, 2023. Available from: www.cms.gov/medicare/payment/fee-schedules/clinical-laboratory-fee-schedule-clfs/files
- American Society for Health Care Risk Management. Underpayment by Medicare and Medicaid fact sheet. January 2020. Accessed May 31, 2022. Available from: www.ashrm.org/node/5075
- Pierce CA, Baker JJ. A nursing process model: quantifying infusion therapy resource consumption. J Infus Nurs. 2004;27(4):232–244. doi:10.1097/00129804-200407000-00008
- Harvey MJ, Zhong Y, Morris E, et al. Assessing the transition from intravenous to subcutaneous delivery of rituximab: benefits for payers, health care professionals, and patients with lymphoma. PLOS ONE. 2022;17(1):e0261336. doi:10.1371/journal.pone.0261336
- Shinder GA, Paradis PE, Posman M, et al. Patient and work flow and costs associated with staff time and facility usage at a comprehensive cancer centre in Quebec, Canada—a time and motion study. BMC Health Serv Res. 2012;12:370. doi:10.1186/1472-6963-12-370
- Burcombe R, Chan S, Smiock R, et al. Subcutaneous trastuzumab (Herceptin®): a UK time and motion study in comparison with intravenous formulation for the treatment of patients with HER2-positive early breast cancer. Adv Breast Cancer Res. 2013;2:133–140.
- North RT, Harvey VJ, Cox LC, et al. Medical resource utilization for administration of trastuzumab in a New Zealand oncology outpatient setting: a time and motion study. Clinicoecon Outcomes Res. 2015;7:423–430. doi:10.2147/ceor.S85599
- De Cock E, Kritikou P, Sandoval M, et al. Time savings with rituximab subcutaneous injection versus rituximab intravenous infusion: a time and motion study in eight countries. PLOS ONE. 2016;11(6):e0157957. doi:10.1371/journal.pone.0157957
- Rule S, Collins GP, Samanta K. Subcutaneous vs. intravenous rituximab in patients with non-Hodgkin lymphoma: a time and motion study in the United Kingdom. J Med Econ. 2014;17(7):459–468. doi:10.3111/13696998.2014.914033
- Slavcev M, Spinelli A, Absalon E, et al. Results of a time and motion survey regarding subcutaneous versus intravenous administration of daratumumab in patients with relapsed or refractory multiple myeloma. Clinicoecon Outcomes Res. 2021;13:465–473. doi:10.2147/ceor.S302682
- Drill E, Qiu A, Shapouri S, et al. Real-world assessment of patient care and practice efficiency with the introduction of subcutaneous rituximab. Oncology (Williston Park). 2021;35(12):804–811. doi:10.46883/2021.25920935
- Barbee MS, Harvey RD, Lonial S, et al. Subcutaneous versus intravenous bortezomib:efficiency practice variables and patient preferences. Ann Pharmacother. 2013;47(9):1136–1142. doi:10.1177/1060028013503122
- Rojas L, Muñiz S, Medina L, et al. Cost-minimization analysis of subcutaneous versus intravenous trastuzumab administration in Chilean patients with HER2-positive early breast cancer. PLOS ONE. 2020;15(2):e0227961. doi:10.1371/journal.pone.0227961
- Rahib L, Wehner MR, Matrisian LM, et al. Estimated projection of US cancer incidence and death to 2040. JAMA Netw Open. 2021;4(4):e214708. doi:10.1001/jamanetworkopen.2021.4708
- Takvorian SU, Balogh E, Nass S, et al. Developing and sustaining an effective and resilient oncology careforce: opportunities for action. J Natl Cancer Inst. 2020;112(7):663–670. doi:10.1093/jnci/djz239
- Shulman LN, Sheldon LK, Benz EJ. The future of cancer care in the United States—overcoming workforce capacity limitations. JAMA Oncol. 2020;6(3):327–328. doi:10.1001/jamaoncol.2019.5358
- Yang W, Williams JH, Hogan PF, et al. Projected supply of and demand for oncologists and radiation oncologists through 2025: an aging, better-insured population will result in shortage. J Oncol Pract. 2014;10(1):39–45. doi:10.1200/jop.2013.001319
- Falchi L, Carlo-Stella C, Morschhauser F, et al. Dexamethasone is associated with a lower incidence and severity of cytokine release syndrome compared with other corticosteroid regimens when given as premedication for glofitamab monotherapy in patients with relapsed/refractory (R/R) large B-cell lymphoma (LBCL). Blood. 2023;142(Suppl. 1):3130. doi:10.1182/blood-2023-173949
- Vose JM, Feldman T, Chamuleau M, et al. Mitigating the risk of cytokine release syndrome (CRS): preliminary results from a DLBCL cohort of Epcore NHL-1. Blood. 2023;142(Suppl. 1):1729. doi:10.1182/blood-2023-180333
- Portugese AJ, Albittar A, Huang JJ, et al. Real-world comparison of lisocabtagene maraleucel (liso-cel) and axicabtagene ciloleucel (axi-cel): efficacy & toxicity. Transplant Cell Ther. 2024;30(2):S192.