
 ?Mathematical formulae have been encoded as MathML and are displayed in this HTML version using MathJax in order to improve their display. Uncheck the box to turn MathJax off. This feature requires Javascript. Click on a formula to zoom.
ABSTRACT
Cross-cutting of felled trees into logs (“bucking”) is a critical step in converting standing timber into end products, as it predetermines and limits number, type and value of products that can be produced from the logs. Bucking by chainsaw is currently not aided by information technology and volume and value recovery depend on the chainsaw operator’s proficiency. A recently presented novel mobile device-based application (“T4E Bucking App”) for assisting value-maximized bucking by chainsaw was evaluated during harvesting in a mature beech stand regarding taper curve estimation accuracy. Further, its bucking patterns were benchmarked against an experienced chainsaw operator’s choice and time consumption for app operation was determined. Taper curves were inadequately approximated and log mid diameters (1.0 cm, SD=2.4) and log volume (0.02 m3 under bark [UB] m3, SD=0.04) were significantly overestimated. Consequently, total observed volume (–8.7%) and value (–8.1%) were smaller than estimated. Inappropriate pricing and insufficient top diameters caused further reductions. Thus, total recovered volume (59.61 m3 UB; –8.8%) and value (€2,099.66; –8.6%) were smaller than estimated. Chainsaw operator’s totals differed marginally (58.59 m3 UB; €2,117.99). About 85% of the variation of time consumption for working with the app was explained by tree volume and number of grade sections. After accounting for time consumption, net value recovery was 5.1% lower than in the chainsaw operator’s case. The T4E Bucking App nevertheless represents a first step towards digitalization of motor-manual bucking and may soon be enhanced by more accurate taper curves derived from terrestrial laser scanning data.
Introduction
When timber is harvested, trees are felled, delimbed, and cross-cut (“bucked”) into a combination (“bucking pattern”) of pieces of certain length, diameter, and grade (“assortments”) with a respective value. Bucking is a critical step in converting standing timber into end products, as it predetermines and limits the number, type and value of products that can produced from the logs (Pnevmatico and Mann Citation1972; Waddell Citation1982) and thus greatly affects the return to the supplier and value to the buyer in the subsequent processing and sale stages (Eng and Wythe Citation1982). Besides sawing of bucked logs at the mill, bucking of a stem into logs presents the greatest potential for optimizing volume and value recovery (Faaland and Briggs Citation1984).
Näsberg (Citation1985) defined the “marking for bucking problem” as follows:
The marking for bucking problem (MBP) is the problem of converting a single tree stem into smaller logs in such a way that the total stem value, according to a given price list for logs, is maximized. MBP consists of choosing the most profitable combination of log lengths, diameters and qualities, from a normally very large set of stem conversion alternatives (Näsberg Citation1985).
Due to its complexity, the MBP has been addressed by mathematical modeling early on: Smith and Harrell (Citation1961) were the first to employ a linear programming model to consider bucking pattern alternatives under resource and market limitations, while Pnevmaticos and Mann (Citation1972) applied the dynamic programming technique to the MBP for the first time. Both techniques have seen frequent application ever since (Eng and Whyte Citation1982; Waddell Citation1982; Faaland and Briggs Citation1984; Eng and Daellenbach Citation1985; Mendoza and Bare Citation1986; Pickens et al. Citation1997; Grondin Citation1998; Puumalainen Citation1998; Wang et al. Citation2004, Citation2009; Acuna and Murphy Citation2005; Bont Citation2005; Akay et al. Citation2010). In addition, network analysis (Näsberg Citation1985; Sessions et al. Citation1988), heuristic techniques (Laroze and Greber Citation1997; Laroze Citation1999), as well as genetic algorithm or fuzzy logic (Kivinen Citation2007) have been employed. Bucking patterns can be optimized on the stem, stand, and forest level. While the pattern of each tree is optimized in the first case, optimum bucking patterns are derived for stem classes in the second case and for whole stands in the latter case (Laroze Citation1999).
BUCK, developed by Oregon State University in the 1980s, is the most prominent example of software for stem-level optimization in operations involving bucking by chainsaws. Run on an HP94 handheld computer, it allowed bucking pattern optimization at the stump (Sessions et al. Citation1988). In New Zealand, Geerts and Twaddle (Citation1984) developed AVIS for operation on microcomputers and, later, mobile devices. TREEVAL (Briggs Citation1989), also developed by Oregon State University, enabled both optimizing bucking patterns and comparing user-specific bucking patterns. In the 1990s, HW BUCK (Pickens et al. Citation1993) was developed specifically for bucking of hardwoods. Bont (Citation2005) developed an Excel spreadsheet-based bucking pattern optimization tool, which considered fuel wood in addition to saw logs and pulpwood.
The effect of bucking pattern optimization on volume and value recovery has been studied intensively. In most cases, optimization resulted in an increase of volume and value recovery. Gross value recovery increases ranged from 3.2% to 18.7% (Garland et al. Citation1989; Sessions et al. Citation1989; Olsen et al. Citation1997; Bowers Citation1998; Wang et al. Citation2004, Citation2009; Akay et al. Citation2010), while net value recovery increases (after accounting for the additional cost of bucking pattern optimization) were 1.8% to 6.9% (Sessions et al. Citation1989; Olsen et al. Citation1997; Bowers Citation1998). For volume, recovery increases of 0.1% to 16.6% (Garland et al. Citation1989; Bowers Citation1998; Wang et al. Citation2004, Citation2009) were reported. Pickens et al. () conducted intensive trainings of chainsaw operators with HW-BUCK and reported an increase of about 20% in value recovery one year after the training.
Despite these advantages, commercialization of bucking pattern optimization for bucking by chainsaw was limited and development of new applications was discontinued in the 1990s. Contrarily, it continued for highly and fully mechanized harvesting machinery, platforms that were considered more promising for various reasons (e.g. sensor technology instead of manual measurements). For these, bucking pattern optimization software is offered by many manufacturers today (Labelle et al. Citation2017).
However, bucking pattern optimization can still be considered relevant in a bucking by chainsaw context. According to a recent study (TECH4EFFECT Citation2020), 45% of the wood value chains in Europe still involve motor-manual felling, and many of these also motor-manual delimbing and bucking. Especially among less experienced and semiprofessional chainsaw operators, value loss caused by inadequate bucking may still be a relevant issue, though its extent today may be lower than reported by Murphy (Citation1987; 20% to 25% of standing stand value), due to enhanced education and training possibilities. In this context, bucking pattern optimization could help to simultaneously raise contribution margins and resource efficiency. Its relevance may further increase due to the climate change-induced species composition shift toward hardwood species, which is expected to entail growing demand for motor-manual work (Berendt et al. Citation2017). Finally, the technological framework today is more favorable than in the past: light and low-cost hardware, whose capabilities (computing power, sensor technology) exceed that of the past by far is readily available in the form of smartphones and tablets. The use of apps on these platforms has become routine, especially for the younger generation adept at and open to using apps for various purposes, also in a forestry context.
Recently, a novel mobile device-based application for assisting value-maximized bucking by chainsaw, the “T4E Bucking App”, was developed in the scope of the TECH4EFFECT project (http://www.tech4effect.eu/). It is designed for Android OS devices and joins tree parameters (stem shape and grade) and bucking specifications (assortments defined by length, mid diameter, grade and value, excess length, top diameter) to derive a value-maximized bucking pattern by a network analysis approach. In addition, tree-by-tree and assortment summaries are provided and can be shared via the mobile device’s communication services. The app is available from Google PlayFootnote1 and auser manual (Erber et al. Citation2019) is provided on the project website.Footnote2
The usefulness of bucking pattern optimization strongly depends on accurate emulation of a tree’s taper curve, as deviations entail inappropriate and nonoptimal solutions, a task complicated by occurrence of stem defects, regardless of whether bucking is performed by harvesters, processors or chainsaws (Kivinen Citation2007). Erber (Citation2018) evaluated the T4E Bucking App’s taper curve algorithm in a softwood stand and concluded that it provided a reasonably accurate approximation of the taper curve. Any larger deviations were associated with the occurrence of large branches or forks. However, the algorithm has not been evaluated in a hardwood stand yet, an environment considered more challenging regarding bucking pattern optimization (Wang et al. Citation2004, Pickens et al. 2006). To be of added value to a professional user, the app’s bucking pattern solution would need to be superior regarding recovered value, the gain covering at least the additional cost incurred for working with the app. So far, the app has not been benchmarked against an experienced professional chainsaw operator, who can be considered the reference for (near-) optimal bucking (Wang et al. Citation2004).
To fill the abovementioned gaps, a field study was conducted in a mature European beech stand in Eastern Austria during a secondary felling treatment. The goal was to evaluate the T4E Bucking App’s taper curve approximation accuracy, to quantify the effect of deviations and to benchmark the app’s bucking patterns against the choice of an experienced chainsaw operator regarding volume and value recovery. Finally, a model for estimating the additional time consumption for working with the app should be developed and the associated cost should be balanced against a potential gain in value recovery.
Materials and methods
T4E Bucking App
Workflow
Before operation, all permissible assortments (according to contract) must be defined by species, nominal length, diameter class and price per m3 (). This task is facilitated by a dedicated Microsoft Excel spreadsheet solution, which creates a definition file that is then transferred to the mobile device, where it is linked to a new operation created in the app. Operation settings include mandatory (height above sea level, minimum top diameter over bark, OB) and optional information (e.g. operation name). In addition to the default excess length according to Austrian Timber Trade Guidelines (1.0% coniferous species or 1.5% broadleaf species of the nominal length, with a minimum of 6 cm, regardless of nominal length and species; Wiener Börse Citation2006), a user-specific additional excess length can be specified.
Figure 1. Function diagram of the T4E Bucking App
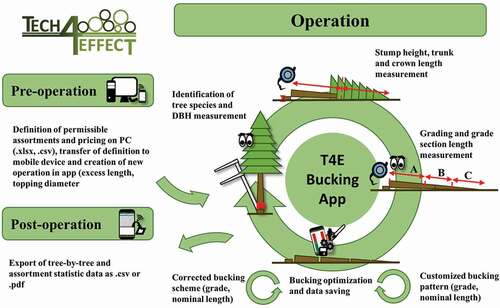
At the start of the optimization process, the user must select the tree species. Currently, the app supports five tree species common in Central Europe: Norway spruce (Picea abies (L.) H. Karst.), Fir (Abies alba Mill.) Larch (Larix decidua Mill.), Scots pine (Pinus sylvestris L.) and European beech (Fagus sylvatica L.). Then diameter at breast height (DBH; cm OB, rounded-off to full cm), stump height (m), trunk (from felling cut to crown base; m) and crown length (from crown base to tree top; m) need to be entered. Crown base is defined as the first branch whorl with at least one live knot not followed by a branch whorl without a live knot. From this data tree height and volume OB are calculated. Subsequently, the user must assess the grades along the stem visually and enter the length of individual grade sections. By default, a grade termed “damage” is available. It can be assigned up to twice per tree, which was considered sufficient in the majority of cases. Its purpose is to 1) specify segments that must be excluded from optimization for shape or properties that preclude turning them into merchantable assortments (e.g. deformation, stem break) and 2) to identify mandatory cutting points, e.g. to avoid excessive sweep.
For approximation of the taper curve, the stem is divided into three sections: a truncated neiloid below DBH, a truncated cone between DBH and crown base and a paraboloid (coniferous species) or cone (broadleaf species) above crown base. Felling diameter and crown base diameters are estimated with functions derived from Austrian national forest inventory data (Eckmüllner et al. Citation2007). Double bark thickness is estimated with functions of Altherr et al. (Citation1974, Citation1975, Citation1978) and subtracted from the diameter over bark (OB) to obtain diameter under bark (UB).
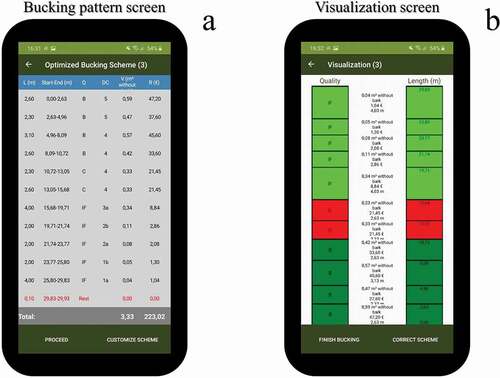
An optimal bucking pattern is derived for the taper curve UB, whereby “optimal” corresponds to maximum gross value. For its determination, the network analysis approach of Sessions et al. (Citation1988) is employed. If a stem consists of two or three segments (e.g. due to stem break), the value of each segment is optimized separately. In case of multiple solutions, the app prefers the pattern 1) exhibiting the lowest number of logs (cross-cuts) and 2) a maximum of utilized stem length. Thus, the app provides one out of potentially several maximum value solutions (Erber Citation2018), presented in tabular form (). Presentation includes nominal length, actual cutting points (including excess length and a cut slit of 1 cm), grade, diameter class, volume, and gross value. At this stage, the pattern can be customized (alter nominal length/grade; delete/add assortments) and compared to the solution of the app regarding gross value recovery, volume recovery and stem length utilization. Alternatively, the user may proceed directly to the bucking pattern visualization (). The pattern can also be corrected during bucking (e.g. re-grading of a log due to an internal defect).
Figure 2. Example of T4E Bucking App screens: tabular (a) and graphical (b) display of the derived bucking pattern
After completion of bucking, the user may quit or proceed with the next tree. Tree-by-tree (tree parameters and bucking pattern) and assortment summary statistics (volume and gross value) can be accessed via the main menu of the app for individual operations, exported as pdf and csv-files and shared via the mobile device’s communication services.
Target audience and purpose
The T4E Bucking App has been designed for three different target audiences and purposes. Firstly, it can be used in teaching and training (demonstrating the impact of different bucking decisions; self-learning by comparing personal and app solution). Secondly, it can act as a decision support tool for semiprofessional users, who harvest at irregular intervals and may be willing to spend more time on bucking. Though the additional time consumption for working with the app may preclude continuous use by professional chainsaw operators, they could employ it for calibration to changing work environment conditions (tree species, bucking specifications) by bucking a number of trees with the app in the beginning.
Study site and operation
The study site was part of the Austrian Federal Forest’s (ÖBf) forest management unit “Wienerwald” and located near Hochstraß (48° 7ʹ 59”N, 15° 59ʹ 45”E) in the province of Lower Austria between 520 m and 570 m asl. It was exposed to the North-East and only moderately (6 to 25%) sloped. A mature stand with an age of 80 to 100 years, dominated by European beech (Fagus sylvatica L.) and interspersed with single individuals of European larch (Larix decidua Mill.), Fir (Abies alba Mill.) and Norway Spruce (Picea abies L.), stocked on a highly productive (yield class 9 to 12) flysch soil. Undergrowth was thickest in the middle and northern part and dominated by European beech (Fagus sylvatica L.) of 0.5 to 2.5 m height. According to a forest inventory, stocking volume was 540 m3 ha−1 OB. At the site, a secondary felling treatment was conducted, and trees were motor-manually felled and processed by three chainsaw operators of ÖBf’s own forest working parties. All trees to be removed and extraction corridors had been marked in advance by an ÖBf forester.
Study preparation
The forest enterprise’s head of harvesting operations provided a definition of permissible assortments according to their contract (), which was identical to the instructions for the chainsaw operators. The definition included the parameters nominal length, diameter class, grade and excess length and price per m3. These were entered into the app’s configuration spreadsheet to create the definition file which was subsequently transferred to the smartphone and assigned to a new operation in the app. In consultation with the head of harvesting operations, sea level height, top diameter and user-specific excess length were set to 535 m, 7 cm OB and 4 cm, respectively.
Table 1. Overview of permissible assortments by grade, nominal length, diameter class and price per m3
Data collection
Tree data
Data collection took place on 23 to 24 October and 18 to 20 November 2019. A chainsaw operator with more than 30 years of experience in motor-manual harvesting operations felled and processed a total of 50 European beech (Fagus sylvatica L.) trees (study part A). To avoid interference with regular work and to ensure work safety, the study was carried out in a remote part of the stand. Trees were felled in batches of three in two different locations, so the chainsaw operator and the researchers could switch between these and maintain a safe distance.
Within a batch, the DBH of each tree was measured with a caliper and a unique identification (ID) was applied to the tree with a red color chalk marker. After the researchers had taken a safe distance, the trees were felled by the chainsaw operator. Subsequently, he visually assessed the grade along the stem, marked grades and grade borders with a red color chalk marker and left for work at the other location. The researchers then measured felling and crown base diameters crosswise with a caliper. Stump height, trunk, crown length, and individual grade section lengths were measured with a forestry tape measure. Diameters were measured OB and rounded off to a full cm, while lengths were measured to the nearest centimeter.
Bucking patterns
Subsequently, the collected data were entered into the app and a value-maximized bucking pattern was derived. For each assortment in the pattern, its mid diameter position was sought out and the diameter was measured crosswise with a caliper. If the position coincided with a knot or branch, diameters below and above were measured and averaged. Further, the estimated topping length was visited, and the diameter was measured crosswise with the caliper. If it deviated from the required limit, the actual topping length was established by measuring diameters in upward or downward direction until they matched the requirement.
Subsequently, the chainsaw operator, who had not been informed about the solution of the app, bucked the trees according to his own ideas. Then the length of each assortment was measured with a tape measure and its mid diameter was measured crosswise with a caliper and readings were recorded along with grade.
Time consumption
The time study took place on 3 March 2020 close to the initial study site. A researcher familiar with the workflow performed all measurements, operated the app and bucking patterns were derived for a total of 30 European beech (Fagus sylvatica L.) trees (study part B). His work progress was recorded with a body-mounted action camera for review in the office.
Data analysis
All data were checked for completeness, consistency, and plausibility before analysis, which was carried out with R statistical software (Citation2018) and Microsoft Excel. A significance level of α=0.05 was used throughout the study.
Taper curve approximation and effect of deviations
For estimating bark thickness, felling and crown base diameters, the same functions that are implemented in the app were used. Bark thickness was subtracted from diameters OB to obtain diameters UB. Significance of deviations of estimation from observation was established through paired t-tests for felling, crown base, log mid, and top diameters, as well as for topping length.
Log volume UB was calculated by multiplying observed mid diameters UB with nominal lengths suggested by the app and volume was multiplied by price per m3 to obtain value per log. If necessary, pricing was updated, for example if a log belonged to a diameter class with a different price. In case the app overestimated topping length, the observed top diameter of the last log was smaller than required. Therefore, the log was considered lost and its value was set to zero. In the opposite case, no action was taken, as already implemented cuts cannot be undone and logs cannot be reassembled or lengthened. Again, paired t-tests were employed to compare estimation and observation of recovered volume and value per log and tree.
Comparison of bucking patterns
The bucking pattern implemented by the chainsaw operator and the bucking pattern suggested by the app, corrected for deviation of estimation from observation (log volume, top diameter compliance and pricing), were compared regarding averages (log volume and value), totals (number of logs, volume, and value per tree) and assortment mix. The t-tests were employed to determine if recovered volume and value differed significantly on a log and tree level.
Time consumption
The action camera recordings were reviewed in the office and time consumption of the main work elements, namely measurements of 1) DBH with a caliper, 2) stump height, 3) trunk, 4) crown 5) grade section lengths with a tape measure, 6) data entry, and 7) delays (recorded separately as mechanical, operational and personnel delays; Magagnotti et al. Citation2013) were recorded with a Algiz 7 handheld tablet computer and a dedicated time study software (RC5 version 1.0). Time consumption was recorded separately for each cycle and along with the tree’s ID. Work elements 1 to 5 could be interrupted by work element 7. Time consumption for grading and marking of grade sections was not considered, as they presented either a standard task (grading), which is carried out log-by-log or for the whole stem, depending on preferences of the operator, or an optional one (marking).
Cycle-wise time study and tree data were joined in a data matrix. Time consumption per cycle was formulated through the application of regression analysis. A pool of potential explanatory variables was established by correlation analysis and ANOVA and included DBH, stump height, trunk, crown, and tree length, crown share (crown length divided by stem length), tree volume OB and the number of grade sections per tree. Moreover, potential interaction effects between these parameters were considered. Efficiency of app operation (minutes productive time excluding delay time per m3 OB; min m−3 OB) was estimated on a cycle level.
Net benefit
Additional time consumption for app operation was estimated with the developed model and transformed into cost by multiplying time by the hourly rate of the chainsaw operator (€27 h−1). Time consumption and cost were established for the 50 trees from study part A and costs per tree were balanced against the difference in value between the bucking pattern of the chainsaw operator and corrected bucking pattern of the app to determine if working with the app yielded a net value gain.
Results
Descriptive statistics
The trees felled and processed in study part A had an average DBH of 35.0 cm (SD=5.6) OB and an average tree height of 32.32 m (SD=1.72) (). Trunk and crown shares were almost equal on average. Two grade sections per tree were the most frequent case, but up to six were observed. “Damage” sections occurred frequently (28 out of 50 trees; 56.0%), but more than one damage section per stem was rare (two cases; 4.0%). Damage sections were on average 2.09 m (SD=1.48) long and in most cases associated with top breaks during felling. Damage in lower parts of the stem were observed in only four cases, and in only one of them in the lowest part (stem rot).
Table 2. Description of the study conditions: Mean, standard deviation, min, max and median of the observed tree parameters
Table 3. Deviation of estimated from observed tree and assortment parameters. Negative prefixes indicate underestimation, positive ones’ overestimation
Taper curve approximation
Felling diameter was underestimated in more than 60% of the cases and estimation deviated significantly from observation (). Contrarily, no significant deviations were observed for crown base and top diameters, top diameter position and tree volume, and cases of exact, under- and overestimation were more balanced. Log mid diameter, however, was significantly overestimated in more than two thirds of the cases. Nevertheless, diameter class was correctly assigned in most cases (234 or 71.8%), but overestimation (66 or 20.2%) was more frequent than underestimation (26 or 8.0%).
Effect of deviations
Log volume was overestimated by 0.02 m3 UB (SD=0.04) () on average. Therefore, total observed volume (59.69 m3 UB) was 5.68 m3 UB or 8.7% smaller than estimated by the app (65.37 m3 UB), which corresponded to a reduction of total value by €186.20 (8.1%) from €2,296.92 to €2,110.71. Incorrect assignment of diameter class affected pricing in only one case: the grade of a log had to be downgraded from a “C” saw log grade to industrial wood grade because the minimum log mid diameter for saw logs was not met; thus, total value decreased further by €8.97 (0.4%). Five top logs had to be discarded as topping length had been overestimated and their top diameters fell short of the minimum, which led to a further reduction of total observed volume (0.08 m3 UB; 0.1%) and value (€2.08 0.1%). In sum, the observed number of logs (321; -1.5%), total volume (5.76 m3 UB; -8.8%) and value (€197.25; -8.6%) were considerably smaller than estimated by the app. In addition, the distribution of number of logs, volume and value shifted marginally toward lower diameter classes, but hardly between grades.
Comparison of bucking patterns
The chainsaw operator bucked the trees into two fewer logs (319) than the app after correction and the average excess length (0.10 m (SD=0.02)) complied with the instructions of the head of operation and the settings of the app. Two logs had to be discarded as they fell short of the minimum nominal length; total observed volume (0.15 m3 UB; -0.3%) and value (€3.87; -0.2%) decreased accordingly (). Though total recovered volume of the chainsaw operator was 1.02 m3 UB (1.7%) smaller than that of the app after correction, his total recovered value exceeded that of the app by €18.33 (0.9%).
Table 4. Comparison of app and chainsaw operator bucking patterns on log, tree, and total level
Total recovered volume and value () did not differ significantly between chainsaw operator and app after correction on log or tree level; nor did utilization of estimated tree volume OB (p=0.109; 79.0%, SD=8.9 vs 81.0%, SD=8.1). However, the volume recovery rate of individual trees could differ markedly, and bucking patterns of the app after correction exceeded that of the chainsaw operator regarding recovered volume and value in 50.0% and 44.0% of the cases, respectively. The extent of advantages and disadvantages was not equally distributed: in the case of the chainsaw operator, 55.6% out of a cumulated advantage of €76.18 were related to just three trees (11%) and a cumulated advantage in recovered volume of 36.6%. Had it not been for these, the total recovered value of the app would have been €24.05 higher than that of the chainsaw operator.
Contrary to the chainsaw operator, the app exploited the whole range of permissible nominal lengths. The former bucked most of the logs into nominal lengths around 4.00 m (73.8% within ±5 cm), especially in case of industrial wood. Cumulated nominal log length was only slightly (3.86 m; 0.3%) longer than in the case of the app.
Saw logs were not significantly (p=0.912) thicker on average, but significantly longer (p=0.017; 3.73 m (SD=1.25) vs 3.25 m (SD=1.03)) in case of the chainsaw operator. Thus, average log volume was significantly larger (p=<0.001; 0.38 m3 UB (SD=0.14) vs 0.32 m3 UB (SD=0.10)), but average value was not (p=0.090). Within saw logs, significant differences were observed for nominal lengths of B (p=0.018) and C (p=0.027) grade logs and for volume (p=0.018) and value (p=0.018) of B grade logs. No such differences were observed for industrial wood.
The bucking patterns of the chainsaw operator contained a slightly larger share of saw log grades in terms of total recovered volume (23.8% vs 21.6%) and value (45.2% vs 42.1%), but not regarding total number of logs (11.7% vs 12.5%), than that of the app.
Time consumption
Trees in study part B did not differ significantly from study part A regarding stump height, DBH and tree volume OB, but were significantly shorter (p=<0.001; 26.19 m (SD=2.47) vs 32.3 m (SD=1.72)). The trees exhibited one (12 or 40.0%) or two (16 or 53.3%) grade sections in most cases; only two trees (6.7%) were divided into a total of three. Therefore, the average number of grade sections (1.7 (SD=0.6)) was significantly smaller (p=0.006) than in study part A. In contrast to the latter, no top breaks or other damage occurred.
The total effective time consumption for working with the app was 104.78 min (100%). Data entry was the most time-consuming work element (36.4% or 38.17 min), followed by measurements of crown (25.1% or 26.35 min) and trunk length (16.9% or 17.68 min). Less time was consumed for measuring grade section lengths (11.6% or 12.13 min), DBH (3.5% or 3.70 min) and stump height (6.4% or 6.75 min). On average, the additional time consumption for working with the app amounted to 3.49 min (SD=0.87) per tree or 2.96 min (SD=1.16) per m3 OB.
ANOVA revealed that tree volume OB and the number of grade sections per tree had a significant effect on efficiency. The model developed (EquationEquation 1(1)
(1) ) explained 85.3% of the variation in efficiency or time consumption per m3, which decreased with increasing average tree volume OB and increased with the number of grade sections. Time consumption was considerably lower in case of only one grade section, as no measurement of grade section length was required. Mean deviation of estimated time consumption from the observed time consumption was 0.00 min m−3 OB (SD=0.43), with median, minimum and maximum deviations of −0.01 min m−3 OB, −1.58 min m−3 OB and 0.94 min m−3 OB. Model coefficients and detailed model statistics are displayed in .
Table 5. Model statistics, parameter estimates and summarized test statistics for the time consumption model
where:
EffApp = efficiency of working with the app, min m−3 OB
VOL = tree volume, m3 OB
NG = indicator variable for number of grade sections per tree.
Net benefit
To determine if working with the app yielded a net benefit, the associated additional time consumption and cost were considered. To this end, the model developed was applied to the trees from study part A. As the model did not cover cases of more than three grade sections, the estimate for three sections was calculated in cases of a larger number of grade sections. It should be noted that time consumption estimates refer to persons proficient in handling the app and that time consumption may be higher in case of less experienced users. The total additional time consumption for working with the app amounted to 186.75 min, equivalent to a cost of €84.04. Accordingly, the total result decreased to €2,015.62 and was therefore exceeded by the result of the chainsaw operator by €102.37 or 5.1%. However, even after accounting for additional cost of working with the app, the result of bucking patterns of the app still exceeded that of the chainsaw operator in 13 (26.0%) cases.
Discussion
The rapid advancement in mobile device hardware in the last decade offers great opportunities for IT-assisted bucking pattern optimization applications for bucking by chainsaw, as low-cost and powerful hardware are more widely available today than ever before. However, to add value to the operation of the user, the bucking pattern provided by the information technology (IT)-solution must exceed or at least match an experienced professional’s choice in terms of volume and value recovery. Thus, the ability to accurately emulate a given tree’s taper curve is a precondition for exact calculation of log volume, accurate pricing, and ultimately to provide a value-maximized bucking pattern. Finally, the additional time consumption required for operation of the IT-solution should be as low as possible and associated costs be balanced by gains in value recovery. To the author’s knowledge, the evaluated T4E Bucking App is currently the only available application for assisting value-maximized bucking by chainsaw on mobile devices in Europe. The main results of the study were that, while tree parameters for taper curve approximation were estimated reasonably accurately on average, estimation and observation of taper curves deviated strongly in many cases, which resulted in corresponding deviation of log mid diameters, log volume and totals of volume and value recovery. Though the totals of recovered volume and value of the app were comparable to that of an experienced chainsaw operator, substantial differences were observed on tree level and working with the app incurred additional costs, that were not balanced by gains in value recovery in most cases.
The estimation of log mid diameter and log volume in the present study was less accurate than in a previous study (Erber Citation2018) in a softwood stand, in which the estimate of the app had been corrected for deviations of volume and value similar to the present study, but deviations were comparatively small (overestimations of 0.29% and 1.15% in total, respectively). Considering that the same approaches had been employed for estimating the parameters defining the taper curve and bark deduction, accuracy of taper curve estimation was markedly lower in the present study. There may be several reasons for that. Firstly, although the crown base diameter was more accurately estimated on average, variation of deviation was considerably larger than in Erber (Citation2018). Due to the central role of the crown base diameter in determing the taper curve, deviation affects the taper curve both in up- and downward directions. In case of the section between DBH and top diameter, the effect is compounded by the fact that most of a tree’s volume and the highest grades and thus the largest share of value is situated in the trunk part. Contrarily, felling and top diameters have only a minor impact on taper curve estimation by default; the former because it affects only the considerably short portion between felling diameter and DBH; for example, the lowest log mid diameter in the current study was located 0.12 m below the measured DBH; thus, the potential for affecting the taper curve was very low; the latter because volume and grades, and thus value, are smaller/lower in the crown. Secondly, irregular stem forms are much more common in hardwoods, which is one of the reasons why bucking of hardwood trees is inherently more complex than bucking of softwoods (Wang et al. Citation2004, Pickens et al. 2006). In the current study, presence of irregular stem forms was indicated by discontinuous taper along the stem length. Strong gradations had been observed for some trees, especially in connection with large branches in the trunk part or forks in the crown. Above these, diameters decreased considerably, an effect responsible for large deviations and already reported by Erber (Citation2018). Thus, although it had been a worthy intention to minimize the number of input parameters from a workload perspective by estimating crown base diameter and interpolation of the taper curve between felling cut, crown base and top, it was detrimental to the accuracy of the taper curve and inclusion of crown base diameter into the pool of input parameters probably would have significantly increased taper curve estimation accuracy. Additional intermediate diameter measurements, wherever taper changes significantly, as required when working with the BUCK software (Olsen et al. Citation1991), could have further limited deviations. Finally, some allowance must be made for the accuracy of manual reference measurements at this point. Even though all diameters were measured crosswise and with utmost care, irregular tree cross-sections and measurement errors may have affected their accuracy.
Considering the substantial deviations between estimated and observed taper curves, the app performed surprisingly well in comparison to an experienced chainsaw operator, at least regarding total recovered volume and value. However, in contrast to other studies (Garland et al. Citation1989; Olsen et al. Citation1997; Bowers et al. Citation1998; Wang et al. Citation2004, Citation2009; Akay et al. Citation2010) bucking pattern optimization did not outperform the chainsaw operator in general; in fact, after correction for all deviations from observation, value recovery of the chainsaw operator was exceeded by that of the app in only about two fifths of the cases. However, it is highly probable that the bucking patterns of the app were not the optimal ones in several cases, because they were based on taper curves that deviated substantially from observation, which may explain the inferior performance of the app, at least partially. Although it is likely that the app would have provided a different, and probably a superior, result, had the taper curve been approximated more accurately, this remains speculation. It must further be considered that the potential of the app had been limited for the sake of processing speed in case of industry wood: while the chainsaw operator was allowed to cut logs of any desired length between two and six meters, the app’s options were restricted to full-meter nominal lengths. However, as the chainsaw operator tended to produce industry wood logs of close to four meters length, in line with the forest enterprise’s policy to focus on full-meter lengths, the overall effect may have been negligible, but it certainly offered him more flexibility in adapting to grade section limits. Finally, the degree of superiority of bucking pattern optimization to a chainsaw operator’s choice strongly depends on the latter’s proficiency and experience. As Wang et al. (Citation2004) pointed out, experienced chainsaw operators can achieve (close-to) optimum bucking patterns. The operator in the present study had more than 30 years of experience in bucking by chainsaw; thus, it was unlikely that he would be outperformed by the app and therefore he was an ideal benchmark for the performance of the app. However, the lack of further, less experienced operators precludes an assessment of the potential for improvement of bucking decisions by the app. Answering this question would require a separate investigation, ideally a controlled study in a professional training setting, similar to Pickens et al. (Citation1993). In this context, the importance of grading skill must be stressed: as pointed out by Olsen et al. (Citation1991), a certain level of competency – at least knowledge about grading rules and recognition of defining features – is required for working with the app and it is therefore recommended to not be used by persons lacking that.
Digitalization offers possibilities to improve accuracy of taper curve approximation and, at the same time, to significantly reduce time consumption for working with the app. Murphy (Citation2008) already demonstrated that taper curves for bucking optimization can be obtained by terrestrial laser scanning (TLS). TLS has become more widely available in recent years and is an integral part of the futuristic concept of the “virtual forest” (Rossmann et al. Citation2010). It has been shown in several studies (Liang et al. Citation2014; Hyyppä et al. Citation2020) that taper curves can be obtained with high accuracy and precision by TLS and the recent introduction of human-carried, personal laser scanners (PLS) has significantly reduced the time required for surveying (Gollob et al. Citation2020). In the case of the T4E Bucking App, manual measurements could be reduced to stump height and grade section lengths in a first step, which would correspond to a reduction of time consumption by about 50% under the conditions of the present study. Taper curves derived from TLS data would certainly match reality much more closely and bucking optimization could be further aided by automated checks for compliance with log top diameter limits and sweep (Pyörälä et al. Citation2019), as well as preliminary grading, supplemented by fine-tuning on site by the user. To increase its utility and to better match contractual obligations, the functionality of the app should be expanded to specification of preferred nominal lengths and consider demand per assortment. Similar to BUCK, different types of cost could be taken into account to optimize contribution margin instead of stem value. Usability of the app could be improved by operating the app on a device with a larger screen (e.g. a small, rugged tablet). Finally, recommended cross-cutting points and additional information may be visualized by a mixed-reality solution integrated into the chainsaw operator’s helmet, as recently demonstrated by Wagner (Citation2019), in the future. This feature could further be supplemented by voice control, thus rendering manual inputs unnecessary.
The current study did not take into account the tree-by-tree and assortment summary statistics provided by the app, which can be considered one of its major benefits, as this information could enhance operation monitoring and controlling, as well as transport management or even be fed back into forest inventory systems. However, as the actual value of this information largely depends on the individual case, it is difficult to monetize.
Conclusion
The evaluated “T4E Bucking App” performed less well in a hardwood than in a softwood stand during a previous study. The implemented approach proved to be less able to emulate the taper curve of beech trees, which resulted in substantial overestimation of log mid diameters. Thus, bucking pattern optimization lacked a reliable basis and recovered value did not exceed that of an experienced chainsaw operator in most of the cases, and in even less after accounting for the cost of working with the app. However, taper curves may soon be obtained more accurately and efficiently via TLS or PLS and the apps usability may be enhanced by other technologies. In its current form, the T4E Bucking App is best suited for use in softwood stands and by users infrequently carrying out harvesting operations or in training and teaching activities, where cost is less relevant. Despite its limitations under the challenging conditions of the present study, the T4E Bucking App has the potential to evolve into a valuable tool for bucking pattern optimization in bucking by chainsaw and represents a first step toward digitalization of motor-manual bucking, which is still in its infancy.
Acknowledgements
The research leading to these results was conducted as part of the TECH4EFFECT project. This project has received funding from the Bio Based Industries Joint Undertaking under the European Union’s Horizon 2020 research and innovation programme under grant agreement No 720757.
The authors would also like to thank the ÖBf for access to their operation and all involved ÖBf personnel for their support of the study during preparation and data collection.
Disclosure Statement
No potential conflict of interest was reported by the authors.
Additional information
Funding
Notes
References
- Acuna MA, Murphy GE. 2005. Optimal bucking of Douglas fir taking into consideration external properties and wood density. N Z J For Sci. 35:139–152.
- Akay AE, Sessions J, Serin H, Pak M, Yenilmez N. 2010. Applying optimum bucking method in producing Taurus Fir (Abies cilicica) logs in Mediterranean region of Turkey. Balt For. 16:273–279.
- Altherr E, Unfried P, Hradetzky J, Hradetzky V. 1974. Statistische Rindenbeziehungen als Hilfsmittel zur Ausformung und Aufmessung unentrindeten Stammholzes: Teil I: Kiefer, Buche, Hainbuche, Esche und Roterle [Statistical bark relations for bucking and measurement of stems in bark: Part I: Pine, European beech, hornbeam, ash and red alder]. Forstliche Versuchs- und Forschungsanstalt Baden-Württemberg, Freiburg im Breisgau (Germany): Mitteilungen d. FVA. 61:137.
- Altherr E, Unfried P, Hradetzky J, Hradetzky V. 1975. Statistische Rindenbeziehungen als Hilfsmittel zur Ausformung und Aufmessung unentrindeten Stammholzes: Teil II: Europäische Lärche, Japanische Lärche, Schwarzkiefer, Stieleiche, Traubeneiche, Roteiche, Bergahorn und Linde [Statistical bark relations for bucking and measurement of stems in bark: Part II: European larch, Japanese Larch, Austrian pine, penduculate oak, sessile oak, northern red oak, sycamore maple and lime]. Forstliche Versuchs- und Forschungsanstalt Baden-Württemberg, Freiburg im Breisgau (Germany): Mitteilungen d. FVA.68:201.
- Altherr E, Unfried P, Hradetzky J, Hradetzky V. 1978. Statistische Rindenbeziehungen als Hilfsmittel zur Ausformung und Aufmessung unentrindeten Stammholzes: Teil IV: Fichte, Tanne, Douglasie und Sitka-Fichte [Statistical bark relations for bucking and measurement of stems in bark: Part IV: Norway spruce, Fir, Douglas fir, Sitka spruce]. Forstliche Versuchs- und Forschungsanstalt Baden-Württemberg, Freiburg im Breisgau (Germany): Mitteilungen d. FVA. 90:294.
- Berendt F, Fortin M, Jaeger D, Schweier J. 2017. How climate change will affect forest composition and forest operations in Baden-Württemberg-A GIS-based case study approach. FORESTS. 8:298.
- Bont L 2005. Kundenorientierte Optimierung der Sortiments-Aushaltung bei der Holzernte [Customer-oriented bucking optimization in timber harvesting]. master’s thesis. Zürich (Switzerland): Swiss Federal Institute of Technology.
- Bowers S. 1998. Increased value through optimal bucking. West J Appl For. 13:85–89.
- Briggs DG 1989. Tree Value System: descriptions and assumptions. General technical Report PNW-GTR-239. Portland (OR (U.S.A)): USDA Forest Service, Pacific Northwest Research Station, p. 24.
- Eckmüllner O, Schedl P, Sterba H. 2007. Neue Schaftkurven für die Hauptbaumarten Österreichs und deren Ausformung in marktkonforme Sortimente. Austrian J For Sci. 124:215–236.
- Eng G, Whyte AGD 23-24th August 1982. Optimal tree bucking. Operational research society of New Zealand: Proceedings of 18th annual ORSNZ conference, Canterbury, New Zealand, 91–98.
- Eng H, Daellenbach HG. 1985. Technical note - forest outturn optimization by Dantzig-Wolfe decomposition and dynamic programming column generation. OPER RES. 33:459–464.
- Erber G 24-28 September 2018. First accuracy test of a novel mobile device based application for value-optimized bucking in motor-manual harvesting operations. Proceedings of the 51st International Symposium on Forestry Mechanization: “Improved Forest Mechanisation: Mobilizing natural resources and preventing wildfires”, Madrid, Spain, 112–123.
- Erber G, Viertbauer M, Schildberger V 2019. T4E Bucking App - A mobile device based application for value-optimized motor-manual bucking - manual, version 1.3, Sep 2019. [accessed 2020 Sep 29]. http://www.tech4effect.eu/wp-content/uploads/2019/11/manual-english-v13-201909.pdf
- Faaland B, Briggs D. 1984. Log bucking and lumber manufacturing using dynamic programming. Manage Sci. 30:245–257.
- Garland J, Sessions J, Olsen ED. 1989. Manufacturing logs with computer-aided bucking at the stump. For Pro J. 39:63–66.
- Geerts JM, Twaddle AA. 1984. A method to assess log value loss caused by crosscutting practice on the skidsite. N Z J For. 29:173–184.
- Gollob C, Ritter T, Nothdurft A. 2020. Forest inventory with long range and high-speed personal laser scanning (PLS) and simultaneous localization and mapping (SLAM) technology. Remote Sens. 12: 1509.
- Grondin F. 1998. Improvements of the dynamic programming algorithm for tree bucking. Wood Fiber Sci. 30:91–104.
- Hyyppä E, Kukko A, Kaijaluoto R, White J, Wulder M, Pyörälä J, Liang X, Yu X, Wang Y, Kaartinen H, et al. 2020. Accurate derivation of stem curve and volume using backpack mobile laser scanning. ISPRS J Photogramm Remote Sens. 161:246–262.
- Kivinen V-P 2007. Design and testing of stand-specific bucking instructions for use on modern cut-to-length harvesters. doctoral thesis. Helsinki (Finland): University of Helsinki.
- Labelle ER, Bergen M, Windisch J. 2017. The effect of quality bucking and automatic bucking on harvesting productivity and product recovery in a pine-dominated stand. Eur J FOR RES. 136:639–652.
- Laroze AJ. 1999. A linear programming, Tabu Search method for solving forest-level bucking optimization problems. FOR SCI 45: 108-116.
- Laroze AJ, Greber BJ. 1997. Using Tabu Search to generate stand-level, rule-based bucking patterns. For Sci. 43:157–169.
- Liang X, Kankare V, Yu X, Hyyppä J, Holopainen M. 2014. Automated stem curve measurement using terrestrial laser scanning. IEEE Trans Geosci Remote Sens. 52:1739–1748.
- Magagnotti N, Kanzian C, Schulmeyer F, Spinelli R. 2013. A new guide for work studies in forestry. Int J for Eng. 24:249–253.
- Mendoza GA, Bare BB. 1986. A two-stage decision model for log bucking and allocation. For Pro J. 36:70–74.
- Murphy G 1987 . An economic analysis of final log manufacturing locations in the steep terrain Radiata pine plantations of New Zealand. Doctoral thesis. Corvallis (OR (U.S.A.)): Oregon State University,
- Murphy G. 2008. Determining stand value and log product yields using terrestrial lidar and optimal bucking: a case study. J For. 106:317–324.
- Näsberg M 1985. Mathematical programming models for optimal log bucking. Doctoral thesis. Linköping (Sweden): Linköping University.
- Olsen E, Stringham B, Pilkerton S. 1997. Optimal bucking: two trials with commercial OSU BUCK software. Foresty Research Lab, Oregon State University, Corvallis (OR, U.S.A). Res Contrib. 16:32.
- Olsen ED, Pilkerton S, Garland J, Sessions J. 1991. Questions about optimal bucking. Forestry Research Lab, Oregon State University, Corvallis (OR, U.S.A). Res Bull. 71:18.
- Pickens J, Throop SA, Frendewey J. 1997. Choosing prices to optimally buck hardwood logs with multiple log-length demand restrictions. For Sci. 43:403–413.
- Pickens JB, Lyon GW, Lee A, Frayer WE. 1993. HW-BUCK: a computer game for improving hardwood log bucking skills. J For. 91:42–45.
- Pnevmaticos SM, Mann SH. 1972. Dynamic programming in tree bucking. For Prod J. 22:26–30.
- Puumalainen J. 1998. Optimal cross‐cutting and sensitivity analysis for various log dimension constraints by using dynamic programming approach. Scand J For Res. 13:74–82.
- Pyörälä J, Kankare V, Liang X, Saarinen N, Rikala J, Kivinen V, Sipi M, Holopainen M, Hyyppä J, Vastaranta M. 2019. Assessing log geometry and wood quality in standing timber using terrestrial laser-scanning point clouds. Forestry. 92:177–187.
- R Core Team. Sep 30 2018. R: a language and environment for statistical computing. Vienna (Austria): R Foundation for Statistical Computing. [accessed 2020]. https://www.R-project.org/.
- Rossmann J, Schluse M, Schlette C. 2010. The virtual forest: robotics and simulation technology as the basis for new approaches to the biological and the technical production in the forest. Syst Cybernet Inform. 43–48.
- Sessions J, Garland J, Olsen ED. 1989. Testing computer-aided bucking at the stump. J For. 82:43–46.
- Sessions J, Layton R, Guangda L. 1988. Improving tree bucking decisions: a network approach. The Compiler. 6:5–9.
- Smith J, Harrell G. 1961. Linear programming in log production. For Prod J. 11:8–11.
- TECH4EFFECT. 2020. Policy brief. [accessed 2020 Sep 29]. http://www.tech4effect.eu/wp-content/uploads/2020/09/policy-brief-web.pdf.
- Waddell DA 1982. A practical system for determining optimal tree bucking at the stump. Master’s thesis. Vancouver (Canada): University of Canterbury.
- Wagner T. 2019. Industrie 4.0 für den Cluster Wald und Holz – umsetzung zukunftweisender Innovationen im Kompetenzzentrum Wald und Holz 4.0 [Industry 4.0 for the Forest and Wood Cluster - Implementation of trend-setting innovations in the Forest and Wood Competence Center 4.0]. Lehr- und Versuchsforstamt Arnsberger Wald (Arnsberg (Germany)): Leistungsbericht. 71–75. 2018.
- Wang J, LeDoux C, Mcneel J. 2004. Optimal tree-stem bucking of Northeastern species of China. For Prod J. 54:45–52.
- Wang J, Liu J, LeDoux CB. 2009. A three-dimensional bucking system for optimal bucking of Central Appalachian hardwoods. Int J For Eng. 20:26–35.
- Wiener Börse AG. 2006. Österreichische Holzhandelsusancen 2006 [Austrian Timber Trade Guidelines 2006]. Vienna (Austria): Wiener Börse AG; p. 271.