
 ?Mathematical formulae have been encoded as MathML and are displayed in this HTML version using MathJax in order to improve their display. Uncheck the box to turn MathJax off. This feature requires Javascript. Click on a formula to zoom.
ABSTRACT
The mechanization of roundwood harvesting in Sweden has historically cut costs rapidly. However, machinery and work methods have conceptually stayed the same since the introduction of the single-grip harvester. Current trends indicate that the next major wave of development will be based on automation, and that teleoperation is a step in this direction. This study aims to evaluate the economic potential of semi-automated tele-extraction compared to standard forwarding within the Nordic CTL two-machine harvesting system. The initial scenario examined autonomous terrain transportation with teleoperation during loading and unloading. A Discrete Event Simulation was implemented in the AnyLogic software. Input data included 1100 Swedish harvest sites, with in total 1.6 million m3 and extraction distances from 20 to 1500 m. Scenarios with different numbers of teleoperators for a fleet of ten forwarders were tested. The optimum number of operators was seven per ten forwarders, resulting in a potential extraction cost reduction of 7% compared to standard forwarding. Extraction distances further than 500 m enabled use of five or six teleoperators, resulting in potential cost reductions of up to 15%. The highest potential cost reductions were linked to increased time used for autonomous driving, increasing the teleoperator availability for other machines. The simulation model provides a framework for further evaluation of new scenarios of automation and teleoperation of forwarders.
Introduction
Sweden’s annual harvest ranged between 63.6 and 68.5 million solid cubic meters under bark (m3 sub) of industrial roundwood from 2010 to 2019 (FAO Citation2014, Citation2019). These volumes were harvested primarily using the cut-to-length (CTL) method (Lundbäck et al. Citation2021) with the harvester-forwarder system. Over the same period, the growing stock in Sweden increased by 11% (FAO Citation2020). The Nordic harvester-forwarder system is technologically mature. This implies that efforts to cut costs within the present system have not been yielding substantial cost reductions in later years. Historically, mechanization has been progressive, with a gradual mechanization of more work elements with increased speed producing higher annual volumes (Nordfjell et al. Citation2019). This progress has been reflected by the dramatic cost reductions during the initial years of mechanization in Sweden. Many of the latest developments in operator support systems can also be utilized to automate work elements (Lindroos et al. Citation2019), with the potential for further improvements in overall cost-efficiency by reducing operator time per load. These future improvements may be less driven by the classical mechanization driver of generally increasing wage costs (Lindroos et al. Citation2019), and more related to the rising difficulty of recruiting operators to the forest sector as opposed to other sectors, such as construction and mining.
If one assumes that productivity will remain stable for the current harvester-forwarder system, alternative approaches to cost reduction include removing major cost components or even allowing lower productivity when offset by fewer cost components. These approaches may be enabled by an increasing degree of automation.
Extraction with forwarders
Forwarding has been well researched throughout its lifetime, as shown in the extensive review by Manner (Citation2015). In the Nordic and Baltic countries, forwarding is preferred over skidding for a number of reasons such as higher handling and energy efficiency for the supply chain as a whole, and reduced soil contamination before industrial processing (Santos Citation2015). There are also many time studies of forwarding in different conditions (c.f. Bergstrand Citation1985; Brunberg Citation2004; Tiernan et al. Citation2004; Nurminen et al. Citation2006; Väätäinen et al. Citation2006a; Strandgard and Mitchell Citation2015). Over recent years, information from on-board computers have enabled large-scale data gathering and automated identification of work elements (Palander et al. Citation2012; Eriksson and Lindroos Citation2014; Manner et al. Citation2016) which, in turn, have enabled high-resolution, long-duration time studies of harvester and forwarder operations. Based on a combination of such statistics and work element-specific time consumption functions, the productivity and terminal time (time for loading and unloading (Sundberg, Citation1988)) can be calculated. In general, the earlier studies have shown that the principal factors for increased forwarder productivity are increased harvested volume per area unit and reduced extraction distance.
Increases in production cost is one of the triggers of technological innovation (Lindroos et al. Citation2017). The cost of forwarding can be divided into three main components: fixed machine cost, variable machine cost and operator cost (Ackerman et al. Citation2014a). For fixed annual machine costs, such as capital and insurance, the fixed cost per hour is directly dependent on the annual working hours. With increasing annual utilization, the hourly costs decrease with a corresponding reduction of fixed hourly costs. In contrast, the hourly variable cost is generally considered to be independent of annual utilization, subject to variations in exogenous factors such as fuel price. For an approach seeking lower unit costs for forwarding through a new relationship between hourly productivity and costs (e.g. reduced hourly costs allowing lower hourly productivity), it is the operator cost that represents the largest potential since reductions in hourly machine cost in the near future seem to be small.
Historically, increasing labor costs were a main driver for mechanization (Lindroos et al. Citation2017). Operator costs currently constitute 35–38% of the forwarding cost for large forwarders in northern Sweden (Bylund Citation2020). In light of a growth-based economy and current operator salaries in Sweden, reducing operator hours per machine hour is the only plausible measure to further reduce the operator cost per machine.
Teleoperation and automation
The term teleoperation is commonly used for machines that are operated by remote control. In this paper, the concept of semi-automated tele-extraction is defined as autonomous driving/navigation (with and without load) and teleoperation of terminal activities (loading, unloading, and driving while loading and unloading). Teleoperation generally refers to long-distance remote control although, remote control alternatives may range from on-site visual execution to off-site digital execution over unlimited distances.
In general, the pursuit of reduced costs by automation of industrial manufacturing is a common example of reducing operator hours per machine hours. However, the forest is one of the most challenging environments for autonomous vehicles to negotiate (Lindroos et al. Citation2019), and there remains much research and development to be carried out before full autonomous operation is achieved. To bridge this gap, there are a number of alternatives including automation of the simplest work elements and teleoperation of the more complicated elements. Development and improvement of teleoperation and automation of forwarders is ongoing in Sweden (c.f. Ortiz Morales et al. Citation2014; Persson Citation2020). Among developers, the mainstream reasoning is that the technological feasibility for automation of driving/navigation is higher than for crane work (Visser and Obi Citation2021), and that crane work is therefore better suited for teleoperation (Lindroos et al. Citation2019; Visser and Obi Citation2021).
There are other reasons than improvements in cost and productivity that motivate the move toward teleoperation and automation. Despite the development of shock absorption solutions, the operator work environment is still subject to considerable whole-body vibrations as well as exposure to cold temperatures, snow, rain, and darkness (Häggström and Lindroos Citation2016). An office-standard workstation for remote control would avoid such exposure and present a more convenient workplace for a wider range of operators. Time-consuming travel to and from the harvesting sites, as well as the isolated nature of today’s work is likely to restrict the potential workforce of the future. The work environment issues are not only relevant to forwarding but to most forest operations, and the sector should address these issues in a proactive way.
Forest machine manufacturers and researchers are not on the frontline of automation. Teleoperation and automation of heavy vehicles has been under development for decades in other sectors, such as the mining industry. In northern Sweden, the development of automation of load-haul-dump vehicles has been ongoing since the 1980s (Andersson Citation2013) with effort required for better automation or semi-automation of, for example, loading (Dadhich et al. Citation2016). Experiences from the mining sector show that the interface for a teleoperator must be more advanced than a simple video feed in order to maintain productivity, with a higher degree of automation or assistance being required for certain work elements (Andersson Citation2013). According to a case study in the mining industry, there is little difference in downtime between automated and manual loading operations, and automated work may even enable slightly shorter downtimes (Marklund Citation2017). In rough environments, difficulties in developing basic feedback and feedforward processes typical for the autonomous control systems used in manufacturing have motivated exploration into the field of artificial intelligence and machine learning in order to copy the behavior of expert operators (Dadhich et al. Citation2019). Forest terrain presents a challenge for autonomous vehicles (Lindroos et al. Citation2019), but solutions for some subproblems within the mining industry are likely to be useful within forestry. The Swedish forest industry has already implemented teleoperation for the control of the crane of a timber truck from the driving cab using virtual reality goggles, avoiding the necessity of climbing up and down to the crane cab and enabling higher load weights as the crane cab can be removed (HIAB, Citation2021).
The system analysis approach and discrete event simulation
The use of system analysis in both research and real-world environments, including the use of simulation and operations research, provides early insight into new systems that can guide manufacturing and implementation (c.f. Asikainen Citation1995; Olsson and Sjöstedt Citation2004; Lindroos Citation2012). If a model can mimic a specific bounded real system in a robust way, it is possible to assess the effects of different kinds of manipulation of the system without carrying out expensive or hazardous physical experiments (Banks et al. Citation2005).
Discrete Event Simulation (DES) has been used for a long time for simulations of manufacturing, warehousing, and transport and logistics (Diaz and Behr Citation2010). In forest operations, an early application was by Johnson and Fisher (Citation1978), who simulated different harvesting systems for forest residue recovery. Since then, DES have been applied to a wide variety of research questions within forest operations, (c.f. Asikainen Citation1995, Citation2010; Väätäinen et al. Citation2006b; Puodziunas and Fjeld Citation2008; Ringdahl et al. Citation2012; Zhang et al. Citation2012; Berg et al. Citation2014; Eriksson Citation2016; Fernandez-Lacruz et al. Citation2020; Kons et al. Citation2020). According to these studies, the main advantages of using DES include:
The ability to analyze waiting times and interactions within a system consisting of subparts that rely on each other, for example, a harvesting system consisting of a number of machines or a single machine performing a number of tasks.
The inclusion of stochastic elements to mimic the variation in real systems, for example, weather events or machine breakdowns. Specifically, the use of probability density functions to represent real data is central in DES.
The potential for using sensitivity analyses to identify system bottlenecks.
The aim of this study was to evaluate the economic potential of semi-automated tele-extraction compared to standard extraction within the Nordic CTL two-machine harvesting system. The study had two goals. The first is an overall economic evaluation of the tele-extraction concept. The second was to identify the factors that had the greatest potential effect on cost reduction for various future scenarios.
Since the aim of the study was to compare two different systems for extraction of logs, both starting with harvested logs on the ground, the study was restricted to the forwarding operation alone, regardless of interactions with the harvester.
Materials and methods
The study uses a DES approach for analysis of the tele-extraction concept. The simulation model compares extraction using a standard forwarder with a range of semi-automated tele-extraction configurations. Each system was compared for a defined set of forest stands, with specific time consumption functions per work element for the respective stand conditions.
Stand data
The stand dataset consists of 1,343 stands from final felling, collected by forest companies in three regions of Sweden: Northern (Norrbotten, approximately 66°N, 22°E), Middle (Medelpad, approximately 62°N, 16°E), and Southern (Östergötland-Sörmland, approximately 58°N, 16°E). The data contained information on harvested volume, per stand and per ha, as well as average stem volume and extraction distance. The volumes had been measured after harvesting as solid m3 under bark including stems down to 5 cm in diameter and the extraction distances were approximated before harvest. To stay within the boundaries of the applied time consumption functions, only stands with a harvested volume of between 100 and 1,000 m3/ha were used (). The same dataset was used by Lindroos (Citation2012), for in-depth knowledge of the implications of the filtering see Lindroos (Citation2012).
Table 1. Summary statistics of the forest stands in three Swedish regions (Lindroos Citation2012) used in this study. Averages with Std. Dev. in parentheses.
Machine operations
The forwarding work was divided into five main work elements with their own respective calculated time consumption. To model downtime, a function for interruptions was applied. Downtime could occur during any of the main work elements but was recorded separately. The main work elements were:
Driving empty
Loading (including simultaneous driving and crane work, included in terminal time)
Driving while loading (driving between log piles, included in terminal time)
Driving loaded
Unloading (including driving while unloading, included in terminal time)
There is no overlap between these main work elements, and they follow the sequence above with the exception that driving while loading and loading occur interchangeably.
Time consumption
Time consumption was the base for deriving cost and productivity for the respective systems. Since the simulations ran time consumption functions based on time per load, productivity was calculated as time per load divided by load size. It was assumed that most large forwarders (20 ton load capacity) working in Swedish clearcuts are equipped with expandable load spaces, enabling utilization of the full load weight capacity, also assuming that 20 tonnes correspond to 22 m3. Hence, the load size was standardized and set to 22 m3 to correspond to the heaviest forwarders in Scandinavia e.g. John Deere 1910 and Komatsu 895. The time consumption functions applied for forwarding were from Nurminen et al. (Citation2006) as later used and described by Lindroos (Citation2012), and with driving speeds based on data from Manner et al. (Citation2016). The unloading time was set directly using a probability density function (PDF) corresponding to the average and range of unloading time consumption from Manner et al. (Citation2016).
Two other modifications were made to adapt the use of the time consumption functions of Nurminen et al. (Citation2006) in the simulation to the available stand data. First, the simulation model did not include different assortments. Instead, all wood was treated as a single assortment of sawlogs. Second, driving distances were calculated from stand information using average extraction distance (one way), harvested volume and an extraction trail spacing of 13 m. The distances for driving empty and loaded were set as equal (EquationEquation 1(1)
(1) ).
where de is the distance driven empty (m), df is distance driven fully loaded (m), dm is the average one way extraction distance as estimated before harvest and thus included in the input data (m), and d1 is the distance driven during loading (m, EquationEquation 2)(2)
(2) . In the original functions by Nurminen et al. (Citation2006), separate specific distances were used for driving empty and driving loaded. d1 is dependent on the forwarder payload volume (p, m3) and the timber density along extraction trails (z, m3/100 m) according to EquationEquation 2
(2)
(2) , and z is dependent on the volume per hectare (v) of the assortment being loaded (here equivalent to the total volume since only one assortment is used), and the extraction trail spacing (s) according to EquationEquation 3
(3)
(3) .
As an example, harvested volume per 100 meters of extraction trail (z) was on average 25 m3/100 m for the northern region and the extraction trail spacing of 13 meters result in 770 meters of extraction trail per hectare.
To model different distances for different loads within the same stand, a PDF with a negative exponential distribution was used (), based on the extraction distance derived from the stand input data. Similar PDFs, with parameters from several stands in Manner et al. (Citation2019) were visualized within AnyLogic to confirm that an exponential PDF was typical for similar situations and a suitable choice. The exponential PDF for driving empty and driving loaded distances was implemented with a shift parameter of 1 and a scale parameter corresponding to the calculated distance for driving empty or loaded, respectively (). The PDF was truncated with maximum and minimum distances corresponding to the calculated driving distance +- half the side of a square shape with similar area as the stand in question (). The minimum was also set to always be at least zero to avoid negative distances, which mathematically can occur in the case of a short extraction distance and low harvested volume. The maximum was set to always be greater than 1.5 m (instead of one or zero) to avoid the function to turn into a uniform distribution.
Table 2. Application of probability density functions and their parameters in the simulations.
The times required for the driving work elements were derived from their driving distances, and PDF’s of driving speeds per work element was used. The summary statistics on speeds provided by Manner et al. (Citation2016) were used to estimate the PDF’s. The speed for each load was picked from a normal distribution with an average value similar to that presented in Manner et al. (Citation2016), and maximum and minimum values 20% above the 95th and below the 5th percentiles in the range, see . To avoid practically unfeasible scenarios, such as extremely slow speeds on very long distances, maximum times for driving empty and driving loaded were limited to 90 minutes and 106 minutes, respectively.
The time for loading was calculated for each load based on the standing volume, using functions from Nurminen et al. (Citation2006), and assuming one sawlog assortment (EquationEquation 4(4)
(4) ).
where tl is the time consumption for loading (min/m3) and vs is the wood volume at the loading stop (m3). Since only clearcuts are considered, vs is calculated based on z from EquationEquation 3(3)
(3) according to EquationEquation 5
(5)
(5) .
Downtime functions included both the occurrence and duration of downtime, and were derived from detailed follow-up data on 31 forwarders working in the “North” and “Middle” geographic areas provided by the SCA forest company. The follow-up data originated from one year of operations between June 2019 and May 2020. Forwarders with less than 100 productive machine hours (PMH) were omitted, leaving 22 machines providing data. Time recorded as downtime included maintenance, repairs, and interruptions such as telephone calls, recoveries, waiting for relocation, demonstration to visitors etc. Scheduled breaks/meals and relocations were not included in downtime. The average downtime in the simulation was compared and calibrated using the follow-up data for machine utilization rates. This was possible since the follow-up data, apart from downtime, also included PMH. The average utilization rate in the follow-up data was 86%. The PDF for downtime occurrence was derived and set to a negative exponential function with a shift parameter of 0, a scale parameter of 68, and truncation at 0 and 1 000 minutes (). The PDF for the length of each downtime was also derived and set to a negative exponential function, but with shift 0, scale 10, and truncation at 0 and 450 minutes ().
Cost estimation
Forwarding cost estimates were divided in three categories: fixed machine costs, variable machine costs, and operator costs ().
Table 3. Forwarding cost estimates for a large forwarder (19–20 tonnes load capacity) (Bylund Citation2020).
Model building and simulation
AnyLogic 8 University (8.7.2) simulation software was used for the DES modeling in this study. In principle, the forwarder is represented as a sequence of blocks representing the main work elements (). Operators are available for the forwarder in a separate operator pool and, in the tele-extraction simulations, teleoperators are only needed for selected work elements ().
Figure 1. Top level illustration of the sequence of work elements for the forwarding operation. Downtime could occur during any of the work elements but was recorded separately.

Figure 2. Flowchart for the model logic for seizing and releasing operators at different work elements during one load. The sequence starts over for every load cycle.
In DES, the item of interest passing through a system is called an entity. In this study, the entity was the equivalent of a full load of logs, that is, 22 m3. The time consumptions for the main work elements described above were measured as the load passed through the work elements and at the end of the load cycle the measured time consumptions and downtime were added together into the total time consumption for the load. Driving speeds and other stochastic variables were either incorporated in the time consumption functions directly, or handled as external parameters, depending on the need for rapid adjustments between scenarios.
In AnyLogic, entities are generated from one or more source blocks. For this study, the information about the log loads and their specific time for arrival in the model was extracted from a spreadsheet database. There was one spreadsheet for each region and forwarder, so to change from one region to another, the spreadsheet databases were changed for all forwarders. Apart from the source (start), time consumption (work elements), and sink (end) blocks, time consumption and cost were recorded for each work element and accumulated for all loads in the simulation. At the end of the simulation, the resulting cost and time datasets were automatically reported in new spreadsheets. The raw output data in the spreadsheets were subsequently compiled and visualized within an automated routine using the statistical software R, version 4.0.2 (R Core Team Citation2018) and the ggplot2 library (Wickham Citation2016).
To model the tele-extraction system, the initial forwarding model was cloned ten times to create a model with ten forwarders and a flexible number of operators. The main structural difference from the simpler forwarding model was that teleoperators were occupied only for the loading and unloading work elements. The size of the operator pool, that is, the total number of teleoperators for the ten forwarders, was altered between simulation runs (five to ten teleoperators for ten forwarders). In the first comparison of standard forwarding and tele-extraction, all parameters, such as costs, time consumption for work elements, downtime etc., were held constant at the level corresponding to standard forwarding. Thereafter, the extraction distance of each inputted forest stand was changed according to a relative parameter, simulating longer and shorter extraction distances while keeping the full range of input data.
The forest stands for each geographic area were replicated to provide ten sets with random ordering, one set per forwarder. This was done before any simulations were carried out in order to provide all ten forwarders with all the data material but avoid covariation in time consumption between the forwarders. Simulations both with and without replicated simulation runs were carried out and the results were compared.
Results
The baseline simulation of the standard forwarding with one operator in each forwarder provided an average speed for driving empty of 3.4 km/h, driving loaded 2.9 km/h and driving while loading 2.2 km/h with realistic, normally distributed ranges based on the underlying statistics (, Manner et al. Citation2016). The ranges in speeds was an indirect way to represent different terrain difficulties for each load in the simulations. The average time consumption per load including downtime was 42 minutes with the majority of the time spent on loading (17.9 minutes) and unloading (8.5 minutes) (). Downtime was on average 4.2 minutes per load, ranging from 0 to 128 minutes.
Figure 3. Distribution, median, and quantiles of speed while driving empty, speed driving during loading, and speed while driving loaded for the simulation of standard forwarding operations (one operator per forwarder). Northern region.
Figure 4. Distribution, median, and quantiles of time consumption for driving empty, loading (including driving while loading), driving loaded, unloading, and total time including downtime for the simulation of standard forwarding operations (one operator per forwarder). Northern region.
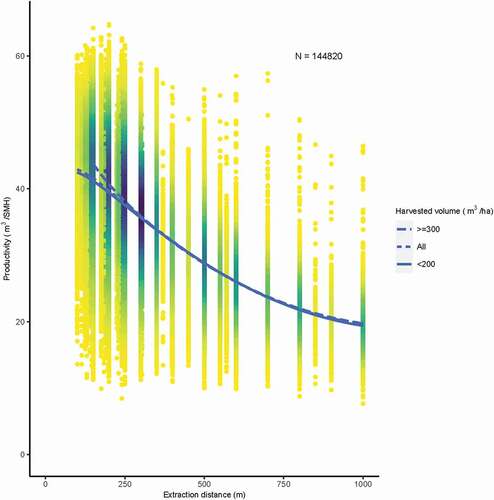
The proportion of terminal time (i.e. loading, driving while loading, and unloading) decreased as the total time per load increased with increasing extraction distance (). The simulations show a negative exponential relationship between the proportion of terminal time and increasing extraction distance, with a downward shift for higher stand densities (). Productivity follows the negative exponential curve for reduced productivity with longer extraction distances and lower stand densities ().
Figure 5. The terminal time proportion of total time (loading, driving while loading, and unloading) at different extraction distances and harvested volumes for the simulation of standard forwarding. Northern region. Darker color indicate higher density of observations (forwarder loads).
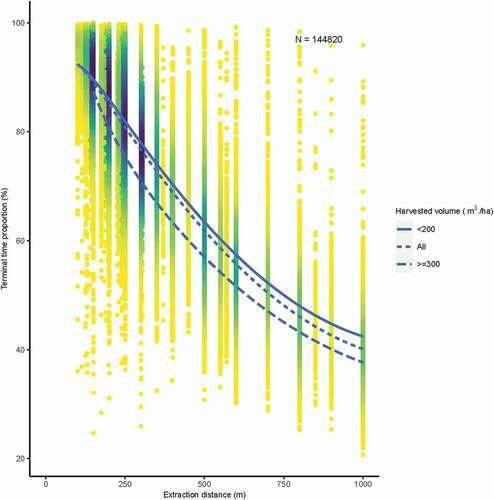
Figure 6. Productivity (SMH) at different extraction distances and harvested volumes for the simulation of standard forwarding. Northern region. Darker color indicate higher density of observations (forwarder loads).
For tele-extraction with fewer operators than machines, the effect on machine utilization is marginal for nine tele-operators on ten machines but increases as the number goes down to e.g. seven and six teleoperators ().
Figure 7. The effect of the number of teleoperators with ten forwarders on machine and operator pool utilization rates. Northern region.
The operator pool utilization varied considerably with extraction distances. Increased extraction distances led to increased autonomous driving time with reduced proportions of waiting times and terminal times of forwarders (), and thereby with reduced operator utilization. The proportion of terminal time fell from 50–75% per load at 250 m to 35–45% at 1000 m, with the ranges depending on the number of teleoperators. Forwarder waiting time fell from 0–30% at 250 m to 0–20% at 1000 m. As noted earlier, the effects of the reduced number of teleoperators were most dramatic below seven teleoperators per ten forwarders; however, the forwarder waiting time for five teleoperators (two forwarders per teleoperator) was reduced by approximately 33% when working at these longer extraction distances.
Figure 8. The effect of extraction distance (x-axis) on the proportions of total time for terminal activities (a) and forwarder waiting time (b). Northern region. The results relate to all stands in the northern region with standard system parameters.
The average forwarder productivity decreased as the number of teleoperators in the simulation was reduced (). The simulated forwarding costs decreased initially with decreasing number of teleoperators. Using standard assumptions, the cost reduction flattened out at a level of 0.7 or 0.6 teleoperators per forwarder depending on region, increasing thereafter ( and ).
Table 4. Productivity and costs for Tele-extraction with indicated numbers of operators per machine, ranging from full teleoperation/standard forwarding with one designated operator for each machine to one operator for all ten machines (0.1 per machine). Lowest costs are indicated with bold numbers. IQR is the Interquartile Range.
Figure 9. The average simulated forwarding costs per load (USD/m3 solid under bark) with varying number of teleoperators per ten forwarders for three different regions.
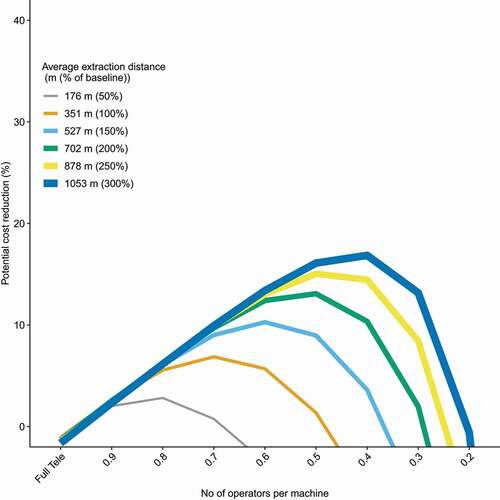
Further analysis of the respective cost categories gave some additional insight into the effect of machine and operator utilization rates on economic efficiency (). The forwarding cost per cubic meter initially decreases as the number of teleoperators decreases, with a lower number of operator wages to pay, but the trend is reversed as machine waiting time increases and productivity becomes too low in relation to the fixed costs of the machines (). Below seven teleoperators per ten forwarders in the northern region, the reduction of per unit operator cost flattens out and cannot compensate for the increasing per unit fixed costs (). The relative cost for tele-extraction decreases with increasing extraction distances since the proportion of terminal time decreases, making it possible to maintain productivity with fewer operators (). The potential cost reductions compared to standard forwarding were estimated to exceed 15% with five teleoperators per ten forwarders when extraction distances exceeded 500 m.
Figure 10. Average simulated forwarder cost (USD/m3 solid under bark) per cost category with varying number of teleoperators per ten machines. Northern region.
Figure 11. Simulated potential cost reductions for tele-extraction compared to standard forwarding, north region, with varying number of tele-operators per machine (x-axis) and relatively adjusted extraction distances. Each data point in the figure represents a separate simulation run including about 150000 forwarder loads.
Discussion
The simulation study showed that semi-automated tele-extraction for forwarding of roundwood has a theoretical potential of being more cost-effective than the standard forwarding system when terminal activities were tele-operated, i.e. loading and unloading. The simulation model developed during this study constitutes a useful framework for sensitivity analysis and study of alternative scenarios for further development of tele-extraction. Teleoperation and automation of forestry machines have been previously studied from various points of view (c.f. Ringdahl et al. Citation2011; Milne et al. Citation2013; Westerberg and Shiriaev Citation2013; Lindroos et al. Citation2019; Persson Citation2020). The conceptual scenarios for future teleoperation and semi-automation explored in Westerberg and Shiriaev (Citation2013) points out the first steps in testing physical prototypes. The concept of tele-extraction in forestry is, however, still novel and few studies exist on the topic. The concept addresses a number of challenges present within today’s forest operations with cost reduction being the most obvious. Other potential advantages with long-distance teleoperation include the increased possibility of attracting and retaining competent operators by offering a high standard of workplace with respect to ergonomics, social interaction, reduced commuting, and greater flexibility to combine work and family life. However, the change in workplace, tasks, and task allocation will inevitably introduce unforeseen effects on both the work and the workers (Häggström and Lindroos Citation2016). The tele-extraction concept surely poses a potential risk of losing the group of operators who appreciate the outdoor parts of the work, should the operators move to an office.
Further development toward automation of forest operations depends on many factors, such as the pace of the technological development toward autonomous driving (Lindroos et al. Citation2017). Safety is a concern in most industries and the inherent risk of having personnel underground within mining operations has driven the development of teleoperation combined with automation (Larsson et al., Citation2010). Increased economic efficiency and productivity due to reduced ventilation times after blasting was also a strong driver. The mining industry is capital intensive and handles high-value materials, which increases the incentives for efficiency improvements, even if the investment to achieve the improvements are sometimes high. While some of these aspects may be less relevant to the forest sector, concerns such as worker safety when harvesting and forwarding in steep terrain may also find potential solutions in teleoperations (Visser and Obi Citation2021). In addition, the social aspects of the work life of a machine operator can potentially become more flexible and improved with the transfer of work from the machine cab to a modern office environment in a city or village. In the future, it could also be possible for operators to work from any location, such as from home, something that would not benefit the social life of operators but could create opportunities for work in remote areas.
Validation
The total volume of harvested roundwood for the simulations was approximately 1.6 million m3, representing around 2% of the annual harvest in Sweden over the last decade. Even when the individual simulation runs covered just one of the three geographic areas, using a subset never less than 20% of the total volume, the number of loads in all simulations were consistently high. A high number of loads, or entities, increases representability and reduces the need for many repetitions of the same simulation. A test with replicated simulations resulted in little variation in output between replications, thus indicating repetitions are redundant. The tenfold repetition of the already large input dataset seems, therefore, to be sufficient to stabilize the effect of random components within the model. The effect of individual stand conditions, such as extraction distance, had a greater effect on the output than random variables within the model.
To compare the outputs from the simulations with other studies, the definition of work elements need to be aligned between studies. Forwarder time studies contain some ambiguity regarding naming of the work elements, even if most of the definitions are similar. This study follows the work element definitions of Nurminen et al. (Citation2006). Other studies have used slightly different wording for the same work elements, and/or differently handled the occurrence of crane-work and driving between log-piles, separately or in combination, during loading (c.f. Ackerman et al., Citation2014b; Gullberg Citation1997; Talbot et al. Citation2003; Tiernan et al. Citation2004; Strandgard and Mitchell Citation2015). Moreover, comparisons have to take into account productivity variations due to numerous other factors, such as time unit specification (e.g. SMH, PMH15, or PMH0), stand and terrain conditions, time of the year, machine features, etc.
As a way to validate the simulation model of the standard forwarding, the work of Manner et al. (Citation2016) provides a good benchmark after adapting load size to 21 m3 instead of the original 16–17 m3, as it involves a large and relatively recent dataset for large forwarders. Key figures for speeds and time consumption were outputted from the simulation model. For machine speed during driving, the average, median and range were all very similar to the original figures presented by Manner et al. (Citation2016). This was expected since the probability density functions for speed were derived from that study. The same comparisons, again without load size adaptions, were made for the time consumption of the work elements () and, in general, there was good correspondence. The exception was the time for loading which was shorter, on average, in the simulation than in Manner et al. (Citation2016): 17.9 and 21.0 minutes respectively. In this case, the difference can largely be attributed to the single assortment simplification of the simulation. Since the simulation does not take several assortments into account, no mixed loads or other planning aspects were required to complete the harvest in the best way. These planning elements are central to forwarding work in practice, from which the statistics in Manner et al. (Citation2016) stem, and are recognized to have substantial impact on productivity. A test with 33% increased time consumption for loading and unloading was conducted to roughly reflect what would happen with multiple assortments. The test was done for the northern region and the result shows that seven operators for ten machines was still the most cost efficient configuration, however, the potential cost reduction was 5.3% instead of 7%. This result is expected since the increased time for loading and unloading is time where operators are required. The difference in loading time is also the main reason for the difference in total time consumption (excluding downtime) for the simulation (37.8 minutes) and the statistics in Manner et al. (Citation2016) (39.3 minutes).
Another difference between the results of the simulation and the statistics were that the time for driving empty was longer than the time for driving loaded in the statistics, despite a higher driving speed when driving empty. This was contrary to the simulation results, and the explanation is probably that the operators choose to drive a longer distance without a load to be able to finish loading on the way back. Even though that kind of procedure is typical in real operations, it was not modeled in the simulations. Instead, there is a variation in distance between the loads, keeping the driving empty distance and driving loaded distance within each load equal. The difference between simulation and statistics from Manner et al. (Citation2016) regarding the combined empty and loaded driving times was, on average, 3.3 minutes per load. The higher time consumption for driving in the simulations can be explained by longer average extraction distance in the harvested stands compared to the data-material in Manner et al. (Citation2016). The average downtime per load in the simulation was 4.2 minutes compared to 6.5 minutes in Manner et al. (Citation2016). Lacking extensive literature on the subject, downtime functions in the simulation () was based on separate extensive and detailed machine data. In all these comparisons, it is relevant to consider the substantial standard deviations (SD) that Manner et al. (Citation2016) described, for example, 6.5 minutes of downtime with a SD of 11.9, as well as the fact that the two datasets were produced from different harvest areas.
The total time consumption per load in the simulation was converted to productivity, again assuming a load capacity of 22 m3. The productivity for a 200 m one-way extraction distance was 37 m3/h including downtime (). Hence, the simulation produced somewhat higher productivity than previous studies ().
Table 5. A comparison of productivities in this study and previous studies, after necessary calculations for comparison. Load sizes in all calculations were targeted at the largest current forwarders, even though some of the data and norms are based on smaller machines. The one-way extraction distance was approximately 200 m for all calculations.
The main explanation for the higher productivity in the simulation compared to most previous studies is attributed to the simplification of having only one timber assortment, which underestimates the time for loading. Single assortment extraction is however practically implemented when forwarding in Eucalyptus plantations in, for example, South America (Santos et al. Citation2020), . With often favorable ground conditions and the extraction distance seldom exceeding a few hundred meters (100 m on average in this case), productivity levels for Nordic CTL forwarders was then measured in the 60–70 m3/hour range (Santos et al. Citation2020), corroborating that single-assortment forwarding have higher productivity potential.
The terminal time as a proportion of total time consumption () aligns well with earlier studies compiled and presented by Manner et al. (Citation2013).
Sensitivity analyses
Some of the main model parameters have been altered as a way of validating the stability of the results and to observe their effect on the comparison between standard forwarding and tele-extraction. Parameters included driving speed, operator cost, downtime length, crane speed (loading and unloading time), and extraction distance. The conclusion was that extraction distance and operator cost had the strongest effects on the economic viability of tele-extraction in practice, but the effects of the other parameters were also considerable ().
Table 6. The effect on potential cost reduction (%) for tele-extraction from driving speed, operator cost, downtime length, extraction distance, and crane speed.
This study focused on final felling and use of the largest forwarders available. Cost estimates, statistics on unloading times and speeds etc. were all adjusted for large forwarders. Nevertheless, by changing load size in the DES model we got a rough indication of how tele-extraction could function with smaller forwarders. With load size adjusted from 22 m3/load to 15 m3/load, productivity became correspondingly lower. As expected, the economic potential for tele-extraction was slightly higher with the smaller load size, simply because there would be more autonomous driving with more (but smaller) loads. In this case, the best configuration was six operators for ten machines with a potential cost saving of 8.8%, compared to the 7% for the larger load size.
A wood supply chain is not only about the unit cost at delivery, but also about delivering the right amount of wood at the right time. A simple comparison of the total time for standard forwarding and the best configuration of tele-extraction (seven operators for ten machines in the northern region) estimates that the tele-extraction system requires 8% more time to extract the same amount of wood as the standard forwarding system. Thus, there would be a need for extra shifts or machines to compensate for the lower productivity in the tele-extraction system.
System boundaries
As of today, several assumptions made in this study would not work in the practical implementation of tele-extraction. We were assuming legal clearance of using autonomous vehicles in the forest. While not all issues surrounding autonomous vehicles are yet resolved, they bear similarities to issues for self-driving cars, which engineers, legislators, and politicians will inevitably have to deal with in other forums. In addition, today’s technological limitations have been assumed to be solvable in the near future as engineering groups in Sweden, and around the world, work toward creating autonomous and tele-operated control systems adapted to forestry as well as other sectors. Specific hard-to-solve technical challenges that arise can be embedded in future simulations and parameters updated as technical progress makes them available.
A key element of forwarder work not accounted for in this study is the relocation of equipment between harvesting sites. Relocations have been found to represent 0.9–1.1% of the total scheduled working time for forwarders (Eriksson and Lindroos Citation2014) and the average relocation being 25–30 km or 2–2.5 h for the relocation truck (Väätäinen et al. Citation2021). The practical implications of not having the operator on site may complicate the loading and unloading from relocation trucks in case the truck driver cannot assist. On the other hand, tele-extraction could also eliminate the operator downtime while waiting for relocation trucks, something that is unwanted and partly avoided today by owning relocation trucks within small contracting companies (Väätäinen et al. Citation2021). In the case of such delays, teleoperators could continue working with other machines while the forwarder is waiting for a relocation truck. The effect of relocation on the overall viability of tele-extraction has not yet been studied but it is not believed to be a significantly negative aspect, since a large number of relocations would take advantage of the fact that operators can work with other machines during waiting times. A more relevant aspect is the potential effect on downtime for refueling, service and repairs that tele-extraction might imply. One could argue that the downtime could be expected to increase when there is no operator on site to e.g. refuel or immediately address breakdowns. On the other hand, this study was based on data for new forwarders for which random breakdowns are rare, relying on scheduled services carried out by external personnel, thus not favoring standard forwarding over tele-extraction. Refueling could probably easily be solved either via teleoperation or even autonomously. A third aspect of teleoperation that was not considered in this study is the potential telecom lag or delays that might occur for long-distance teleoperation when operating in areas of limited digital infrastructure and how this affects machine safety and operator performance. This constitutes yet another parameter that was difficult to quantify for the simulation, so it was simply assumed that the required conditions would be in place by the time that a tele-extraction system was close to implementation. Further research on mentioned parameters is a necessity to fully understand the behavior of the proposed machine systems.
Future research
The challenge of several assortments for teleoperators versus standard on-site operators incorporates the planning of exactly when to load specific assortments, and how and when to load mixed loads. These are key components for high productivity in standard forwarding and an important subject for further research. However, for teleoperation to work, we assume a higher degree of driver support based on spatial information from the harvester of where to find the volumes for each assortment and further progress on tools for planning the forwarding (Hosseini et al. Citation2019; Flisberg et al. Citation2021).
Harvester and forwarder interaction and balance in productivity should also be incorporated in future research of the tele-extraction concept. It should be easier to handle the variation in workflow between machines (Johansson et al. Citation2022) by adjusting the length or number of shifts of the tele-operated forwarder compared to the traditional one since teleoperators’ work can be optimized to the harvester-forwarder system within a pool of forwarders.
In this study, downtime was handled as an aggregated downtime, that is, no specific division of service, breakdown or other duties. This means that a downtime event could occur either when the machine was operated (remotely) or when it was autonomously driving. Since the different kinds of downtime result in waiting times either with or without an operator, further research should distinguish between those and incorporate the cost of potential extra service/repair resources.
A system such as the tele-extraction concept implies that there is no physical operator on the machine, thus enabling different technical configurations of the tele-forwarders. For example, the cabin, with its sophisticated systems for improved operator comfort, could be excluded and replaced with extra payload. That, and other conceivable changes in the technical design, are of interest for future simulations to evaluate their respective potential.
Conclusions
The study resulted in estimated theoretical cost reductions of approximately 7% for the implementation of a partly autonomous multi-machine tele-extraction system working under Swedish conditions for the CTL harvesting method. The potential cost reductions will also vary with physical, social, and economic factors. This study identified extraction distance as the primary factor for potential cost reduction. Longer extraction distances (> 500 m) were demonstrated to favor five or six operators per ten machines, providing higher operator pool utilization and lower machine waiting times for the tele-extraction concept, resulting in potential cost reductions of up to 15%.
Acknowledgements
The authors would like to thank forest companies that provided data to this study. A special thank you to Anna Bylund at SCA, Umeå for generous help with up-to-date data on downtime and cost.
Disclosure statement
No potential conflict of interest was reported by the author(s).
Additional information
Funding
References
- Ackerman P, Belbo H, Eliasson L, de Jong A, Lazdins A, Lyons J. 2014a. The cost model for calculation of forest operations costs. Int J For Eng. 25(1):75–81. doi:10.1080/14942119.2014.903711.
- Ackerman P, Gleasure E, Ackerman S, Shuttleworth B. 2014b. Standards for time studies for the South African forest industry. accessed June 20. http://www.forestproductivity.co.za/?page_id=678.
- Andersson U. 2013. Automation and traction control of articulated vehicles. Diss.: Luleå University of Technology.
- Asikainen A. 1995. Discrete-event simulation of mechanized wood-harvesting systems. Diss.: University of Joensuu.
- Asikainen A. 2010. Simulation of stump crushing and truck transport of chips. Scand J For Res. 25(3):245–250. doi:10.1080/02827581.2010.488656.
- Banks J, Carson J, Nelson B, and Nicol D. 2005. Discrete-event system simulation. London: Prentice Hall International Series in Industrial and Systems Engineering. Pearson Education India: Pearson Education India.
- Berg S, Bergström D, Nordfjell T. 2014. Simulating conventional and integrated stump-and round-wood harvesting systems: a comparison of productivity and costs. Int J For Eng. 25(2):138–155. doi:10.1080/14942119.2014.941640.
- Bergstrand K-G. 1985. Underlag för prestationsmal för skotning. (Redogörelse). Spånga: Forskningsstiftelsen Skogsarbeten.
- Brunberg T. 2004. Underlag till produktionsnormer för skotare. (Redogörelse). Uppsala: Skogforsk.
- Bylund A. 2020. Personal communication. Production manager SCA Skog AB.
- Core Team R. 2018. R: a language and environment for statistical computing. [Computer program]. Vienna (Austria): R Foundation for Statistical Computing. https://www.R-project.org/.
- Dadhich S, Bodin U, Andersson U. 2016. Key challenges in automation of earth-moving machines. Autom Constr. 68:212–222. doi:10.1016/j.autcon.2016.05.009.
- Dadhich S, Sandin F, Bodin U, Andersson U, Martinsson T. 2019. Field test of neural-network based automatic bucket-filling algorithm for wheel-loaders. Autom Constr. 97:1–12. doi:10.1016/j.autcon.2018.10.013.
- Diaz R, Behr JG. 2010. Discrete-event simulation. In: Sokolowski JA, Banks CM, editors. Modeling and simulation fundamentals. Suffolk: Wiley; p. 57.
- Eriksson A. 2016. Improving the efficiency of forest fuel supply chains. Diss.: Swedish University of Agricultural Sciences.
- Eriksson M, Lindroos O. 2014. Productivity of harvesters and forwarders in CTL operations in northern Sweden based on large follow-up datasets. Int J For Eng. 25(3):179–200. doi:10.1080/14942119.2014.974309.
- FAO. 2014. Statistics yearbook forest products. Rome (Italy): FAO Statistics yearbook. [accessed 2021 May 11]. http://www.fao.org/forestry/statistics/80570/en/.
- FAO. 2019. Statistics yearbook forest products. Rome (Italy): FAO Statistics yearbook. [accessed 2021 May 11]. http://www.fao.org/forestry/statistics/80570/en/.
- FAO. 2020. The global forest resources assessment 2020. The Global Forest Resources Assessment 2020. Rome (Italy).
- Fernandez-Lacruz R, Eriksson A, Bergström D. 2020. Simulation-based cost analysis of industrial supply of chips from logging residues and small-diameter trees. Forests. 11(1):1. doi:10.3390/f11010001.
- Flisberg P, Rönnqvist M, Willén E, Frisk M, Friberg G. 2021. Spatial optimization of ground-based primary extraction routes using the bestway decision support system. Can J For Res. 51(5):675–691. doi:10.1139/cjfr-2020-0238.
- Gullberg T. 1997. A deductive time consumption model for loading shortwood. J For Eng. 8(1):35–44.
- HIAB HiVision LOGLIFT - JONSERED. Product description. [accessed 2021 May 21]. https://www.hiab.com/en/digital-solutions/hivision/hivision-for-forestry-cranes.
- Hosseini A, Lindroos O, Wadbro E. 2019. A holistic optimization framework for forest machine trail network design accounting for multiple objectives and machines. Can J For Res. 49(2):111–120. doi:10.1139/cjfr-2018-0258.
- Häggström C, Lindroos O. 2016. Human, technology, organization and environment – a human factors perspective on performance in forest harvesting. Int J For Eng. 27(2):67–78.
- Johansson M, Erlandsson E, Kronholm T, Lindroos O. 2022. The need for flexibility in forest harvesting services–a case study on contractors’ workflow variations. Int J For Eng. 1–13. doi:10.1080/14942119.2022.2071142.
- Johnson LR, and Fisher EL. 1978. Costing forest residue recovery through simulation. Washington DC: Institute of Electrical and Electronics Engineers (IEEE).
- Kons K, La Hera P, Bergström D. 2020. Modelling dynamics of a log-yard through discrete-event mathematics. Forests. 11(2):155. doi:10.3390/f11020155.
- Larsson J, Broxvall M, Saffiotti A. 2010. An evaluation of local autonomy applied to teleoperated vehicles in underground mines. In: Proceedings of 2010 IEEE International Conference on Robotics and Automation, May 3-7; p. 1745–1752.
- Lindroos O. 2012. Evaluation of technical and organizational approaches for directly loading logs in mechanized cut-to-length harvesting. For Sci. 58(4):326–341. doi:10.5849/forsci.11-001.
- Lindroos O, La Hera P, Häggstrom C. 2017. Drivers of advances in mechanized timber harvesting - a selective review of technological innovation. Croatian J For Eng. 38(2):243–258.
- Lindroos O, Mendoza-Trejo O, La Hera P, and Morales DO. 2019. Advances in using robots in forestry operations. In: Billingsley J, editor. Robotics and automation for improving agriculture. Vol. 44, Cambridge, UK: Burleigh Dodds Series in Agricultural Science; p. 233–260.
- Lundbäck M, Häggström C, Nordfjell T. 2021. Worldwide trends in methods for harvesting and extracting industrial roundwood. Int J For Eng. 32(3):202–215. doi:10.1080/14942119.2021.1906617.
- Manner J. 2015. Automatic and experimental methods to studying forwarding work. Diss. Swedish University of Agricultural Sciences.
- Manner J, Berg S, and Ersson BT. 2019. Forwarding during final felling: work element-specific distributions of driving distances at the stand level. Int J For Eng. 31(1):1–18.
- Manner J, Nordfjell T, Lindroos O. 2013. Effects of the number of assortments and log concentration on time consumption for forwarding. Silva Fenn. 47(4):19. doi:10.14214/sf.1030.
- Manner J, Palmroth L, Nordfjell T, Lindroos O. 2016. Load level forwarding work element analysis based on automatic follow-up data. Silva Fenn. 50(3):1–19. doi:10.14214/sf.1546.
- Marklund S. 2017. The comparison of automatic and manual loading in an underground mining environment. Diss. Luleå University of Technology.
- Milne B, Chen X, Hann C, Parker R, Milliken P. 2013. Design and development of teleoperation for forest machines: an overview. Engineering creative design in robotics and mechatronics. p. 186–207.
- Nordfjell T, Öhman E, Lindroos O, Ager B. 2019. The technical development of forwarders in Sweden between 1962 and 2012 and of sales between 1975 and 2017. Int J For Eng. 30(1):1–13. doi:10.1080/14942119.2019.1591074.
- Nurminen T, Korpunen H, Uusitalo J. 2006. Time consumption analysis of the mechanized cut-to-length harvesting system. Silva Fenn. 40(2):336–363. doi:10.14214/sf.346.
- Olsson M-O, and Sjöstedt G. 2004. Systems approaches and their application. Norwell, MA: Kluwer academic publishers, Dordrecht.
- Ortiz Morales D, Westerberg S, La Hera PX, Mettin U, Freidovich L, Shiriaev AS. 2014. Increasing the level of automation in the forestry logging process with crane trajectory planning and control. J Field Rob. 31(3):343–363. doi:10.1002/rob.21496.
- Palander T, Nuutinen Y, Kariniemi A, Väätäinen K. 2012. Automatic time study method for recording work phase times of timber harvesting. For Sci. 59(4):472–483. doi:10.5849/forsci.12-009.
- Persson T. 2020. Design of a workstation for teleoperated forwarders: exploring the future work within forestry. Diss. Luleå University of Technology.
- Puodziunas M, Fjeld D. 2008. Roundwood handling at a Lithuanian sawmill-discrete-event simulation of sourcing and delivery scheduling. Balt For. 14(2):163–175.
- Ringdahl O, Hellstrom T, Lindroos O. 2012. Potentials of possible machine systems for directly loading logs in cut-to-length harvesting. Can J For Res. 42(5):970–985. doi:10.1139/x2012-036.
- Ringdahl O, Lindroos O, Hellström T, Bergström D, Athanassiadis D, Nordfjell T. 2011. Path tracking in forest terrain by an autonomous forwarder. Scand J For Res. 26(4):350–359. doi:10.1080/02827581.2011.566889.
- Santos DWFDN. 2015. Análise técnico-econômico de sistemas de colheita: toras curtas e toras longas sob métodos mecanizado e semimecanizado.
- Santos DWFDN, Magalhães Valente DS, Fernandes HC, Souza APD, Cecon PR. 2020. Modeling technical, economic and environmental parameters of a forwarder in a Eucalyptus forest. Int J For Eng. 31(3):197–204. doi:10.1080/14942119.2020.1786791.
- Strandgard M, Mitchell R. 2015. Automated time study of forwarders using GPS and a vibration sensor. Croatian J For Eng. 36(2):175–184.
- Sundberg U, Silversides CR. 1988. Operational efficiency in forestry vol. 1 analysis. Dordrecht Holland: Kluwer Academic Publishers.
- Talbot B, Nordfjell T, Suadicani K. 2003. Assessing the utility of two integrated harvester-forwarder machine concepts through stand-level simulation. Int J For Eng. 14(2):31–43. doi:10.1080/14942119.2003.10702476.
- Tiernan D, Zeleke G, Owende P, Kanali C, Lyons J, Ward S. 2004. Effect of working conditions on forwarder productivity in cut-to-length timber harvesting on sensitive forest sites in Ireland. Biosyst Eng. 87(2):167–177. doi:10.1016/j.biosystemseng.2003.11.009.
- Visser R, Obi OF. 2021. Automation and robotics in forest harvesting operations: identifying near-term opportunities. Croatian J For Eng. 42(1):13–24. doi:10.5552/crojfe.2021.739.
- Väätäinen K, Ala-Fossi A, Nuutinen Y, Röser D. 2006a. The effect of single grip harvester’s log bunching on forwarder efficiency. Balt For. 12(1):64–69.
- Väätäinen K, Hyvönen P, Kankaanhuhta V, Laitila J, Hirvelä H. 2021. The impact of fleet size, harvesting site reserve, and timing of machine relocations on the performance indicators of mechanized CTL harvesting in Finland. Forests. 12(10):1328. doi:10.3390/f12101328.
- Väätäinen K, Liiri H, Röser D. 2006b. Cost-competitiveness of harwarders in CTL-logging conditions in Finland-A discrete-event simulation study at the contractor level. In: Proceedings of precision forestry in plantations, semi-natural and natural forests. Citeseer Stellenbosch, South Africa: Proceedings of the international precision forestry symposium. Stellenbosch University; p. 451.
- Westerberg S, Shiriaev A. 2013. Virtual environment-based teleoperation of forestry machines: designing future interaction methods. J Hum -Rob Interact. 2(3):84–110. doi:10.5898/JHRI.2.3.Westerberg.
- Wickham H. 2016. Ggplot2: elegant graphics for data analysis. [Computer program]. New York: Springer-Verlag.
- Zhang F, Johnson DM, Johnson MA. 2012. Development of a simulation model of biomass supply chain for biofuel production. Renewable Energy. 44:380–391. doi:10.1016/j.renene.2012.02.006.