
Abstract
Objective: The “Occupational Earcheck” (OEC) is a Dutch online self-screening speech-in-noise test developed for the detection of occupational high-frequency hearing loss (HFHL). This study evaluates an optimised version of the test and determines the most appropriate masking noise. Design: The original OEC was improved by homogenisation of the speech material, and shortening the test. A laboratory-based cross-sectional study was performed in which the optimised OEC in five alternative masking noise conditions was evaluated. Study sample: The study was conducted on 18 normal-hearing (NH) adults, and 15 middle-aged listeners with HFHL. Results: The OEC in a low-pass (LP) filtered stationary background noise (test version LP 3: with a cut-off frequency of 1.6 kHz, and a noise floor of −12 dB) was the most accurate version tested. The test showed a reasonable sensitivity (93%), and specificity (94%) and test reliability (intra-class correlation coefficient: 0.84, mean within-subject standard deviation: 1.5 dB SNR, slope of psychometric function: 13.1%/dB SNR). Conclusions: The improved OEC, with homogenous word material in a LP filtered noise, appears to be suitable for the discrimination between younger NH listeners and older listeners with HFHL. The appropriateness of the OEC for screening purposes in an occupational setting will be studied further.
Introduction
High-frequency hearing loss (HFHL) caused by occupational noise, also known as occupational noise-induced hearing loss (NIHL) is an important worldwide public health problem (May, Citation2000). In the Netherlands, NIHL is one of the most commonly reported occupational illnesses (van der Molen et al, Citation2014). NIHL is an acquired sensorineural hearing loss with noise as an avoidable cause, and is therefore preventable. The damage that develops over the years due to noise exposure is permanent. NIHL develops gradually and is often unnoticed until the damage becomes substantial. It initially affects the higher frequency region of 3–6 kHz, the region most susceptible to noise. This shows as a characteristic notch in the audiogram at 4 kHz (Brookhouser, Citation1994; May, Citation2000; Flamme et al, Citation2014). The notch broadens as noise exposure continues (Hsu et al, Citation2013). One of the first consequences of hearing loss due to noise is difficulty in understanding speech in daily situations when background noise is present (Kramer et al, Citation1998). This specific hearing disability can be accurately measured by means of a speech-in-noise test (Smoorenburg, Citation1992). Such a test measures the ability to understand speech in noise by varying the ratio between speech and noise levels, the signal-to-noise ratio (SNR). The outcome measure is the speech reception threshold (SRT), the average SNR at which a particular percentage (e.g. 50%) of the speech material is correctly identified. Over the past few years several telephone- and internet-based speech-in-noise self-tests have been developed in various languages, with different purposes, and aimed at various populations (Smits et al, Citation2004, Citation2006; Jansen et al, Citation2010; Leensen et al, Citation2011a; Watson et al, Citation2012; Mollander et al, Citation2013; Paglialonga et al, Citation2014; Vlaming et al, Citation2014; Williams-Sanchez et al, Citation2014). These tests differ in important test characteristics such as speech stimuli, type of background noise and test procedure. Speech-in-noise tests have the right properties for use as self-administered internet-based hearing screening tests (Smoorenburg, Citation1992; Smits et al, Citation2004; Culling et al, Citation2005; Smits et al, Citation2006; Jansen et al, Citation2010; Leensen et al, Citation2011a; Smits et al, Citation2013). The test can be performed quickly with minimal instructions, and its online application makes it easily accessible. The test is relatively independent from the absolute presentation level, as the ratio of speech intensity and level of masking noise is measured (Plomp Citation1986; Smits et al, Citation2004; Wagener & Brand, Citation2005). Furthermore, the test is relatively robust against variations in background noise and test equipment (Smits et al, Citation2004; Culling et al, Citation2005; Jansen et al, Citation2010). Such a test may facilitate audiometric hearing evaluation of noise-exposed employees in the workplace, as a trained audiometrist, a soundproof room, and specialised and costly technical equipment are not required (Stenfelt et al, Citation2011; Leensen & Dreschler, Citation2013b).
This study concentrates on the Occupational Earcheck (OEC), a Dutch online speech-in-noise test, developed at the Department of Audiology of the Leiden University Medical Center, commissioned by the Dutch National Hearing Foundation (Ellis et al, Citation2006). It is a test specifically designed to detect HFHL within a few minutes. The OEC is presented via headphones, which allows testing of both ears separately. The OEC was evaluated by Leensen et al (Citation2011a), and shown to be reliable in laboratory conditions [with a standard error of measurement of 1.3 dB, and an intra-class correlation coefficient (ICC) of 0.68], but lacked discriminative power (with a sensitivity of 92% and specificity of 49%). Test precision was assessed by means of the steepness of the slope of the psychometric function (slope = 11.0%/dB SNR). The OEC was significantly correlated with pure-tone average (PTA) of the frequencies 0.5, 1, 2, 4, and 3, 4, 6 kHz, and with the Dutch sentence SRT test (r = 0.69, r = 0.66, and r = 0.77, respectively).
Adaptations involving the speech material, and the masking noise could improve the accuracy of the OEC in detecting HFHL. Possible adaptions include adjusting the root mean square levels of the words to achieve equal intelligibility, and filtering of the masking noise. Previous work suggested that a test with a spectrally filtered masking noise better distinguishes between normal-hearing (NH) and hearing-impaired (HI) listeners (Leensen et al, Citation2011b; Jansen et al, Citation2014; Vlaming et al, Citation2014). A stationary low-pass (LP) filtered masker stimulates the use of high-frequency speech information, which is advantageous for NH listeners. This consequently increases the discriminative power of the test.
The aim of this study was to evaluate the “OEC” after optimising its speech and noise material, and test procedure. A laboratory-based cross-sectional study was carried out on NH adults, and HI subjects with a HFHL, most probably related to noise exposure. The discriminative power of the optimised test in five different masking noise conditions was assessed. Furthermore, test validity was assessed by comparing pure-tone thresholds to test versions in different masking conditions. Finally, test reliability was assessed. These outcome measures were then used to select the version of the test which was most accurate in differentiating between NH and HFHL listeners, while remaining sufficiently valid and reliable.
Methods
Subjects
An a priori power analysis indicated that at least 15 subjects per NH and HI group would be necessary in order to attain a power of 80%, assuming a relevant difference in test outcome (SRT) of 2.6 dB SNR between the groups (Leensen et al, Citation2011b). A loss of subjects (due to non-attendance, drop-out or exclusion) was anticipated. Therefore up to 40 subjects were invited to participate. Study subjects were sampled by means of a two-gate design. NH participants were mainly students, recruited from the university and a neighbouring high school. HFHL subjects exposed to noise at the workplace were recruited from different industries with high noise exposure, including an orchestra, the construction industry, and a newspaper factory. All subjects were adults (≥18 years), and native speakers of Dutch. NH was defined as pure-tone thresholds of 20 dB HL or better at 0.125–6 kHz. HFHL was defined as pure-tone thresholds of 20 dB HL or better at the frequencies 0.125–1 kHz, and thresholds ≥25 dB HL for at least one frequency between 2 and 6 kHz. Subjects were excluded if they experienced language problems, had an asymmetrical hearing loss (i.e. a difference between the left and the right ear >30 dB at all frequencies), or a type of hearing loss other than HFHL.
In total, 36 subjects participated of which three subjects did not meet the inclusion criteria, and were excluded from further testing. The study population consisted of 18 NH subjects, and 15 subjects with a HFHL. Most of the participants were unfamiliar with online speech-in-noise testing. Details of the participants are listed in . The majority of the participants were male (66.7%). An independent samples t-test showed that the HFHL subjects were significantly older than NH subjects (p < 0.001). The exact cause of the HFHL is unknown; however, all of these subjects had a self-reported history of occupational or leisure noise exposure. Seventeen participants (51.5%) were tested on the right ear. The mean volume level chosen by the NH subjects was 75.3 dBA (SD = 4.9), and by the HFHL subjects 76.7 dBA (SD = 5.0). An independent samples t-test showed that the chosen volume level did not differ significantly between the groups (p = 0.363). Mean hearing threshold levels for NH and HFHL subjects are presented in .
Figure 1. Audiometric thresholds for NH and HFHL subjects (for test ear). Error bars represent SDs.
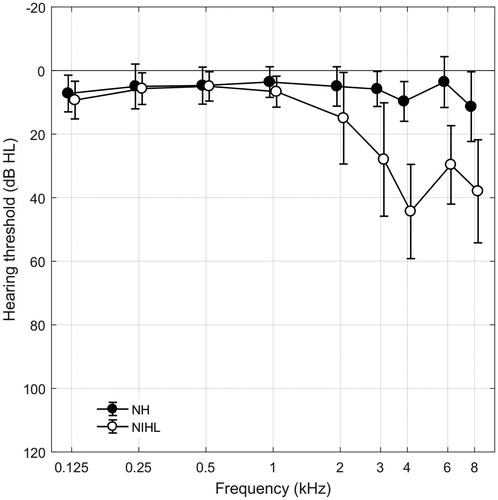
Table 1. Participant characteristics.
OEC
The speech material of the original OEC consisted of a closed set of nine Dutch consonant-vowel-consonant (CVC) syllables, represented by nine response buttons (identified by pictures and written words) on a computer screen. A tenth button labelled “not recognized” was included. The words were selected from the Dutch word list used for diagnostic speech audiometry (Bosman, Citation1989), with a phonemic distribution representative of the Dutch language (Albrecht et al, Citation2005). The words contained high-frequency consonants, and were paired to contain a matching vowel (bed/bɛt/, knife/mɛs/, bag/tαs/, pan/pαn/, cat/pus/, book/buk/, sock/sɔk/, sun/zɔn/, arrow/pɛil/). By matching the vowels, listeners especially need the high-frequency speech information in order to identify the words. The recording was made using a female Dutch speaker. The OEC had no bandwidth limitations, and words were randomly presented in a stationary broadband noise, matched to the long-term average speech spectrum (LTASS). The volume level of the speech could be set by the user prior to testing.
The test was administered by means of the simple adaptive up–down procedure, with a step size of 2 dB. The first stimulus was presented at a SNR of 0 dB. After every correct response the subsequent stimulus speech level was decreased by 2 dB. After every incorrect response the SNR was increased by 2 dB. The SNR’s presented ranged from −14 to +4 dB. For every listener, the SNRs until the first incorrect response was given, were not included in the SRT calculation, which resulted in an individual starting level. From this level, a total of 35 stimuli were presented to all listeners. The SRT at 50% was calculated by averaging the SNRs of the last 30 stimuli, for both ears separately. After finishing the test, the results (“good”, “moderate”, “insufficient”, “poor” or “very poor”) for both ears were directly reported to the user together with the appropriate advice. The intra-test standard deviation (SD) was calculated, showing the variation of SRT within the adaptive procedure. The intra-test SD gives an insight into the variation within a single test measurement, and can therefore be used as a measure of the accuracy of a test performed by an individual.
Optimisation of the original OEC
The original OEC was optimised in three different ways: (i) homogenisation of the speech material; (ii) filtering of the masking noise and (iii) adaptation of the test procedure. In order to optimise the original OEC, past OEC test results (N = 7933, of the period May 2007 to May 2014) were examined. Test results with intra-test SDs >3 dB were considered unreliable, and were therefore excluded. The mean age of test users was 36.5 years (SD = 15.8).
Homogenisation of the speech material: Word selection and level corrections
In order to develop a precise test, the intelligibility of the individual words included in the test should be as homogenous as possible. Therefore, the slopes of the word-specific psychometric functions were determined, and word intelligibility was equalised with level adjustments based on the average SRTs for the individual words. A logistic regression model was applied to past OEC data for each of the individual words, with the speech intelligibility (percentage correct words) as a function of the SNR of the test presentations. First, the data were corrected for the relative performance of each user. Then the data of all users, and for both ears were pooled for each word. To obtain the mean SRT, and slope at the 50%-point, following function was used (Smits et al, Citation2004):
where, SI is speech intelligibility (the proportion correct at a given relative SNR), γ is guess level, and s is slope of the psychometric function at SRT. The model took into account the guess level γ (1/9 = 0.11), resulting from the closed set of nine words. The psychometric function of the word arrow/pɛil/had a deviant slope (21.5%/dB SNR), which was much steeper as compared to the slopes of the other words-specific functions, ranging from 9.3%/dB SNR to 15.6%/dB SNR. To avoid the relatively easy recognition of this word based on its unique vowel (i.e. diphthong), this word was removed from the test. The remaining eight words were amplified (perceptually difficult words) or attenuated (perceptually simple words) according to their word-specific SRTs.
This procedure is in agreement with procedures used for other speech-in-noise tests with closed response sets (e.g. Leensen et al, Citation2011b), but deviates from recommendations in ISO 8253-3. Where the standard prescribes “to base such curves on a sufficiently large number of otologically normal persons of both sexes, aged between 18 and 25 years inclusive and for whom the test material is appropriate”, there was no information available about the pure-tone audiogram and it could not be verified which subjects were ontologically normal, because the results were collected through the internet. However, a procedure was maintained that strongly reduced the differences between NH and HI listeners and it is expected that the relative difficulty within subjects is comparable for subgroups of NI and HI subjects.
Filtering of the masking noise: enhancing the sensitivity for NIHL
The LP filtered masking noises were created according to the methods described by Leensen et al (Citation2011b). First, a broadband stationary masking noise was created, with the same spectral shape as the LTASS of the optimised word material. Then a set of four different LP filtered masking noises (indicated with LP) was derived by filtering the broadband stationary masking noise. Appropriate cut-off frequencies and noise floors were determined by speech intelligibility index (SII) predictions, according to ANSI S3.5 (1997). SII predictions were performed, in which relevant parameters of filtered noise conditions were varied to predict the effects on SRT for various audiograms. A more detailed description of the SII predictions can be found in Leensen et al (Citation2011b). According to these predictions, LP filtered noises with cut-off frequencies of 1.4 and 1.6 kHz both discriminate well between NH, and HI individuals. To mask potential ambient noise levels, noise floors were presented at two different levels: −12 dB, and −15 dB. Both cut-off frequencies were combined with both noise floors. The five test versions are described in .
Table 2. Characteristics of the test noises.
Adaptations of the test procedure: test length
To prevent unnecessarily long testing, and consequently, potential concentration problems in listeners, the influence of the number of stimuli per test on SRT and on intra-test SD was assessed. This was based on all past test results, i.e. including test results with intra-test SDs >3 dB (n = 9429). Mean SRTs and intra-test SDs were calculated for different test lengths, in steps of five presentations, including total test lengths of 35, 30 and 25 presentations (starting from the individual starting level). The first five presentations were not included in the calculations. The test length did not influence SRT scores, with a mean SRT of −8 dB SNR for all test lengths. Mean intra-test SDs for the different test lengths did not differ either (range: 2.2–2.3 dB). The smallest mean intra-test SD was found for a total test length of 25 stimuli. Therefore the test length was shortened from 35 to 25 stimuli per ear.
Measurement procedures
The study protocol was approved by the medical ethics committee of the University of Amsterdam (number NL45730.018.13). All participants were informed and recruited by information letters. Informed consent was given before the start of the measurements.
All audiometric, and speech-in-noise tests were carried out in a soundproof booth at the audiological research department of the AMC. Pure-tone thresholds were assessed first using a Decos clinical audiometer (Decos Systems B.V., Noordwijk, the Netherlands), and TDH-39P headphones (Telephonics, Farmingdale, NY). Audiometric equipment was regularly calibrated using a B&K 2260 sound level metre (Brüel & Kjaer, Naerum, Denmark), and a B&K artificial ear type 4153 (Brüel & Kjaer). The audiogram was recorded at the octave frequencies from 0.125 to 8 kHz, including 3 and 6 kHz. Bone conduction was measured at 0.25, 0.5, 1, 2 and 4 kHz. Pure-tone audiometry was carried out by trained personnel.
Subsequently each subject completed a session with the five different test versions of the OEC. The OEC was fully automated and presented using an Adobe Macromedia Flash player web application on a personal computer (Dell Precision T3500, US), which was directly connected to HDA 200 audiometric headphones (Sennheiser, Wedemark, Germany). The speech-in-noise tests were presented monaurally. All tests were presented to one ear of each subject, which was randomly assigned by the web application of the OEC. The order in which the different masking versions were presented was counterbalanced. The tests started after entering the participant’s personal log-in code, which was linked to a certain sequence of tests. Instructions were given prior to testing, and the speech stimuli were presented once to familiarise the subject with the stimuli, and the response on the computer screen. The tests were performed at a volume level that was selected by the individual subject as comfortable and loud enough to understand the stimuli easily (ranging from 64 to 84 dBA). SNRs ranged from −30 dB to 0 dB, accounting for speech recognition in LP noises. The actual test started at the SNR after the first incorrect response, resulting in an individual starting level. The SRT was then calculated by averaging the last 20 out of 25 presentations. After completion of this test session a short break was given, followed by the retest (repetition of the OEC tests that were completed in the first session).
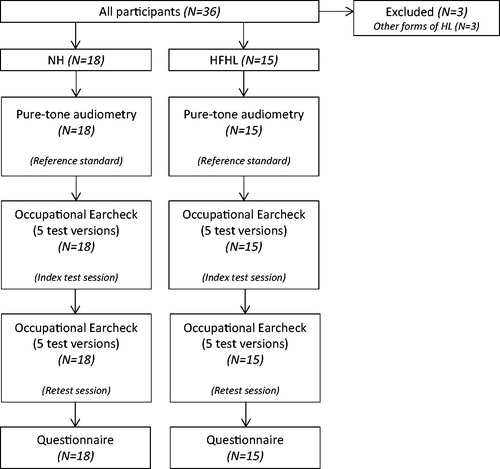
After completing the speech-in-noise tests, the participants were asked to fill in a short questionnaire. Details concerning age, gender, profession, occupational and non-occupational noise exposure, and use of hearing protection were requested. A flowchart of the measurement procedure is shown in . Total test duration (audiometry, speech-in-noise testing, retesting, and questionnaire, including breaks) was 1.5–2 h per subject. Participants were financially compensated.
Figure 2. Participant flowchart.
Results
Test results of NH and HFHL subjects on the OEC
Test results of younger NH and older HFHL subjects were compared, in order to assess how well the different OEC test versions discriminate between the two subject groups. Mean SRT results of the first test for each test version are presented in . The highest SRTs were obtained with the LTASS test version, while the lowest results are found for LP 2 and LP 4, the LP filtered versions with a noise floor of −15 dB. SRTs of NH and HI subjects for all test versions were compared by means of independent samples t-tests. The results are presented in . The differences in test results between groups were significant for all test versions. The difference in SRT scores was greater for the LP versions compared to the LTASS version.
Figure 3. Mean SRT in dB SNR, for NH and HFHL subjects, for all test versions (OEC test). Error bars represent 95% confidence intervals.
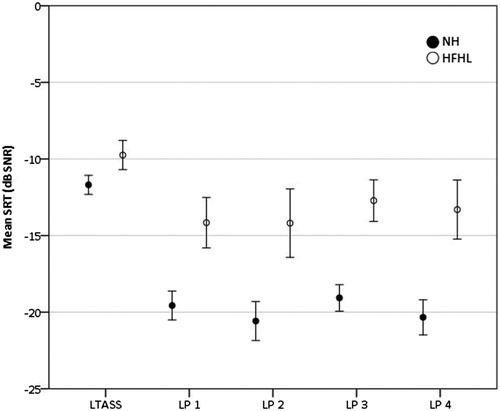
Table 3. Mean differences in SRT (dB SNR) (SD) for NH and HFHL subjects.
Sensitivity and specificity for NIHL
A receiver operating characteristics (ROC) analysis was performed to assess the monaural sensitivity (percentage HI subjects correctly classified as being HI), and specificity (percentage NH subjects correctly classified as being NH) of the different test versions of the OEC. A cut-off value for a dichotomous pass/fail outcome was chosen, based on a proper trade-off between sensitivity, and specificity values. Area under the curve (AUC), sensitivity, specificity and cut-off values for all test versions are shown in . The highest AUC value (0.98), and the highest sensitivity (93%) and specificity (94%) were found for test version LP 3.
Table 4. ROC area, sensitivity and specificity, and cut-off value for pass/fail, for all test versions.
Test validity
In order to assess the validity of the OEC, the SRT results of the OEC tests were compared to the pure-tone audiogram. Pearson correlation coefficients for SRT, and the PTA of the frequencies important for overall speech intelligibility (PTA0.5,1,2,4), and the PTA of the higher noise-sensitive frequencies (PTA3,4,6) for all test versions are shown in . Correlations for all subjects, and for HFHL subjects only are given. For all subjects, the LP versions correlated slightly better with PTA compared to the LTASS version. For all subjects, SRT results of LP 2, LP 3 and LP 4 in particular were highly correlated with PTA3,4,6 (r = 0.83 to r = 0.85). A scatterplot showing SRT results against PTA3,4,6 for LP3, separated for NH and HFHL subjects, is presented in (upper figure). For the total group, all correlations were statistically significant. For the HFHL subjects, the correlations with PTA3,4,6 were significant.
Figure 4. Scatterplots of SRT values against PTA3,4,6 (upper figure), and test against retest results (lower figure), for test version LP 3, for NH and HFHL subjects.
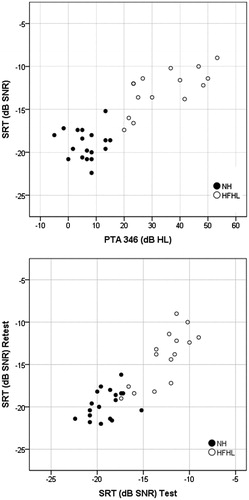
Table 5. Bivariate correlation coefficients (Pearson’s r) of the SRT values against the PTA of the frequencies 0.5, 1, 2, 4 kHz (PTA0.5,1,2,4) and 3, 4, 6 kHz (PTA3,4,6) for all test versions (OEC test).
Test reliability
The test reliability was assessed in several ways. First, the test–retest variability was studied by analysing test and retest results. Then, the mean within-subject SD was calculated to assess the consistency of the test results. To get an insight into the degree of agreement between test and retest results, the ICC was calculated. Finally, to assess the precision of the test, psychometric functions were determined for all test versions. Test reliability measures are shown in .
Table 6. Test–retest characteristics of NH and HFHL subjects.
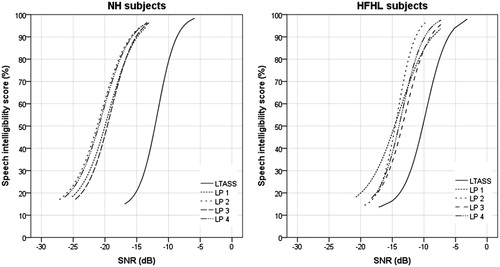
Paired samples t-tests showed that there were small variations in test and retest results. The differences between test and retest were 1.2 dB SNR or smaller, and not significant for LTASS, LP 1 and LP 2. The mean within-subject SD was calculated by dividing the SD of the differences by the square root of 2. Mean within-subject SDs of 1.0–1.7 dB were found, with the smallest value for the LTASS version. A high degree of agreement was found between test and retest results of all subjects, for all LP versions, with ICCs of 0.84–0.89. A scatterplot showing test against retest results for LP3, separated for NH and HFHL subjects, is presented in (lower figure). The psychometric functions for all test versions were determined by means of logistic regression, with the speech intelligibility (percentage correct words) as a function of the SNR. For this purpose, the SNRs of all presentations within a test were corrected by the individual SRT of that test. Then the data of all users, and of NH and HFHL subjects separately, were pooled for each test version. The model took into account the guess level γ resulting from the closed set of eight words (1/8 = 0.125). The functions for NH and HFHL subjects separately are presented in . The psychometric functions were shifted to the average SRT at 50% for each test version. Differences were found in the steepness of the slopes of the functions for the different test versions for the total group. The LTASS and LP 2 yielded the steepest slopes (14.8%/dB SNR and 13.6%/dB SNR, respectively), followed by LP 3 and LP 4 (13.1%/dB SNR and 12.5%/dB SNR, respectively). LP 1 yielded a slightly shallower slope of 10.6%/dB SNR.
Figure 5. Psychometric functions for NH subjects (N = 18) (left), and for HFHL subjects (N = 15) (right), per test version.
Discussion
This study evaluated the optimised internet-based speech-in-noise self-test, the OEC, in young NH subjects and older subjects with HFHL.
Test results after optimisation
Overall, the improved OEC LP 3 version with a LP filtered stationary noise (with a cut-off frequency of 1.6 kHz and a −12 dB noise floor) appeared to be the most appropriate test, showing a reasonable sensitivity and specificity, and a strong correlation with PTA3,4,6 for the whole target group, while remaining reasonably reliable. Earlier work showed that the original OEC was not yet suitable for NIHL screening purposes (Leensen et al, Citation2011a). After adapting the speech and noise material of the OEC, substantial improvements in test characteristics were attained. A higher specificity of 94% was found. Also, a better correlation with PTA3,4,6 was achieved. The original test and the improved test were both evaluated in a different study sample, though both study samples showed similarities in demographic distribution. In another study a similar online speech-in-noise test developed for NIHL-screening among teenagers, the Earcheck, was also improved by filtering of the masking noise (Leensen et al, Citation2011b). Earcheck with LP filtered noise discriminated best between NH and NIHL, and improved test sensitivity to 95%. In this study the LP filtering resulted in test improvements in the same order of magnitude as those that were found for Earcheck.
Sensitivity and specificity for HFHL
As a proof of concept, mean SRT results of younger NH subjects were compared to mean SRT results of older HFHL subjects. This demonstrated the feasibility of the test, as the test was able to distinguish between subjects with and without HFHL. The test versions with LP noises differentiated better between NH, and HFHL performance as compared to the unfiltered version. LP 2 and 4 showed the highest variation in SRT results. This may due to the lower noise floors, resulting in a higher masking release. Therefore, LP 3 appeared to be the best version, with a large mean SRT difference of about 6 dB SNR, and a low SD. The discriminative power of LP 3 was also reflected in the highest values for sensitivity and specificity, respectively 93 and 94%. The results can be well compared with the results of Vlaming et al (Citation2014). They developed two high frequency (HF) tests, both with a LP filtered speech shaped noise masker, one using digit triplets, and one using CVC words. For the comparable HF-CVC test a sensitivity of 87% and a specificity of 94% was reported, using a similar definition of HFHL (i.e. PTAHF>20 dB).
Of the 18 NH subjects, one subject had a high SRT (of −15.2 dB SNR), and was therefore incorrectly classified. The subject was 52 years old, and had no specialties in the pure-tone audiogram (all hearing levels were 20 dB HL or better). For the retest, this subject obtained a much lower SRT of −20.4 dB SNR. This subject was assigned to a test sequence in which the LP 3 test version was presented first. This may have resulted in the large difference between test and retest. Of the 15 HFHL subjects, one subject obtained a low SRT of −17.4 dB SNR, and was therefore incorrectly classified. The subject was 60 years old, with a hearing level of 40 dB HL at 4 kHz (the hearing levels at all other frequencies were better than 20 dB HL). For the retest, the subject obtained a lower SRT of −19.0 dB SNR. For the retest, five HFHL subjects performed better, with SRTs smaller than the chosen cut-off value of −16.9 dB SNR. These subjects had a lower PTA3,4,6 as compared to the other HFHL subjects (mean PTA3,4,6 of 26 dB HL, and 38 dB HL, respectively). The test may therefore distinguish better between NH and more profound HFHL. Subjects with small degrees of HFHL may be classified incorrectly.
It is important to note, however, that this evaluation took place in a study sample which was not representative for the target group of noise-exposed employees. A two-gate design was used in order to establish a clearly defined group of known cases on the one hand, and healthy controls on the other. This biased selection resulted in significant age differences between the NH and the HI group. Moreover, this may have overrated the sensitivity and specificity of the test, as it became easier for the test to distinguish NH performance from HFHL performance. Subjects with other types of hearing loss, were excluded. This may have introduced an artefactual reduced variation, which may also have resulted in a biased estimation of the discriminative power of the test.
Test validity
Relatively high correlations of SRT results with the audiogram were found, especially with the higher noise-sensitive frequencies (PTA3,4,6). The strong correlation with the reference standard that was used for verification, reflected in a high criterion validity of the improved OEC. The correlations for the HFHL subjects group were lower, because of the smaller number of data points and greater variation in SRT.
Although the differences between the different OEC LTASS and LP versions were small, LP 3 showed the strongest correlations with PTA0.5,1,2,4 (r = 0.73), and even a higher correlation with the higher frequencies (r = 0.85), in all subjects. Vlaming et al (Citation2014) reported a similar correlation with PTAHF of 0.79, and 0.82, for the high frequency triplet and CVC tests, respectively. Jansen et al (Citation2014) compared the broadband French digit triplet test (DTT) with a CVC test in standard speech-shaped noise, and with the CVC test in a LP filtered masking noise. They found comparable correlations with the higher frequencies (PTA2,3,4,6) for the DTT (r = 0.85), and the CVC test in LP filtered noise (r = 0.83).
Test reliability
Overall, the improved OEC had a better test reliability compared to the original OEC. Though the LP filtering of the masking noise did result in a loss of reliability compared to without the filtering.
The original OEC had a test–retest difference of 0.5 dB (Leensen et al, Citation2011a), while for the improved OEC in broadband noise this was 0.3 dB, though not significant. The test–retest differences for the improved OEC in LP noises were greater, although not significant for LP1 and LP 2. For LP 3, a significant mean test–retest difference of 1.0 dB was found. The test–retest differences were greater for HFHL subjects, which is also reflected in the lower ICC of 0.68. Due to the applied measurement procedure (where a test and a retest session were compared, and in which the same word material was used in five different noise conditions within one session), the test–retest differences found in this study do not imply the expected learning effects in a screening context. Though, the applied procedure was necessary in order to select the most appropriate masking noise condition. The learning effect for OEC in a practical setting, in which the same word material is presented multiple times in the same noise conditions, needs to be established in future research. To eliminate a potential learning effect, OEC might have to be performed multiple times in a screening context.
The mean within-subject SD of the improved OEC in a broadband noise was smaller than those of the improved OEC in LP conditions. Jansen et al (Citation2014) reported similar measurement errors for the CVC test in broadband noise (1.0 and 1.1 dB, for the Flemish and French versions), and for the CVC test in LP filtered noise (1.2 and 1.6 dB for the Flemish and French versions).
The original OEC had a slope of 11.0%/dB SNR (Leensen et al, Citation2011a) and 11.6%/dB SNR. After homogenisation of the speech material, the slope of the improved OEC in stationary broadband noise was found to be 14.8%/dB SNR. The LP filtering of the noise, however, resulted in shallower slopes. LP 3 had a slope of 13.1%/dB SNR, which still surpassed the original broadband test. Vlaming et al (Citation2014) reported a comparable slope of 12.1%/dB SNR for the HF CVC test. The slope that was found for OEC LP 3 was somewhat shallower as compared to the slopes that were reported for the DTT (Smits et al, Citation2004; Jansen et al, Citation2010), and for the HF-triplet test (Vlaming et al, Citation2014).
Implications and future research
The current study was performed in a laboratory setting in a soundproof booth. To study whether the OEC is conceptually right, it was important to evaluate the test in clearly defined NH and HFHL groups under controlled conditions. However, the test is developed for occupational screening and monitoring purposes, and expected to be performed in poorly controlled, occupational environments. The OEC should be evaluated in samples of noise-exposed subjects with an unknown hearing status, and in more realistic occupational conditions. This is needed in order to study test properties more accurately, such as learning effects, and sensitivity and specificity, to establish an appropriate cut-off value for the pass/fail categories.
Conclusions
An internet-based speech-in-noise self-test, the OEC was designed as a screening test for occupational noise-induced HFHL. This test was optimised, and validated among younger NH listeners and older listeners with HFHL, most probably related to noise exposure. The improved OEC, using a more homogenous set of monosyllables with high-frequency consonants and paired vowels, in combination with a LP filtered masking noise (with a cut-off frequency of 1.6 kHz, in combination with a noise floor of −12 dB) is an appropriate and reasonably reliable test for the discrimination between the study groups in a well-controlled setting. A good discriminative power, reflected in reasonable sensitivity and specificity values, was achieved. Awaiting further evaluation in the field, this study shows that the OEC is a potential tool for online self-screening and monitoring in occupational settings.
| Abbreviations | ||
| OEC | = | Occupational Earcheck |
| HFHL | = | high-frequency hearing loss |
| NH | = | normal-hearing |
| LP | = | low-pass |
| NIHL | = | noise-induced hearing loss |
| SNR | = | signal-to-noise ratio |
| SRT | = | speech reception threshold |
| ICC | = | intra-class correlation coefficient |
| PTA | = | pure-tone average |
| HI | = | hearing-impaired |
| CVC | = | consonant-vowel-consonant |
| LTASS | = | long-term average speech spectrum |
| SD | = | standard deviation |
| SI(I) | = | speech intelligibility (index) |
| ROC | = | receiver operating characteristics |
| AUC | = | area under the curve |
| HF | = | high-frequency |
Declaration of interest
No potential conflict of interest was reported by the authors.
Acknowledgements
The authors would like to thank Dr. I. de Ronde-Brons and L. Ruhaak, MSc. for performing the audiometric measurements, and Zicht Online (https://zicht.nl/) for implementing and adapting the online tests. We would like to thank K. S. Rhebergen for developing the speech and noise material. This study was funded by the Dutch National Hearing Foundation.
Parts of this article were presented at the following professional meeting: The Second International Meeting on Internet and Audiology. September 2015, Snekkersten, Denmark. Title: Validation and evaluation of the Occupational Earcheck.
References
- Albrecht J., Elewout L.V., Verhage L. & Verweij C. 2005. Oorcheck: De validering van een interactief screeningsinstrument. Internal report (in Dutch). Internal report, LUMC, Leiden.
- Bosman A.J. 1989. Speech perception by the hearing impaired [thesis] (in Dutch). Utrecht, the Netherlands: University of Utrecht.
- Brookhouser P.E. 1994. Prevention of noise-induced hearing loss. Prev Med, 23, 665–669.
- Culling J.F., Zhao F. & Stephens D. 2005. The viability of speech-in-noise audiometric screening using domestic audio equipment. Int J Audiol, 44, 691–700.
- Ellis N., Kuijpers M., van der Pijl S. & Verbiest E. 2006. Ontwikkeling van een gehoorscreening voor het bedrijfsleven. Internal report (in Dutch), LUMC Leiden.
- Flamme G.A., Stephenson M.R., Deiters K.K., Hessenauer A., Van Gessel D.K., et al. 2014. Short-term variability of pure-tone thresholds obtained with TDH-39P earphones. Int J Audiol, 53, S5–S15.
- Hsu T., Wu C., Chang J., Lee S. & Hsu C. 2013. Determinants of bilateral audiometric notches in noise-induced hearing loss. Laryngoscope, 123, 1005–1010.
- Jansen S., Luts H., Dejonckere P., van Wieringen A. & Wouters J. 2014. Exploring the sensitivity of speech-in-noise tests for noise-induced hearing loss. Int J Audiol, 53, 199–205.
- Jansen S., Luts H., Wagener K.C., Frachet B. & Wouters J. 2010. The French digit triplet test: A hearing screening tool for speech intelligibility in noise. Int J Audiol, 49, 378–387.
- Kramer S.E., Kapteyn T.S. & Festen J.M. 1998. The self-reported handicapping effect of hearing disabilities. Audiology, 37, 302–312.
- Leensen M.C., de Laat J.A. & Dreschler W.A. 2011a. Speech-in-noise screening tests by internet, part 1: Test evaluation for noise-induced hearing loss identification. Int J Audiol, 50, 823–834.
- Leensen M.C., de Laat J.A., Snik A.F. & Dreschler W.A. 2011b. Speech-in-noise screening tests by internet, part 2: Improving test sensitivity for noise-induced hearing loss. Int J Audiol, 50, 835–848.
- Leensen M.C. & Dreschler W.A. 2013a. The applicability of a speech-in-noise screening test in occupational hearing conservation. Int J Audiol, 52, 455–465.
- Leensen M.C. & Dreschler W.A. 2013b. Speech-in-noise screening tests by internet, part 3: Test sensitivity for uncontrolled parameters in domestic usage. Int J Audiol, 52, 658–669.
- May J. 2000. Occupational hearing loss. Am J Ind Med, 37, 112–120.
- Molander P., Nordqvist P., Öberg M., Lunner T., Lyxell B., et al. 2013. Internet-based hearing screening using speech-in-noise: Validation and comparisons of self-reported hearing problems, quality of life and phonological representation. BMJ, 3, e003223.
- Paglialonga A., Tognola A. & Grandori F. 2014. A user-operated test of supra-treshold acuity in noise for adult hearing screening: The SUN (Speech Understanding in Noise) test. Comput Biol Med, 52, 66–72.
- Plomp R. 1986. A signal-to-noise ratio model for the speech-reception threshold of the hearing impaired. J Speech Hear Res, 29, 146–154.
- Smits C., Goverts T. & Festen J.M. 2013. The digits-in-noise test: Assessing auditory speech recognition abilities in noise. J Acoust Soc Am, 133, 1693–1706.
- Smits C., Kapteyn T.S. & Houtgast T. 2004. Development and validation of an automatic speech-in-noise screening test by telephone. Int J Audiol, 43, 15–28.
- Smits C., Merkus P. & Houtgast T. 2006. How we do it: The Dutch functional hearing-screening tests by telephone and internet. Clin Otolaryngol, 31, 436–440.
- Smoorenburg G.F. 1992. Speech reception in quiet and in noisy conditions by individuals with noise-induced hearing loss in relation to their tone audiogram. J Acoust Soc Am, 91, 421–437.
- Stenfelt S., Janssen T., Schirkonyer V. & Grandori F. 2011. E-health technologies for adult hearing screening. Audiol Res, 1, 55–57.
- van der Molen H., Kuijer P., de Groene G., Bakker J., Sorgdrager B., et al. 2014. Beroepsziekten in cijfers 2014 (in Dutch). Amsterdam, Nederlands Centrum voor Beroepsziekten, Coronel Instituut voor Arbeid en Gezondheid, AMC, UvA.
- Vlaming M.S.M.G., MacKinnon R.C., Jansen M. & Moore D. 2014. Automated screening for high-frequency hearing loss. Ear Hear, 35, 667–679.
- Wagener K.C. & Brand T. 2005. Sentence intelligibility in noise for listeners with normal hearing and hearing impairment: Influence of measurement procedure and masking parameters. Int J Audiol, 44, 144–156.
- Watson C.S., Kidd G.R., Smits C. & Humes L.E. 2012. Telephone screening tests for functionally impaired hearing: Current use in seven countries and development of a US version. J Am Acad Audiol, 23, 757–767.
- Williams-Sanchez V., McArdle R.A., Wilson R.H., Kidd G.R., Watson C.S., et al. 2014. Validation of a screening test of auditory function using the telephone. J Am Acad Audiol, 25, 937–951.