
Abstract
Objective: The aim of this study was to assess the feasibility of recording speech-ABRs from cochlear implant (CI) recipients, and to remove the artefact using a clinically applicable single-channel approach.
Design: Speech-ABRs were recorded to a 40 ms [da] presented via loudspeaker using a two-channel electrode montage. Additionally, artefacts were recorded using an artificial-head incorporating a MED-EL CI with stimulation parameters as similar as possible to those of three MED-EL participants. A single-channel artefact removal technique was applied to all responses.
Study sample: A total of 12 adult CI recipients (6 Cochlear Nucleus and 6 MED-EL CIs).
Results: Responses differed according to the CI type, artefact removal resulted in responses containing speech-ARB characteristics in two MED-EL CI participants; however, it was not possible to verify whether these were true responses or were modulated by artefacts, and artefact removal was successful from the artificial-head recordings.
Conclusions: This is the first study that attempted to record speech-ABRs from CI recipients. Results suggest that there is a potential for application of a single-channel approach to artefact removal. However, a more robust and adaptive approach to artefact removal that includes a method to verify true responses is needed.
Introduction
Current clinical outcome measures to assess speech detection or speech-in-noise performance in cochlear implant (CI) recipients are all behavioural measures that require participation and behavioural responses from the CI recipient (e.g. Arthur Boothroyd monosyllabic words (Boothroyd Citation1968), Bamford-Kowal-Bench sentences (Bench, Kowal, and Bamford Citation1979), Hearing in Noise Test (Nilsson, Soli, and Sullivan Citation1994)). These same outcome measures are also used in CI research (e.g. Vickers et al. Citation2009; Heywood et al. Citation2016). Such behavioural measures cannot be used with infants or with some children and adults with additional needs (e.g. developmental delay, intellectual disabilities or other disabilities). Therefore, there is a need to develop an objective measure that does not require behavioural responses from the CI recipient.
Current and past work has focussed on auditory late (cortical) evoked responses (ALR) as an outcome measure of detection and discrimination of sounds in adults and children with CIs (e.g. Sharma, Dorman, and Spahr Citation2002; Zhang et al. Citation2010). Although ALRs have been successfully recorded in adults and children with CIs (e.g. Gordon, Wong, and Papsin Citation2013; Visram et al. Citation2015), ALRs as objective outcome measures have not yet transitioned to standard clinical practice. This may be owing to several factors relating to the physiological characteristics of ALRs such as (i) ALRs do not mature and become adult like until around the age of 16–18 years; (ii) ALRs are influenced by attention and state of arousal where the response is more pronounced when the subject is attending to the stimulus compared to when not attending to the stimulus, which makes the response more variable within and across subjects and across test sessions and (iii) ALRs are influenced by sedation and anaesthesia (Hall Citation2015). An alternative to ALRs are auditory brainstem responses (ABR) that have some advantages over ALRs such as (i) they mature early in life; (ii) they can be reliably measured in infants, children, and adults with additional needs; (iii) they are more consistent than ALRs within and across subjects and across test sessions and (iv) they are not influenced by attention, state of arousal or sedation and anaesthesia (Hall Citation2015). ABRs can be recorded in response to short consonant-vowel speech stimuli (speech-ABR). Speech-ABR studies on normal-hearing adults and children have shown that speech-ABRs (i) follow the spectral and temporal features of the stimulus used to evoke them, therefore may be a good candidate for an objective outcome measure of brainstem speech encoding (e.g. Johnson, Nicol, and Kraus Citation2005; Kraus and Nicol Citation2005; Chandrasekaran and Kraus Citation2010; BinKhamis et al. Citation2019); (ii) are recordable from infancy to older adulthood and repeatable within and across sessions (e.g. Song, Nicol, and Kraus Citation2011a; Hornickel, Knowles, and Kraus Citation2012; Skoe et al. Citation2015) and (iii) addition of background noise results in reduced response amplitude, delayed response timing, and overall degradation in response quality. These changes have been linked to performance on behavioural measures where individuals with more degradation in their speech-ABRs (e.g. smaller amplitudes, delayed timing) due to background noise performed worse on behavioural speech-in-noise measures, suggesting that speech-ABRs may be a good candidate for an objective measure of behavioural speech-in-noise performance (e.g. Anderson et al. Citation2011; Parbery-Clark, Strait, and Kraus Citation2011; Song, Skoe, Banai and Kraus Citation2011b; BinKhamis et al. Citation2019).
To date, there is no published literature on speech-ABRs in CI recipients. This is likely owing to the large electrical artefact that is generated from the CI that may obscure the speech-ABR (Kraus et al. Citation2009). Several CI artefact removal techniques have been reported in the literature; however, these techniques were only applied to ALRs and auditory steady-state responses (ASSR) but were not attempted for speech-ABRs. One of the commonly used CI artefact removal techniques is Independent Component Analysis (ICA). ICA has been successfully used in CI research to remove the CI artefact from acoustically evoked ALRs (e.g. Viola et al. Citation2011; Bakhos et al. Citation2012; Miller and Zhang Citation2014; Sandmann et al. Citation2015) and from electrically evoked cortical (40 Hz) ASSRs (e.g. Deprez et al. Citation2018). Other artefact removal techniques that have been successfully applied in CI research to electrically evoked responses include subtraction (e.g. Friesen and Picton Citation2010) that was applied to ALRs, linear interpolation (e.g. Gransier et al. Citation2016; Deprez et al. Citation2017a) and template subtraction (e.g. Deprez et al. Citation2017b) that were applied to ASSRs. In terms of acoustically evoked responses, ICA appears to be the most commonly used method to remove the CI artefact. However, ICA requires a large number of recording electrodes and complex signal processing that is currently not feasible to apply in a clinical setting. Additionally, it is generally recommended to use a short stimulus in order for the CI artefact not to overlap in time with the response (Gilley et al. Citation2006). However, using a short stimulus that does not overlap with the response cannot be applied to speech-ABRs due to the early occurrence of the response. McLaughlin et al. (Citation2013) reported a CI artefact removal technique that they applied to acoustically evoked ALRs recorded with one channel (i.e. three electrodes) in response to long tone bursts (100, 300 and 500 ms) that overlap in time with the ALR, this technique, described in detail in Supplement 2, Section 1, is promising as it may potentially be applied in a clinical setting.
The aim of this study was to assess the feasibility of applying the McLaughlin et al. (Citation2013) artefact removal technique on speech-ABRs recorded to the 40 ms [da] from adult CI recipients.
Methods
Participants
Twelve post-lingual adult CI recipients (age: mean = 49.08 years, SD = 6.43, range = 39–60, 9 males, 6 with Cochlear Nucleus CIs and 6 with MED-EL CIs) participated in this study (see Supplement 1 for participant information). All participants provided written informed consent. This study was ethically approved by National Health Services, England (IRAS ID: 226216). Participants were compensated for time and travel expenses. CI recipients from the Manchester Auditory Implant Centre were invited to participate in this study, letters were posted to potential participants and the first 12 that expressed interest were enrolled.
Auditory brainstem responses
Equipment
Speech-ABRs were collected with Cambridge Electronic Design Ltd. (CED, Cambridge, UK) “Signal” (Cambridge, UK) software version 5.11 using a CED power 1401 mkII data acquisition interface (Cambridge Electronic Design Ltd.) and a Digitimer 360 isolated 8-channel patient amplifier (Digitimer Limited, Hertfordshire, UK). The 40 ms [da] (described in Banai et al. Citation2009) was presented from the “Signal” software through the power 1401 mkII and routed through a Tucker-Davis Technologies (TDT, Alachua, FL) PA5 programmable attenuator and a TDT HB7 Headphone Driver to a Fostex Personal Monitor 6301B loudspeaker (Fostex Company, Foster Electric Co. Ltd., Tokyo, Japan). Loudspeaker was positioned at 45° azimuth, 1.1 metres away from the speech processor microphone. Stimulus was calibrated in dB-A using a Brüel and Kjaer type 2250 (Brüel and Kjaer, Naerum, Denmark) sound level metre.
Recording parameters
“Signal” software sampling configuration was set to gap-free sweep mode, sample rate of 125,000 Hz (used by McLaughlin et al. Citation2013), pulses with a resolution of 0.01 ms as the output type, and outputs were set at absolute levels and absolute times. Online second-order Butterworth filtering was 100 Hz (high-pass filter) and 3000 Hz (low-pass filter), filter settings were based on 40 ms [da] speech-ABR literature (e.g. Anderson et al. Citation2013; Skoe et al. Citation2015); 100 Hz high-pass filter was used to ensure cortical response components were excluded from the recordings. Stimulus was presented in sound field at 70 dB-A at a rate of 9.1 stimuli per second. Stimulus polarity was reversed using Adobe Audition CC (2015.1, build 8.1.0.162) to evoke speech-ABRs using two opposite stimulus polarities and remove loudspeaker stimulus artefacts (recommended by Skoe and Kraus Citation2010). Two-blocks of 2500 epochs at each stimulus polarity were collected for each participant for a total of 10,000. Online artefact rejection was switched off due to the large CI electrical artefact. Two-channel vertical electrode montage recording with Cz active, earlobe reference (A1 and A2), and high forehead ground (Fz) was used, electrode sites were based on the international 10-20 EEG system. Two-channel recording was used in order to evaluate artefact removal from the contralateral channel (opposite to CI) using the estimated artefact from the ipsilateral channel (same side as CI) versus the estimated artefact from the contralateral channel. The CI artefact is expected to be larger in the ipsilateral channel; therefore, estimating the artefact from this channel and using it to remove the artefact from contralateral channel responses may be more successful than estimating the artefact from the contralateral channel.
Participant preparation and recording environment
Skin at electrode sites was prepared using Nuprep Skin Prep Gel. Ag/AgCI 10 mm disposable disc electrodes were placed on prepared sites with Ten20 Conductive EEG paste. Electrode impedances were below 3 kΩ, impedances between electrodes were balanced and below 1 kΩ. Impedance balancing <1 kΩ was essential to reduce the CI artefact (McLaughlin et al. Citation2013).
Participants lay in a comfortable recliner in a double-wall soundproof booth, and were instructed to remain relaxed with their eyes closed to reduce myogenic artefacts and eye blinks. Recordings were conducted with the participant’s own CI speech processor using their everyday settings.
Speech-ABR processing and artefact removal
Speech-ABR processing and artefact removal were performed offline using MATLAB R2015a (MathWorks, Natick, MA). Artefact removal method was based on McLaughlin et al. (Citation2013), this was attempted at different low-pass (LP) filter cut-off frequencies and with estimating artefacts from either the ipsilateral or contralateral channel (details in Supplement 2, Section 1). Responses pre- and post-artefact removal were visually inspected for waveform morphology (whether they were consistent with speech-ABRs to the 40 ms [da] containing an onset response, envelope following response, and offset response), response amplitude (whether they were the appropriate size for brainstem responses, amplitudes will be called “amplitude-BAR” before processing and artefact removal, and “amplitude-PAR” post artefact removal) and artefact (whether it was high or low in frequency).
Results
Before artefact removal, responses were generally excessively large in amplitude-BAR (μV) and contained high-frequency and low-frequency artefacts. Applying artefact removal at different LP filter cut-off frequencies resulted in a slight reduction in response amplitude-PAR with decrease in cut-off frequency in some but not others. The 300 Hz cut-off frequency resulted in the largest amplitude-PAR reduction and removal of high-frequency artefacts. Additionally, estimating artefacts from the ipsilateral channel did not have any advantage over estimating artefacts from the contralateral channel and in some cases resulted in responses that were larger in amplitude-PAR (artefact removal examples at different LP cut-offs in Supplement 2, Section 2). Therefore, responses were evaluated using estimated artefacts from the same contralateral channel at 300 Hz cut-off frequency.
There were clear differences in responses depending on the CI type and processing strategy. Responses from participants with Cochlear Nucleus 22 CIs (CI01 and CI04) using SPEAK bipolar (BP) processing were smallest in amplitude-BAR and contained mainly a low-frequency artefact that resembled the stimulus envelope. Artefact removal resulted in minimal changes in responses and these responses were likely artefacts rather than speech-ABRs. Responses from participants with Cochlear Nucleus 24 CIs using ACE monopolar (MP) processing were large in amplitude-BAR and contained mainly a low-frequency artefact that followed the stimulus envelope with some superimposed high-frequency artefact. Artefact removal had a limited effect on response amplitude-PAR in two participants (CI05 and CI10), and responses after artefact removal from the other two participants (CI06 and CI12) did not resemble speech-ABRs. Responses from participants with MED-EL CIs using FS4 MP processing were large in amplitude-BAR with an excessive high-frequency artefact. These responses had the greatest reduction in amplitude-PAR after artefact removal compared to participants with Cochlear Nucleus CIs. After artefact removal, responses from two MED-EL participants (CI07 and CI08) contained speech-ABR characteristics combined with residual artefact (see for CI08). However, it was difficult to conclude whether they were true responses as speech-ABR amplitude-PARs were larger than amplitudes previously reported for normal-hearing individuals (e.g. BinKhamis et al. Citation2019). Also, latencies were on average 0.51 ms (CI07) and 1.72 ms (CI08) earlier than the peaks in the estimated artefact, making them similar (but not identical) to the estimated artefact (see for CI08). Responses from two participants (CI02 and CI09) did not resemble speech-ABRs, while responses from the other two participants (CI03 and CI11) were large in amplitude-PAR and did not resemble speech-ABRs (remaining participant figures in Supplement 3, Section 1). In an attempt to verify whether artefact removal was successful for CI07 and CI08, Wagner et al. (Citation2018) were approached and agreed to record artefacts based on participant MAPs. Artefacts based on the closest possible approximation to CI MAPs from three MED-EL participants (CI07, CI08 and CI09) were recorded using an artificial-head (details in Supplement 3, Section 2), the same artefact removal was applied to these recorded artefacts and resulting waveforms contained minimal residual artefact (see for one example, and Supplement 3, Section 2, for the other two). This suggests that it is possible that detected responses in CI07 and CI08 were true responses; however, estimated artefacts from these recordings were smaller in amplitude than those recorded from participants (e.g. versus ).
Figure 1. Contralateral responses (two sub-averages) from CI08 (MED-EL Concerto Flex 28 – FS4) showing (A) Response before processing (prior to filtering and artefact removal) that is very large in amplitude-BAR containing an excessive high-frequency artefact, (B) LP filtered response (300 Hz) that is smaller in amplitude than (A) with no high-frequency artefact, (C) artefact that was estimated from the LP filtered response and (D) final response after artefact removal that is much smaller in amplitude-PAR than (A) and (B) and contains speech-ABR characteristics combined with residual artefact. *Note that in order for the response to be visible in all subplots, the y-axis scale is not equal across sub-plots.
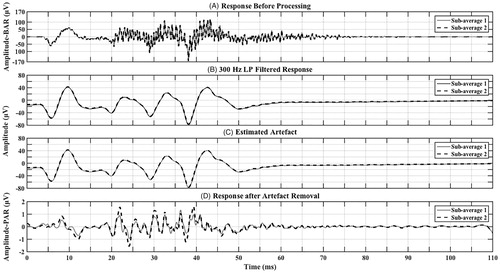
Figure 2. Contralateral responses (two sub-averages) from CI08 (MED-EL Concerto Flex 28– FS4) showing (A) Estimated artefact (as in ) with axes adjusted for better visualisation (x-axis from 0 to 70 ms). Triangles point to major peaks that are closest in latency to detected peaks in (B). Latencies are marked for each peak. Amplitudes (μV) are as follows 68.67 (first positive to first negative peak), negative peaks to preceding positive peak = 62.25, 76.73 and 66.98, respectively. (B) Response after artefact removal (as in ) with axes adjusted for better visualisation (x-axis: 0–70 ms, y-axis: −1.8–1.8 μV). Triangles point to potential speech-ABR peaks V, A, D, E, F and O, respectively. Latencies are labelled for each peak. Amplitude-PARs (μV) are as follows positive V to negative A = 0.96, D = 3.13, E = 1.12, F = 2.31 and O = 1.19 (measured as preceding positive peak to negative peak).
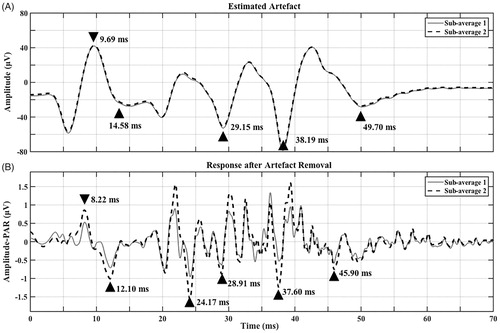
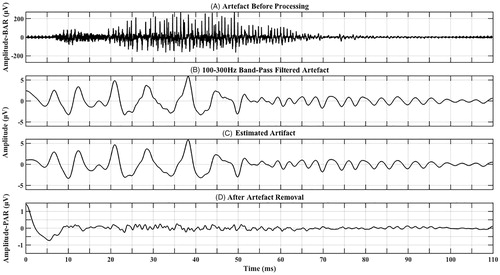
Figure 3. Artefact recorded based on a close approximation to CI08’s MAP showing (A) artefact before processing (prior to filtering and artefact removal) that is very large in amplitude-BAR containing an excessive high-frequency artefact, (B) Band-pass filtered artefact (100–300 Hz) that is smaller in amplitude than (A) with no high-frequency artefact, (C) artefact that was estimated from (B), and (D) final response after artefact removal that is much smaller in amplitude-PAR than both (A) and (B) suggesting that most of the artefact has been removed. *Note that in order for the response to be visible in all subplots, the y-axis scale is not equal across sub-plots.
Discussion
The aim of this study was to assess the feasibility of recording speech-ABRs from CI recipients using a clinically applicable recording setup combined with an artefact removal technique that has been applied to ALRs recorded using one channel and elicited with a longer stimulus that overlapped in time with the ALR (McLaughlin et al. Citation2013).
Results from this study showed that responses had different characteristics depending on the CI type and processing strategy. First, Cochlear Nucleus 22 CIs (SPEAK, BP) resulted in responses that resembled the 40 ms [da] envelope and had smallest amplitude-BAR compared to both Cochlear Nucleus 24 (ACE and MP) and MED-EL (FS4 and MP) CIs. It is not unexpected that BP would result in responses with smaller amplitude-BAR given that the reference electrode is intra-cochlear, which would restrict current flow within the cochlea, as opposed to MP processing where the reference electrode is extra-cochlear (located in the implant receiver/stimulator), and current flows between the intra-cochlear and extra-cochlear electrodes. Li et al. (Citation2010) also found that CI artefacts were smaller in BP versus MP processing when they recorded CI artefacts from an implanted chicken carcase. Although responses from participants with Cochlear Nucleus 22 implants were the appropriate amplitude-BAR and amplitude-PAR plus resembled speech-ABRs, it was difficult to conclude whether responses were artefacts or brainstem responses. CI artefacts from Cochlear Nucleus CIs follow the stimulus envelope (Wagner et al. Citation2018), which would result in waveforms that may resemble speech-ABRs. Given the smaller amplitude CI artefact (Li et al. Citation2010) and that CI artefacts from Cochlear Nucleus CIs follow the stimulus envelope (Wagner et al. Citation2018), it is more likely that responses recorded from participants with Cochlear Nucleus 22 CIs are artefacts rather than speech-ABRs. Second, Cochlear Nucleus 24 CIs (ACE and MP) resulted in responses that followed the 40 ms [da] envelope. However, they were much larger in amplitude-BAR than those recorded from Cochlear Nucleus 22 CIs. Artefact removal resulted in either minimal changes in responses or removal of artefacts with no residual speech-ABRs. Both SPEAK and ACE processing strategies transmit the stimulus envelope without its fine structure, this may explain the difficulty in extracting speech-ABRs from artefacts especially since artefacts would resemble speech-ABRs. Also, pitch is indirectly transmitted through these CIs via temporal modulations of envelope cues (Stickney et al. Citation2007). This indirect pitch encoding may not be sufficient enough to evoke speech-ABRs, as was the case in two participants with no residual speech-ABRs after artefact removal. Finally, MED-EL CIs (FS4 and MP) resulted in responses that were very large in amplitude-BAR with an excessive high-frequency artefact that was not present in Cochlear Nucleus CI responses. This may be explained by the higher stimulation rate used by MED-EL CIs compared to Cochlear Nucleus CIs (McLaughlin et al. Citation2013). Artefact removal resulted in removal of most of the artefact with either potentially detectable speech-ABRs or with no residual speech-ABRs, or in responses that were too large in amplitude-PAR to be speech-ABRs. These potentially detectable speech-ABRs were larger in amplitude-PAR than in normal-hearing individuals. However, large electric-ABR amplitudes (≥2 to 3 μV) have been reported in CI recipients (e.g. Brown et al. Citation2000; Firszt, Chambers, and Kraus Citation2002a; Firszt et al. Citation2002b). Also, larger electric-ABR compared to acoustic-ABR amplitudes have been shown in humans and in cats (e.g. van den Honert and Stypulkowski Citation1986; Gamgebeli et al. Citation2010). Suggesting that our larger amplitude-PARs may be true responses. With regards to the earlier (but similar) latencies between detected peaks and peaks in the estimated artefact, timing differences of responses from different brainstem structures are typically short; e.g. the difference in latency between click-ABR peak III (generated from the Superior Olivary Complex) and V (generated from the Lateral Lemniscus and Inferior Colliculus) is around 2 ms (Hall Citation2015). Therefore, a 2 ms difference is considered large enough to generate distinct brainstem responses. This suggests that the latency difference between detected peaks and estimated artefacts (at least in CI08, average 1.72 ms) may be large enough to consider the detected peaks true responses. However, this does not rule out the possibility that these were modulated by artefacts. Also, amplitude-PARs for CI08 were larger than those for CI07, following the same trend as the estimated artefact that was larger in CI08 than CI07. The FS4 processing strategy transmits the stimulus envelope and its fine structure (including pitch). This pitch encoding may be sufficient to evoke speech-ABRs, though it may also cause “stimulation bursts” in the recordings resembling the temporal fine structure of the stimulus that remained after artefact removal, resulting in responses containing speech-ABR characteristics. However, when artefact removal was applied to the three artefacts recorded by Wagner et al. (Citation2018) using an artificial-head, artefact removal was successful and consequently the obtained traces did not contain speech-ABR characteristics. Indicating that these “stimulation bursts” were not present after artefact removal. Thus it is possible that true speech-ABRs were detected in CI07 and CI08. Nonetheless, true speech-ABR detection cannot be confirmed with certainty given that (i) estimated artefacts from participant recordings were much larger in amplitude than those estimated from artificial-head recordings (ii) latencies between detected peaks and estimated artefact peaks from participant recordings were similar and (iii) speech-ABR amplitude-PARs followed the same trend as the estimated artefact amplitudes.
It is likely that the artefact removal technique was generally unsuccessful due to the complexity of the 40 ms [da] stimulus used in this study compared to the tone bursts used by McLaughlin et al. (Citation2013). The 40 ms [da] would result in a more complex CI artefact that is more difficult to resolve from the response. Also, brainstem response amplitudes are smaller than cortical response amplitudes as shown in 80-Hz brainstem ASSRs versus 40 Hz cortical ASSRs in normal-hearing individuals (e.g. Picton et al. Citation2003), and in brainstem versus cortical responses in individuals with CIs (e.g. Makhdoum et al. Citation1998). These smaller amplitude brainstem responses may be more difficult to extract from the artefact. Additionally, although electrical stimulation leads to increased phase-locking in the cats’ auditory nerve (e.g. Hartmann, Topp, and Klinke Citation1984; van den Honert and Stypulkowski Citation1984), phase-locking to electrical stimulation appears to be reduced in the cats’ brainstem (e.g. Clark Citation1969; Middlebrooks and Snyder Citation2010) potentially affecting measurability of speech-ABRs in some CI recipients. Another issue may be that the different CI pitch/fine structure processing strategies may be influencing the capacity of the CI to evoke speech-ABRs. Alternatively, it may be that artefact removal is also removing or masking some of the neural response resulting in the response becoming undetectable.
In summary, extending the artefact removal technique developed by McLaughlin et al. (Citation2013) to speech-ABRs collected in this study was potentially successful on responses from two of 12 participants. These two participants both had MED-EL CIs. Additionally, artefact removal appeared successful when it was applied to three MED-EL artefacts recorded using an artificial-head. Which indicates that this method of artefact removal, or an adaptive version of it, may be suitable for use with some MED-EL CI recipients.
Conclusions
To the best of our knowledge, this is the only study that attempted to record speech-ABRs from CI recipients. Results from this study show that it remains challenging to remove the CI artefact from speech-ABRs recorded using two-channels. However, successful artefact removal from three MED-EL recordings made with an artificial-head, and potentially successful artefact removal from two of our MED-EL participants suggests that an expansion of the single channel approach proposed by McLaughlin et al. (Citation2013) may potentially be applicable, with the development of a more robust and adaptive method to model the CI artefact in order to be able to remove each participant-specific CI artefact from their brainstem responses. Plus, there is a need to develop methods to verify that responses after artefact removal are not modulated by artefacts. Thus, more work is needed on CI artefact removal techniques from speech-ABRs.
Supplemental Material
Download PDF (5 MB)Supplemental Material
Download PDF (2.8 MB)TIJA-2019-04-0129-File007.pdf
Download PDF (121.4 KB)Acknowledgements
We thank Dr Michael Stone for his technical advice relating to the revised version of this manuscript, Dr Anita Wagner, Liana Wobben and all the authors of Wagner et al. (Citation2018) from the University of Groningen, Groningen, the Netherlands for recording the artefacts, the Auditory Neuroscience Laboratory, Department of Communication Sciences, Northwestern University, Evanston, IL, USA for the provision of stimuli (40 ms [da]) used in this study.
Disclosure statement
No potential conflict of interest was reported by the authors.
Additional information
Funding
Related Research Data
References
- Anderson, S., A. Parbery-Clark, T. White-Schwoch, and N. Kraus. 2013. “Auditory Brainstem Response to Complex Sounds Predicts Self-Reported Speech-in-Noise Performance.” Journal of Speech, Language, and Hearing Research 56 (1): 31–43. doi:10.1044/1092-4388(2012/12-0043).
- Anderson, S., A. Parbery-Clark, H. G. Yi, and N. Kraus. 2011. “A Neural Basis of Speech-in-Noise Perception in Older Adults.” Ear and Hearing 32 (6): 750–757. doi:10.1097/AUD.0b013e31822229d3.
- Bakhos, D., S. Roux, A. Robier, F. Bonnet-Brilhault, E. Lescanne, and N. Bruneau. 2012. “Minimization of Cochlear Implant Artifact in Cortical Auditory Evoked Potentials in Children.” International Journal of Pediatric Otorhinolaryngology 76 (11): 1627–1632. doi:10.1016/j.ijporl.2012.07.034.
- Banai, K., J. Hornickel, E. Skoe, T. Nicol, S. Zecker, and N. Kraus. 2009. “Reading and Subcortical Auditory Function.” Cerebral Cortex 19 (11): 2699–2707. doi:10.1093/cercor/bhp024.
- Bench, J., A. Kowal, and J. Bamford. 1979. “The BKB (Bamford-Kowal-Bench) Sentence Lists for Partially-Hearing Children.” British Journal of Audiology 13 (3): 108–112. doi:10.3109/03005367909078884.
- BinKhamis, G., A. Léger, S. L. Bell, G. Prendergast, M. O’Driscoll, and K. Kluk. 2019. “Speech Auditory Brainstem Responses: Effects of Background, Stimulus Duration, Consonant–Vowel, and Number of Epochs.” Ear and Hearing 40(3): 659–670. doi:10.1097/AUD.0000000000000648.
- Boothroyd, A. 1968. “Developments in Speech Audiometry.” British Journal of Audiology 2 (1): 3–10. doi:10.3109/00381796809075436.
- Brown, C. J., M. L. Hughes, B. Luk, P. J. Abbas, A. Wolaver, and J. Gervais. 2000. “The Relationship between EAP and EABR Thresholds and Levels Used to Program the Nucleus 24 Speech Processor: Data from Adults.” Ear and Hearing 21 (2): 151–163. doi:10.1097/00003446-200004000-00009.
- Chandrasekaran, B., and N. Kraus. 2010. “The Scalp-Recorded Brainstem Response to Speech: Neural Origins and Plasticity.” Psychophysiology 47 (2): 236–246. doi:10.1111/j.1469-8986.2009.00928.x.
- Clark, G. M. 1969. “Responses of Cells in the Superior Olivary Complex of the Cat to Electrical Stimulation of the Auditory Nerve.” Experimental Neurology 24 (1): 124–136. doi:10.1016/0014-4886(69)90010-7.
- Deprez, H., R. Gransier, M. Hofmann, A. van Wieringen, J. Wouters, and M. Moonen. 2017a. “Characterization of Cochlear Implant Artifacts in Electrically Evoked Auditory Steady-State Responses.” Biomedical Signal Processing and Control 31:127–138. doi:10.1016/j.bspc.2016.07.013.
- Deprez, H., R. Gransier, M. Hofmann, A. van Wieringen, J. Wouters, and M. Moonen. 2017b. “Template Subtraction to Remove CI Stimulation Artifacts in Auditory Steady-State Responses in CI Subjects.” IEEE Transactions on Neural Systems and Rehabilitation Engineering 25 (8): 1322–1331. doi:10.1109/TNSRE.2016.2622979.
- Deprez, H., R. Gransier, M. Hofmann, A. van Wieringen, J. Wouters, and M. Moonen. 2018. “Independent Component Analysis for Cochlear Implant Artifacts Attenuation from Electrically Evoked Auditory Steady-State Response Measurements.” Journal of Neural Engineering 15 (016006): 1–17. doi:10.1088/1741-2552/aa87ce.
- Firszt, J. B., R. D. Chambers, and N. Kraus. 2002a. “Neurophysiology of Cochlear Implant Users II: Comparison among Speech Perception, Dynamic Range, and Physiological Measures.” Ear and Hearing 23 (6): 516–531. doi:10.1097/00003446-200212000-00003.
- Firszt, J. B., R. D. Chambers, N. Kraus, and R. M. Reeder. 2002b. “Neurophysiology of Cochlear Implant Users I: Effects of Stimulus Current Level and Electrode Site on the Electrical ABR, MLR, and N1-P2 Response.” Ear and Hearing 23 (6): 502–515. doi:10.1097/00003446-200212000-00002.
- Friesen, L. M., and T. W. Picton. 2010. “A Method for Removing Cochlear Implant Artifact.” Hearing Research 259 (1–2): 95–106. doi:10.1016/j.heares.2009.10.012.
- Gamgebeli, Z., I. Kevanishvili, Z. Kevanishvili, M. Hey, and H. von Specht. 2010. “Electrically Evoked Auditory Brainstem Response in Cochlear Implant Users: Waveform, Parameter Peculiarities, Stimulus Intensity Dependence, Gender, Age Variances.” Cochlear Implants International 11 (1): 416–420. doi:10.1179/146701010X12671177204228.
- Gilley, P. M., A. Sharma, M. Dorman, C. C. Finley, A. S. Panch, and K. Martin. 2006. “Minimization of Cochlear Implant Stimulus Artifact in Cortical Auditory Evoked Potentials.” Clinical Neurophysiology 117 (8): 1772–1782. doi:10.1016/j.clinph.2006.04.018.
- Gordon, K. A., D. D. E. Wong, and B. C. Papsin. 2013. “Bilateral Input Protects the Cortex from Unilaterally-Driven Reorganization in Children Who Are Deaf.” Brain 136 (5): 1609–1625. doi:10.1093/brain/awt052.
- Gransier, R., H. Deprez, M. Hofmann, M. Moonen, A. van Wieringen, and J. Wouters. 2016. “Auditory Steady-State Responses in Cochlear Implant Users: Effect of Modulation Frequency and Stimulation Artifacts.” Hearing Research 335 (C): 149–160. doi:10.1016/j.heares.2016.03.006.
- Hall, J. W. III. 2015. eHanbook of Auditory Evoked Responses. edited by M. Hall (Kindle Edition). London, England: Pearson Education Inc.
- Hartmann, R., G. Topp, and R. Klinke. 1984. “Discharge Patterns of Cat Primary Auditory Fibers with Electrical Stimulation of the Cochlea.” Hearing Research 13 (1): 47–62. doi:10.1016/0378-5955(84)90094-7.
- Heywood, R. L., D. A. Vickers, F. Pinto, G. Fereos, and A. Shaida. 2016. “Assessment and Outcome in Non-Traditional Cochlear Implant Candidates.” Audiology and Neurotology 21 (6): 383–390. doi:10.1159/000454914.
- Hornickel, J., E. Knowles, and N. Kraus. 2012. “Test-Retest Consistency of Speech-Evoked Auditory Brainstem Responses in Typically-Developing Children.” Hearing Research 284 (1–2): 52–58. doi:10.1016/j.heares.2011.12.005.
- Johnson, K. L., T. G. Nicol, and N. Kraus. 2005. “Brain Stem Response to Speech: A Biological Marker of Auditory Processing.” Ear and Hearing 26 (5): 424–434. doi:10.1097/01.aud.0000179687.71662.6e.
- Kraus, N., and T. Nicol. 2005. “Brainstem Origins for Cortical ‘What’ and ‘Where’ Pathways in the Auditory System.” Trends in Neurosciences 28 (4): 176–181. doi:10.1016/j.tins.2005.02.003.
- Kraus, N., E. Skoe, A. Parbery-Clark, and R. Ashley. 2009. “Experience-Induced Malleability in Neural Encoding of Pitch, Timbre, and Timing.” Annals of the New York Academy of Sciences 1169 (1): 543–557. doi:10.1111/j.1749-6632.2009.04549.x.
- Li, X., K. Nie, F. Karp, K. L. Tremblay, and J. T. Rubinstein. 2010. “Characteristics of Stimulus Artifacts in EEG Recordings Induced by Electrical Stimulation of Cochlear Implants.” Presented at the 2010 3rd International Conference on Biomedical Engineering and Informatics (BMEI), IEEE. 799–803. Piscataway, NJ: IEEE.
- Makhdoum, M. J., P. A. P. Groenen, A. F. M. Snik, and P. V. D. Broek. 1998. “Intra- and Interindividual Correlations between Auditory Evoked Potentials and Speech Perception in Cochlear Implant Users.” Scandinavian Audiology 27 (1): 13–20. doi:10.1080/010503998419650.
- McLaughlin, M., A. L. Valdes, R. B. Reilly, and F. G. Zeng. 2013. “Cochlear Implant Artifact Attenuation in Late Auditory Evoked Potentials: A Single Channel Approach.” Hearing Research 302: 84–95. doi:10.1016/j.heares.2013.05.006.
- Middlebrooks, J. C., and R. L. Snyder. 2010. “Selective Electrical Stimulation of the Auditory Nerve Activates a Pathway Specialized for High Temporal Acuity.” Journal of Neuroscience 30 (5): 1937–1946. doi:10.1523/JNEUROSCI.4949-09.2010.
- Miller, S., and Y. Zhang. 2014. “Validation of the Cochlear Implant Artifact Correction Tool for Auditory Electrophysiology.” Neuroscience Letters 577: 51–55. doi:10.1016/j.neulet.2014.06.007.
- Nilsson, M., S. D. Soli, and J. A. Sullivan. 1994. “Development of the Hearing in Noise Test for the Measurement of Speech Reception Thresholds in Quiet and in Noise.” The Journal of the Acoustical Society of America 95 (2): 1085–1099. doi:10.1121/1.408469.
- Parbery-Clark, A., D. L. Strait, and N. Kraus. 2011. “Context-Dependent Encoding in the Auditory Brainstem Subserves Enhanced Speech-in-Noise Perception in Musicians.” Neuropsychologia 49 (12): 3338–3345. doi:10.1016/j.neuropsychologia.2011.08.007.
- Picton, T. W., M. S. John, D. W. Purcell, and G. Plourde. 2003. “Human Auditory Steady-State Responses: The Effects of Recording Technique and State of Arousal.” Anesthesia & Analgesia 97: 1396–1402. doi:10.1213/01.ANE.0000082994.22466.DD.
- Sandmann, P., K. Plotz, N. Hauthal, M. de Vos, R. Schönfeld, and S. Debener. 2015. “Rapid Bilateral Improvement in Auditory Cortex Activity in Postlingually Deafened Adults following Cochlear Implantation.” Clinical Neurophysiology 126 (3): 594–607. doi:10.1016/j.clinph.2014.06.029.
- Sharma, A., M. F. Dorman, and A. J. Spahr. 2002. “A Sensitive Period for the Development of the Central Auditory System in Children with Cochlear Implants: Implications for Age of Implantation.” Ear and Hearing 23 (6): 532–539. doi:10.1097/00003446-200212000-00004.
- Skoe, E., and N. Kraus. 2010. “Auditory Brain Stem Response to Complex Sounds: A Tutorial.” Ear and Hearing 31 (3): 302–324. doi:10.1097/AUD.0b013e3181cdb272.
- Skoe, E., J. Krizman, S. Anderson, and N. Kraus. 2015. “Stability and Plasticity of Auditory Brainstem Function across the Lifespan.” Cerebral Cortex 25 (6): 1415–1426. doi:10.1093/cercor/bht311.
- Song, J. H., T. Nicol, and N. Kraus. 2011a. “Test Retest Reliability of the Speech-Evoked Auditory Brainstem Response.” Clinical Neurophysiology 122 (2): 346–355. doi:10.1016/j.clinph.2010.07.009.
- Song, J. H., E. Skoe, K. Banai, and N. Kraus. 2011b. “Perception of Speech in Noise: Neural Correlates.” Journal of Cognitive Neuroscience 23 (9): 2268–2279. doi:10.1162/jocn.2010.21556.
- Stickney, G. S., P. F. Assmann, J. Chang, and F. G. Zeng. 2007. “Effects of Cochlear Implant Processing and Fundamental Frequency on the Intelligibility of Competing Sentences.” The Journal of the Acoustical Society of America 122 (2): 1069–1078. doi:10.1121/1.2750159.
- van den Honert, C., and P. H. Stypulkowski. 1984. “Physiological Properties of the Electrically Stimulated Auditory Nerve II: Single Fiber Recordings.” Hearing Research 14 (3): 225–243. doi:10.1016/0378-5955(84)90052-2.
- van den Honert, C., and P. H. Stypulkowski. 1986. “Characterization of the Electrically Evoked Auditory Brainstem Response (ABR) in Cats and Humans.” Hearing Research 21 (2): 109–126. doi:10.1016/0378-5955(86)90033-X.
- Vickers, D., J. Eyles, J. Brinton, B. Glasberg, and J. Graham. 2009. “Conversion of Scores between Bamford, Kowal and Bench (BKB) Sentences and Arthur Boothroyd (AB) Words in Quiet for Cochlear Implant Patients.” Cochlear Implants International 10 (3): 142–149. doi:10.1179/cim.2009.10.3.142.
- Viola, F. C., J. D. Thorne, S. Bleeck, J. Eyles, and S. Debener. 2011. “Uncovering Auditory Evoked Potentials from Cochlear Implant Users with Independent Component Analysis.” Psychophysiology 48 (11): 1470–1480. doi:10.1111/j.1469-8986.2011.01224.x.
- Visram, A. S., H. Innes-Brown, W. El-Deredy, and C. M. McKay. 2015. “Cortical Auditory Evoked Potentials as an Objective Measure of Behavioral Thresholds in Cochlear Implant Users.” Hearing Research 327 (C): 35–42. doi:10.1016/j.heares.2015.04.012.
- Wagner, L., N. Maurits, B. Maat, D. Baskent, and A. E. Wagner. 2018. The cochlear implant EEG artifact recorded from an artificial brain for complex acoustic stimuli. IEEE Transactions on Neural Systems and Rehabilitation Engineering 26:392–399. doi:10.1109/TNSRE.2018.2789780.
- Zhang, F., J. Anderson, R. Samy, and L. Houston. 2010. “The Adaptive Pattern of the Late Auditory Evoked Potential Elicited by Repeated Stimuli in Cochlear Implant Users.” International Journal of Audiology 49 (4): 277–285. doi:10.3109/14992020903321759.