
 ?Mathematical formulae have been encoded as MathML and are displayed in this HTML version using MathJax in order to improve their display. Uncheck the box to turn MathJax off. This feature requires Javascript. Click on a formula to zoom.
ABSTRACT
Today’s navigation systems use topographic maps to communicate route information. Being general-purpose maps, topographic maps lack optimal support for the specific task of route reading and navigation. In the public transportation domain, research demonstrated that topographic maps do not support planning of routes as good as schematic maps. Our current paper applies this idea to the domain of in-car navigation. Schematic maps emphasize functional aspects of geography and direction information by highlighting information relevant to navigation actions and orientation. However, there is a lack of systematic studies researching the usability of schematic cartography in wayfinding tasks. This article evaluates schematic route maps, created with an algorithm developed in our previous work, regarding user interaction, navigation performance, and spatial memorability. We compare these schematic maps with correspondent non-schematic ones in two different tasks: prospective and situated (driving simulator) route reading. The schematic map and the corresponding non-schematic map are identical in terms of their elements and topology; they vary only in their geometric shape: on the schematic maps, features are highly generalized, following schematic simplification rules for clarity. The experimental data shows that participants using the schematic route maps require fewer map interactions to complete the tasks, orientation information is more visible and leads to more accurate spatial knowledge acquisition. This result contributes to a better understanding of schematic route visualizations’ benefits to support users in wayfinding and orientation tasks.
1. Introduction
Topographic maps are widely used by navigation systems to guide car drivers to their destinations. A topographic map is designed to represent a set of spatial features by their footprint in an exact, consistent and complete way. Being general-purpose, topographic maps may not be the most optimal solution for supporting specific tasks (Montello et al., Citation2018). For example, topographic maps contain excessive information along the route segments where the user requires no navigational support, while it might be difficult to interpret dense segments with complex intersections where action should be taken (Bartram, Citation1980; Godfrey & Mackaness, Citation2017).
Schematic maps, in contrast, emphasize the topological aspects of geography and direction information. They aim to reduce the map’s complexity by selecting and highlighting information important in a particular task. Schematic maps have been widely applied for public transportation by highlighting the connectivity of lines and stations of metro and bus networks. Bartram (Citation1980) demonstrated the advantages of schematic maps for planning routes in the public transportation network. Our current paper applies this idea to car routes. For in-car navigation, the schematization requirements are different because the traveler needs to make turning decisions, and therefore orientation information is more relevant (Krukar et al., Citation2020; Richter, Citation2008).
A route map is a tool that supports humans in finding a way to reach the desired destination, i.e. supports wayfinding. The cognitive processes during wayfinding in the in-car navigation context involve: understanding the order of intersections and paths between them, identifying turning directions at decision points, and recalling landmarks that support the orientation of the user’s position (current or prospective) within the broader environment (Klippel et al., Citation2003; Montello & Raubal, Citation2013; Quesnot & Roche, Citation2015; Richter, Citation2008). Such landmarks can be any recognizable geographic object (Dong, Qin et al., Citation2020). They are relevant references for orientation, be it along the route (local landmarks) or distant from the route (global landmarks)(Anacta et al., Citation2017; Richter & Winter, Citation2014; Steck & Mallot, Citation2000). The described wayfinding processes may contribute to the traveler’s gain of orientation and acquisition of spatial knowledge, which ultimately leads to improving the traveler’s wayfinding skills in the visited area (Montello, Citation1998; Münzer et al., Citation2006; Richardson et al., Citation1999).
In previous work, we presented a route schematization method that follows design rules of cognitively motivated wayfinding instructions (Galvão et al., Citation2020). This schematization method has an advantage over other methods because it considers polygonal landmarks and global landmarks. The current manuscript is a quantitative research of how such schematic route maps affect human-computer interaction and spatial memorability compared to non-schematized maps. Although the functional design of schematic maps is well accepted in the domain of public transportation (Bartram, Citation1980), there is very little quantitative research evaluating the performance of schematization applied to car route maps on prospective or situated route planning. More specifically, there is a lack of studies evaluating schematic versus topographic route maps on usability, navigation performance, and spatial learning.
In order to close this research gap, we compare schematic route maps to corresponding topographic (non-schematic) maps in two scenarios – in a prospective route reading task, when the user studies the route before the travel; and in a situated route reading task, when the user drives the route. This research aims to contribute to the field of cartography by providing quantitative data on topographic versus schematic maps’ effectiveness in actual route reading and navigation scenarios.
The remainder of the article is structured as follows: In Section 2 we review related work on schematic route maps and cartographic user studies. Section 3 describes our hypothesis and Section 4 describes the experimental method (materials, tasks, participants, procedures). In Section 5 the results are presented. Contributions and future work are discussed in Section 6, and the study limitations in Section 7. The conclusions are presented in Section 8.
2. Related work
The move from static to digital cartography has affected possible map designs and interactions: On the one hand, digital maps are dynamic, adaptive, and interactive. On the other hand, a frequent use case for digital cartography is on portable devices with limited screen sizes. This is the use case this research paper focuses on. Roth et al. (Citation2017) discuss the epistemology for empirical studies on digital cartography and how research on the topic follows multiple disciplines’ perspective.
Following the distinctions made by Roth et al., we review the literature on schematic route maps dividing it into three topics: (i) cartographic principles of schematic route maps and the schematic route map algorithm tested in this paper, (ii) interaction with schematic route maps and the lack of quantitative studies, and (iii) the influence of schematic route maps on spatial learning.
2.1. Cartographic principles of schematic route maps
Schematic maps make use of abstract and symbolic representations in order to improve the cognitive ergonomics of a map in its specific context. Probably the best known example of a schematic map is the metro map style. Typical schematization rules applied to metro maps are: co-linearity, i.e. aligning segments along a fixed set of directions (normally 0, 45, 90, 135, 180, 225, 270, and 315); minimization of bends along the transit lines; and scale variation, i.e. using larger scale for congested areas and smaller scale for relatively empty areas (Z. Li, Citation2015). Such rules improve the readability of the connections between distinct lines and of the sequence of stations. The current paper focuses on car route maps which were inspired by metro maps but have a different function and therefore use different schematization criteria. Schematic route maps for in-car navigation aim to emphasize turns at decision points, existing street crossings, and the route’s spatial relation with landmarks, be it point-like or polygonal, local and global.
Agrawala and Stolte (Citation2001) presented a schematization method for routes that extend short road sections to a pre-defined minimal allowed length in order to make them more visible; as well as highly simplifies the shape of non-straight route segments. In the second step, the method adds contextual information–such as street crossings and local landmarks–in the form of textual or symbolic labels placed next to street segments. The authors published results of a survey conducted with users of a prototype, and 99% of respondents answered that they would consider using such maps either as a single navigational visualization or as a complement to currently used route map services.
Delling et al. (Citation2014) used integer linear programming to schematize routes by minimizing their total length while simultaneously preserving the topology and the orthogonal order between all route segments. Other algorithms were also proposed (Barkowsky et al., Citation2000; Luxen & Niklaus, Citation2014; Yong-Uk et al., Citation2005). However, their shared drawback is that neither of them includes global landmarks or polygonal landmarks: Features that are spontaneously used by human navigators and are key elements for supporting spatial learning (Krukar et al., Citation2020; Schwering et al., Citation2017).
Galvão et al. (Citation2020) published a route schematization method that fills this gap by considering global and polygonal landmarks. Computationally, the method is based on the wayfinding chorems theory that had been formulated by (Klippel et al., Citation2005). Wayfinding choremes are primitive elements of route knowledge. These can be: turn directions (e.g. turn left), numerical chunking (e.g. take the third street to the left), or structural chunking (e.g. pass by a village). The theory was further extended by Richter (Citation2008) who produced optimized, cognitively adequate wayfinding choremes that consider landmarks and their spatial relation with the route. The map schematization method proposed by Galvão et al. (Citation2020) implements these features using integer linear programming to optimize the schematic layout design while preserving the correct topology. The method considers both point-like and polygonal landmarks together with their spatial relations with the route. The landmarks that are distinctively considered because of their different relationships with the route are: landmarks at decision points, landmarks along the route, origin and destination landmarks, and global landmarks.
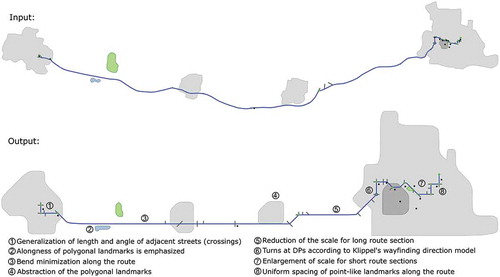
The method also utilizes scale variation: i.e. it displays different sections of the route at different scales. Parts of the route with a higher concentration of decision points are enlarged to the detriment of less dense areas. This increases the visibility of more complex parts of the route, but relative distances between map elements are not preserved. Further, the algorithm removes redundant bends along the route while making crossings and significant turns more evident. shows the example of an input route together with the schematized output of the algorithm. The authors also conducted a qualitative study that indicated that users preferred to read route information in the output schematic format, as opposed to the input non-schematized map. The authors argued that this schematization algorithm is particularly well-suited for navigation tasks performed on small screen devices, such as smartphones. However, they presented no experimental quantitative data to support this. In the present article, we empirically test route maps produced by Galvão et al. (Citation2020) algorithm in two distinct navigation tasks. We focus on the human-computer interaction with the map application and the map’s impact on spatial learning.
Figure 1. Example of the input (non-schematized) and output (schematized) route map produced by the method described by Galvão et al. (Citation2020)
2.2. User interaction and usability studies with schematic route maps
An important aspect of digital route maps is the physical effort that the user must contribute to interacting with the map. Therefore, understanding the effectiveness of route maps requires understanding the interaction process when the map is being used for wayfinding (Nyerges et al., Citation2012). To our best knowledge, little or no quantitative research analyzed user interaction with schematic route maps. Furthermore, studies are designed as prospective route reading, not as situated route reading. Out of the scope of schematic maps, several publications described the interaction with web map applications. In such studies, performance is measured in time spent using the map for a given task and the required number of interactions (zooming and panning). For instance, You et al. (Citation2007) evaluated the interaction with several web map applications in wayfinding-related tasks, such as finding places on the map and learning a map region. Manson et al. (Citation2012) evaluated four different web map navigation schemes (pan zoom, double-clicking, zoom by rectangle, and wheel zoom), measuring interactions and eye movement of participants performing simple map tasks, such as zooming into landmarks or finding a landmark. Chen and Li (Citation2020) analyzed the effect of different map translation methods on interaction, across different map sizes. They found that different interaction schemes for moving around the map affected the performance in terms of map use and wayfinding tasks.
A broader group of previous studies examined the usability of different cartographic aspects of digital map services. Nivala et al. (Citation2008) demonstrated qualitative evaluations of experts in order to compare existing map services. All considered maps were topographic, and their variation was only in style, not schematization. Dong et al. (Citation2021) compared 2D maps with smartphone-based augmented-reality aids in wayfinding tasks for pedestrian navigation. They found evidence of lower cognitive workload for the augmented-reality users but no significant difference in wayfinding performance.
Bronzaft et al. (Citation1976) tested schematic maps of the New York City subway by measuring users’ performance (error rates) in a task simulating travel between given stations. Research in a similar vein evaluated journey planning time as a function of map (Roberts, Citation2019; Roberts et al., Citation2017, Citation2013). However, it bears noting that this task cannot be applied to the study of route maps as the route is already predefined.
One example of evaluating the usability of route maps, besides the already mentioned work of Agrawala and Stolte (Citation2001), is the research of Lavie et al. (Citation2011). They qualitatively evaluated three cartographic aspects of route maps (color schema, level of detail, and level of abstraction) with regard to their perceived usability and esthetics. The authors included a map use task that was not directly related to wayfinding. They found that abstraction combined with a reduced amount of elements is advantageous for the map’s usability. Yet, these map abstractions were conducted manually and not algorithmically.
Another challenge identified by researchers is a discrepancy between qualitative (satisfaction, personal preferences, rating questionnaires) and quantitative studies of maps (execution times, error rates, interaction). Roberts et al. (Citation2013) compared subjective and objective measures of two different schematic designs (octilinear and curvilinear) of the Paris metro network. Usability was evaluated in a prospective route planning scenario. The results (also confirmed in subsequent studies (Roberts et al., Citation2017)), showed that objective ratings and subjective ratings are unrelated: a phenomenon termed by the authors as usability gap. Researchers should not rely on subjective evaluations of map usability alone since they can point to a less effective design preference. Simultaneously, however, an effective map design does not guarantee its public acceptance.
2.3. The influence of schematic route maps on spatial learning
Spatial knowledge of an environment can be obtained directly–by combining separate experiences in the environment (Montello, Citation1998), or indirectly–by reading a map (Dickmann, Citation2012; Thorndyke & Hayes-Roth, Citation1982). Even without direct experience, map users are able to establish relationships between geographic features that are critical for orientation and wayfinding (Richardson et al., Citation1999).
Map’s attributes can affect its efficacy in supporting spatial learning. For instance, Münzer et al. (Citation2012) found that some map-like visualizations can improve the navigator’s route learning (memorability of the sequence of required turns). In contrast, other visualizations are better suited to supporting survey knowledge acquisition (understanding the configuration of distant places with relation to each other). Some cartographic aspects are particularly well-suited to support spatial learning, while they are still uncommon in commercial wayfinding support systems. For instance, R. Li et al. (Citation2014) demonstrated the benefit of showing directions to distant landmarks on the edge of the smartphone-based map (off-screen landmarks). Löwen et al. (Citation2019) showed that highlighting global features on the maps during navigation supports spatial learning.
The literature claims that the usage of GPS navigation systems is disadvantageous to spatial learning (Dickmann, Citation2012; Ishikawa & Montello, Citation2006; Krukar et al., Citation2020; Wessel et al., Citation2010). It has been suggested that part of the reason is that cartographic aspects of dominant wayfinding support systems are optimized for passively following one instruction at a time (Ishikawa et al., Citation2008; Münzer et al., Citation2012; Schwering et al., Citation2017). However, it remains unclear whether these disadvantages of GPS navigation systems (with topographic maps) can be overcome by a different type of maps (such as a schematic route map).
Researchers found that wayfinding performance with schematic maps was similar to the detailed topographic ones despite schematic maps containing much less information. For instance, Gartner and Radoczky (Citation2005) evaluated the wayfinding efficiency of schematized static paper maps for pedestrian navigation, and Meilinger et al. (Citation2007) conducted similar research using floor plans for indoor navigation. Yet, survey knowledge acquisition was not objectively measured in either of the study.
Therefore, there is a research gap on the effect of schematic cartography on spatial knowledge acquisition, especially for car routes. Schwering et al. (Citation2017) pointed out that among the variables that require further investigations are levels of generalization and abstraction of cartographic information and their influence on map users’ orientation. Godfrey and Mackaness (Citation2017), in the context of small-screen devices, defend new cartographic approaches that focus on functional aspects of the map’s features rather than its metric accuracy. They classify distinct approaches of scale variation (space distortions) in cartography, but do not present a comparative study.
How spatial learning is measured. In cognitive science, several ways are used to measure spatial learning. Some examples are the accuracy of pointing directions to previously experienced landmarks (Credé et al., Citation2019), distance estimations (Richardson et al., Citation1999), and metal map depiction (drawing a sketch from memory)(Anacta et al., Citation2018; Krukar et al., Citation2018). The current paper uses landmark recall and landmark placement tests, which are also standard methods to test spatial learning (Credé & Fabrikant, Citation2018; Evans et al., Citation1984; Frankenstein, Citation2015; Huang et al., Citation2012; Münzer et al., Citation2006), and is suitable to address research hypotheses (see Section 3). In the landmark recall test, the user is asked to first interact with the map and later, after the map is no longer available, to recall which landmarks they saw on the map. In the landmark placement test, the user is asked to move disorganized depictions of landmarks onto a simplified outline of the map in order to recreate the configuration of landmarks that was visible on the original map.
How route maps are used. Two common ways in which route maps are used in realistic everyday wayfinding scenarios are prospective and situated route reading (Hölscher et al., Citation2011). Prospective route reading takes place before potential navigation on the route, for instance, to plan or memorize it. Situated route reading occurs during navigation, for instance, when one uses a wayfinding support system while driving through an unknown environment. Hölscher et al. (Citation2011) demonstrated that prospective route planning and situated route planning vary significantly with respect to the cognitive processes they engage. This is primarily because situated route planning uses immediate surroundings visible to the navigator as part of the input. Although the authors did not consider map types (they focused on route planning from memory), their study suggests that using route maps in the situated context might be associated with different cognitive strategy and performance than using route maps in the prospective context.
3. The current study
This user study aimed to empirically evaluate the effectiveness of schematic route maps, compared to their non-schematic equivalents, in the context of two tasks: prospective route reading and situated route reading. The study considered the use of maps on portable digital devices supported by touch-screen interactions and evaluated user interaction with the map and spatial learning of the environment depicted on the map. In order to address the research problem, we raised four research questions. shows all four questions and the hypotheses stated with respect to each question.
Table 1. Research questions and hypotheses
4. Method
In order to test the raised hypotheses (), we designed an empirical experiment comparing the schematic route map type to the non-schematic equivalent maps of the same routes. The experiment consisted of two main tasks aimed to simulate how route maps are used in realistic situations: (i) prospective route reading, implemented in a custom-built Route Instruction Ordering (RIO) application; and (ii) situated route reading, implemented in a virtual-reality driving simulator. The maps used across both tasks are strictly the same, and they are detailed in Section 4.1.1. The prospective and situated route reading tasks are detailed in Sections 4.1.2 and 4.1.3 respectively. shows the main variables measured in each task to answer the research question. In order to address RQ3, a spatial memory test was elaborated and conducted after each wayfinding task. The memory test is explained in Section 4.1.4. Participants, experimental design and procedure are explained in Sections 4.2, 4.3, 4.4 respectively.
Table 2. Experimental tasks and main variables measured to test our hypotheses
4.1. Materials
4.1.1. Map Types and Routes
The route map type (schematic vs. non-schematic) is the independent variable and main object of this study. The non-schematic map type is identical to its corresponding schematic map type in the number of streets, landmarks, topology, colors, and styling. The differences are found in the generalizations. The schematic route maps were created using the algorithm by Galvão et al. (Citation2020) described in Section 2.1 and are highly generalized: shapes are simplified, bends along the route are minimized, turns and intersection follows a co-linear 8-direction model, local point-like landmarks uniformly spaced from the route, and congested areas are enlarged taking the space of less congested areas (scale variation). Non-schematic map type were the topographic maps that served as input for the schematization algorithm. They have a low level of generalization: the simplifications are minimal, and the relative distances are preserved (no scale variation).
All maps highlighted landmarks. Following the definitions of Galvão et al., the landmarks were classified according to their shape (point-like and polygonal) and their function (local and global). Their proximity to the route formalizes the difference between global and local landmarks. Landmarks with no street separation and within 20 meters of the route are considered local. Landmarks located outside this buffer or separated from the route by another street are considered global. The landmarks were chosen manually to ensure their equal spread along the route and across the environment. Point-like landmarks were highlighted with unique icons and labels. Polygonal landmarks, besides unique labels, were filled with one of three colors: gray for urban areas and neighborhoods, green for parks and forests, and blue for lakes.
In order to compare the two map type conditions, two routes were used: Route 1 and Route 2. The routes were single-destination routes. They contained simple street crossings, bridges, and roundabouts but no complex highway exits. Only the region’s major streets (OpenStreetMap contributors. (Citation2017) street class over 22) and the side streets adjacent to the route were included. Both routes contained all four landmark types.
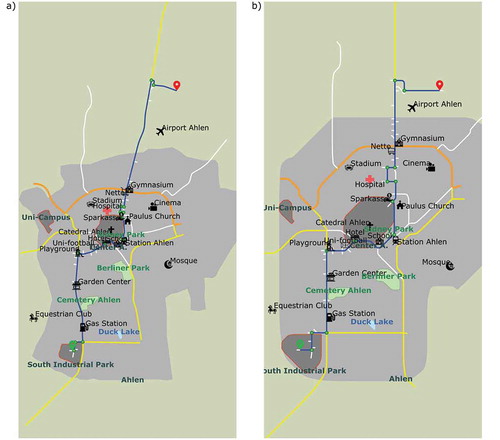
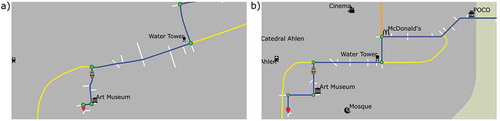
show both routes in both schematic and non-schematic map type conditions. Route 1 is 11.8 km long and connects two German cities (Ahlen and Beckum). It contains 26 landmarks: 16 point-like landmarks (of which nine are global and seven are local) and ten polygonal landmarks (of which seven are global and three are local). Route 2 is 7.7 km long and crosses the German city of Ahlen. It has 25 landmarks: 18 point-like landmarks (of which 8 are global and ten are local) and seven polygonal landmarks (of which three are global and four are local).
Figure 2. Route 1 a) non-schematic vs b) schematic map type at initialization (lowest zoom level). Maps size was constantly 150 × 75 mm during the experiment. Label overlaps disappeared when participants zoomed in
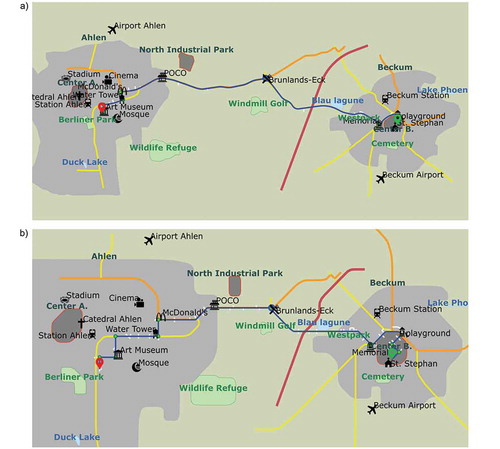
Figure 3. Route 2 a) non-schematic vs b) schematic map type at initialization (lowest zoom level). Maps size was constantly 75 × 150 mm during the experiment. Label overlaps disappeared when participants zoomed in
In the experiment, the maps were displayed on a digital device (desktop or tablet). Users could zoom (change the scale) and pan (translate) to focus on a specific region. The maps were north-oriented, and rotations were not allowed. Since the maps used scalable vector graphics (SVG), the map features (line thickness, labels font size, and icon sizes) were scale-adaptive, i.e. they adapted to the zoom level. All maps followed the same scale adaptation rules.
4.1.2. Prospective route reading task
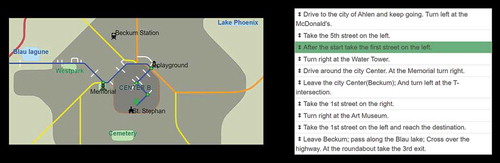
The prospective route reading task simulates realistic use of a route map, specifically when a user needs to understand the necessary sequence of map-depicted wayfinding actions in order to plan how to reach the destination prior to the actual travel. This task was implemented using the Route Instruction Ordering (RIO) application (Galvao et al., Citation2021) – a custom-built, JavaScript-based web application using Scalable Vector Graphics (SVG). The interface of the RIO application consists of two parts, adjacent to each other and simultaneously visible on the computer screen: the map area and the textual route instructions area. The map area (dimensions: 150 × 75 mm) displayed a map (either the schematic or the non-schematic type, depending on the experimental condition) and could have been interacted with using the computer mouse. The supported actions are panning (with clicking and dragging) and zooming (with the mouse wheel). The textual route instruction area contained a list of individual route instruction sequences in discrete boxes (1–4 sentences per box, e.g. “Take the 1st street on the right,” “Pass along the Cemetery”; & “Turn right at the Playground”). The instructions’ starting order was randomized, and the participant’s task was to re-order the instructions so that their sequence corresponds to the sequence of actions necessary to reach the destination, based on the visible route map. The ordering is modified with drag-and-drop mouse interaction. illustrates the interface of the application.
Figure 4. Route instruction ordering (RIO) web application interface. On the left, the interactive route map, on the right, the sortable list of instructions
The map’s viewport orientation was adjusted depending on each specific route’s longitudinal or latitudinal extension. The viewport was portrait-oriented if the latitudinal extension was the largest, or landscape-oriented otherwise. The initial map scale was selected to fit the entire route within 70% of the available viewport, guaranteeing that all landmarks were initially visible around the map.
If the participant submitted the list of instructions in an incorrect order, the application highlighted the first instruction (from the top of the list) that was in the incorrect position and asked the participant to keep trying until the correct order is submitted. Each participant performed this task twice: for the outward and backward direction of the same route. The maps for the outward and backward direction are strictly the same, except for the start and end icons that are swapped. The difference between the two directions was in the textual instruction descriptions since the turns’ directions and the relevant landmarks differed depending on the traveling direction.
When the correct order was submitted, the application recorded relevant map interaction logs: zooming, panning, scale, viewport, and time. Subsequently, the participant was immediately invited to perform the landmark recall and the landmark placement tests at the same desktop computer (see Section 4.1.4).
4.1.3. Situated route reading task
The situated route reading task simulates the realistic use of a route map during driving, and it was implemented in a virtual-reality driving simulator. The task consisted of driving in an unknown virtual environment, following a route map. Although spatial knowledge acquisition tends to be lower in virtual environments than real-world experiences, its use is well accepted in experimental psychology and spatial cognition studies (Richardson et al., Citation1999; Schmelter et al., Citation2009).
The virtual-reality driving simulator’s implementation and configuration were inspired by and are similar to this described by Löwen et al. (Citation2019). The simulator runs on a high-performance gaming computer connected to a gaming steering wheel and pedals (). The environment was projected on the flat wall in front of the participant using a projector. The maps used OpenStreetMap contributors. (Citation2017) data of the cities of Ahlen and Beckum in order to build the 3D environment using the ESRI CityEngine software. CityEngine creates a generic 3D city using the street data as input. Then, the landmarks were manually modeled using SketchUp and added to the 3D model. Last, the 3D environment was imported into the Unity 3D gaming engine, where the vehicle and driving simulation was completed. No traffic nor pedestrian simulations were rendered. In order to simulate a GPS-supported navigation system, a MQTT publisher script was implemented in Unity 3D. This publisher script sends the car’s position in the virtual environment to the MQTT host (local network machine) every 100 ms . A separate navigation application used this position in order to show the driver’s location on the map.
Figure 5. Situated route reading task implemented in the virtual-reality driving simulator: a) 3D city model created with CityEngine and SketchUp (here showing part of Route 2 from above). b) Hardware setup. c) A user navigating in the virtual environment while using the interactive map application on the tablet
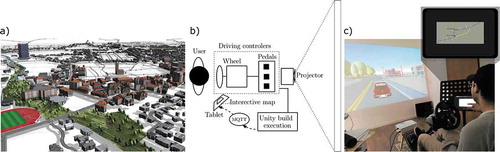
The navigation map application is a JavaScript-based web application using Scalable Vector Graphics (SVG) running on a tablet computer (iPad 11” 2018 running iOS 12) that was attached next to the steering wheel. It allows touch interactions in order to zoom and pan the map. The map dimension was fixed to 150 × 7.5 mm, and the viewport orientation was adjusted depending on the route extension. Once the vehicle position was received via the MQTT, the application plotted the car icon indicating the driver’s virtual location on the route. shows two examples of what a driver could see during the map usage at the same position using different map types.
Figure 6. Examples of typical map view during the driving task: a) Route 1 type non-schematic (on the left) vs. b) Route 1 type schematic. The map dimension is fixed (150x75 mm) but participants can zoom and pan to a desired focus point. The maps are always north-oriented and rotations are not allowed. The yellow car icon indicates the driver’s virtual location on the route
The map in this custom-built application was only visible when the user stopped the car. As soon as the user started driving, the map disappeared from the screen automatically. This feature was implemented for two reasons: (i) in order to accurately measure how long the user was actually using and looking at the map; (ii) in order to discourage excessive use of the map when it is not necessary for navigation (existing in-car navigation systems do this by displaying warnings about excessive use during driving).
The logged variables were: number of zoom interactions, number of pan interactions, map scale (zoom level) and its change over time, map bounds, time records, and car’s trajectory. After arriving at the destination, the participant was immediately invited to perform the landmark recall and the landmark placement tests at a nearby desktop computer.
4.1.4. Spatial memory measures: the landmark recall and the landmark placement tests
The landmark recall and the landmark placement tests were implemented in a separate single custom-built web application for desktop.
The landmark recall test presents landmarks, together with their labels, one-by-one, in a 500 × 500 pixel frame. For each landmark, the participant is asked whether they recall seeing this landmark at any moment during their (RIO or driving) task. The application queried all landmarks presented earlier on the map, plus 33% of foils (objects looking like potential landmarks but that were, in fact, not present on the map). The application recorded the participant’s answer.
The landmark placement task was always presented second, after the landmark recall task. In it, participants had to place the landmarks on a base map using the street network as a reference. The base map included only the route, the street network, and the city’s urban areas of the task map, as shown in . The map scale was adjusted to fit all features, and its viewport occupied the entire monitor screen. Only the landmarks that were correctly recalled in the landmark recall task were queried in the landmark placement task. Each landmark was initially shown on a large scale, with its label, in a separated 500 × 500 px frame. After the participant confirmed, the landmark was plotted onto the base map’s top left corner. Using the mouse, the participant needed to drag and drop the landmark to the location they remember seeing it during the map use. Finally, the participant needed to judge their own placement’s by answering the question ”How confident are you about this location?” using a slider with a 0–100 range. The answer option was ”I’m % confident.” Where
is the slider value.
Figure 7. The landmark placement application interface for Route 1 type schematic. Only the landmarks recalled previously in the landmark recall test can be placed on the base map. For polygonal landmarks, the user first needed to drag and drop the landmark’s bounding box onto the desired position before seeing the polygon’s true shape
For the polygonal landmarks, the initial step differed compared to the point-like landmarks: participants dragged and dropped the bounding box of the polygon (and not the actual landmark) onto the chosen location. This step was crucial in preventing the participants from judging their placements based on the fit of the polygons’ geometry within the street network. Only when the participant confirmed the bounding box’s position, the landmark’s geometry appeared, and the participant had a chance to make the final adjustment of the placement. The adjustment was only possible to 4% of the object’s length.
4.1.5. Differences between the prospective route reading (RIO)and situated route reading (driving) tasks
The prospective route reading (RIO) and the situated route reading (driving) tasks simulate realistic route map use cases. However, they significantly differ in their: procedure, means of communicating spatial information, involvement of different cognitive processes, and measured variables (). Our choice of these two methods was motivated by the aim of evaluating route map types comprehensively, i.e. from perspectives on the interaction of the human navigator, the supporting map, and the environment it depicts. Making these differences explicit may help interpret statistical results that can demonstrate a different impact of the schematic route map type in one task but not the other.
Table 3. Differences between the RIO task and the driving task: prospective vs. situated route reading
4.2. Participants
Fifty-four subjects (28 Female and 26 male; age range 18–44, mean age = 28, standard deviation = 3.54) volunteered to participate in the study. The Institute’s Ethics Committee approved the study’s procedure. All subjects signed Informed Consent Forms and received a EUR 10 compensation. They were mainly recruited through social media groups and advertisements with flyers. Eleven were students from the institute, and the remaining 43 had other diverse occupations or fields of expertise. The only restriction to take part in the study was not to be familiar with the route regions or maps. Two participants could not finish the situated route reading task reporting nausea caused by virtual reality. For one of them, we had to exclude the data from both tasks; for the other, we could keep the data from the prospective route reading, but not from the situated route reading task.
4.3. Experimental design
The study followed a counterbalanced within-subject design: each participant was assigned to both levels of the map type variable (schematic and non-schematic), and each participant performed both tasks (prospective route reading and situated route reading). However, to avoid learning effects that could occur if a single participant had to use the same route twice or see the same map twice (because they had to participate in two subsequent tasks), two different routes were used for the tasks. A participant who performed the prospective route reading (RIO) task on Route 1 and in the schematic map type condition, was subsequently assigned to Route 2 in the non-schematic map type condition for the navigation task.
The order of the tasks and the maps used across each task were counterbalanced. This accounts for potential effects that might arise due to the procedural sequence. illustrates the experimental design and procedure. Twenty-seven participants did the prospective route reading (RIO) task first (6 on route 1 non-schematic, six on route 1 schematic, eight on route 2 non-schematic, seven on route 2 schematic), but one could not finish the driving task due to nausea. Twenty-seven did the driving task first (6 on route 1 non-schematic, six on route 1 schematic, eight on route 2 non-schematic, and seven on route 2 schematic), one could not finish both task due to nausea.
Figure 8. Experimental design and procedure. The experiment is composed of two tasks (RIO and driving) and two memory tests: a landmark recall and a landmark placement test. In this process diagram, the letter ”A” and ”B” is used to indicate two different routes, directions, or map types. For example, if ROUTE_A is the Route 1, then ROUTE_B is the Route 2; and if ROUTE_A is the Route 2, then ROUTE_B is the Route 1
4.4. Procedure
The procedure was composed of three phases. The general introduction, followed by the two wayfinding tasks: prospective route reading and situated route reading (in an alternating order). The whole experiment procedure took approximately one hour.
The general introduction began with signing an Informed Consent Form and explaining the overall procedure of the study. Participants were informed that there will be a training phase for each wayfinding task and that the tasks will be followed by a spatial learning test. This introduction took approximately 10 minutes. More specific instructions were given before each wayfinding task.
4.4.1. Prospective route reading (RIO) task phase
First, the participant was invited to sit at the desk with a monitor and a mouse. Second, they were presented with a textual and animated explanation of the RIO task. Afterward, the experimenter explained the map legends one by one because it was critical that each participant clearly understands how to recognize decision points and the different intersections used in the textual instructions (crossings, T-intersections, and roundabouts) on the map. Also, examples of numeric directions, such as “take the third street on the left,” were demonstrated on the map legends. After the initial introduction, the participant performed a training task with a short route to get familiar with the application and ask questions.
Finally, the participants were informed that they need to do the ordering of the assigned route for both directions (outward and backward) and that they need to commit to the task without breaks. The route directions were counterbalanced, i.e. half of the participants did the outward route direction first, and the other half the backward direction first. As soon as the participant finished the RIO task for both ways, they started the spatial memory test, i.e. the landmark recall test and the landmark placement test. (total time: approx. 20 minutes).
4.4.2. Situated route reading (driving) task phase
The driving task started with introducing the driving simulator and adjusting the seat and the driving wheel. There were two training phases. The first was a free-driving phase to let the participant get familiar with the controllers and the vehicle’s motion. At this point, they were informed that there is no traffic nor pedestrians in the virtual environment and that they can ignore the street signalization and turn onto all streets. In the second training phase, participants needed to drive a short route using a navigation map application on a tablet. At this phase, the participants learned the map elements and how to interact with the map; also, participants learned that it is necessary to stop the car in order to view the map.
After the training phases, participants were informed about their goal: to drive the route presented on the map application, be fast, and avoid taking wrong turns. The speed limit was set to 90 km/h. In case of a wrong turn, the car was returned to a point before the last intersection. As soon as the participant reached the destination, they started the spatial memory tests, i.e. the landmark recall test and the landmark placement test. (total time: approx. 30 minutes).
5. Results
In order to analyze the results, we employed linear mixed-effects statistical analysis of the relationship between the map type (schematic and non-schematic) and the following dependent variables: the number of zoom interactions (summed zoom-in and zoom-out actions), the amount of panning interactions, visibility of landmarks (i.e. the proportional duration for which each landmark was visible to the user), landmark recall, landmark placement correctness. We ran all statistics using R (R Core Team, Citation2020) and the lme4 (Bates et al., Citation2015) package. We evaluate whether the influence of map type on each dependent variable is significant by deriving the statistic for the comparison of the model, including the map type variable and an alternative null-model omitting the map type variable. We report the map type effect as the non-standardized coefficient of the map type variable in the corresponding model. This makes it possible to intuitively interpret the impact of map type on the original units of the concerned dependent variable.
In order to test Hypothesis 4, which is a null hypothesis, we implemented a corresponding linear mixed-effect model in the Bayesian framework, using the brms R package (Bürkner, Citation2017) which is based on Stan (Carpenter et al., Citation2017).
Additionally, we used the Bayesian framework to shed more light on non-significant results with p-values close to the 0.05 significance threshold. We report these hypotheses as not confirmed in the Results section, but provide additional analyses and insights in Appendix A.
5.1. Map interactions
summarizes the mean of the zoom and pan interactions with their respective standard deviations. In the following subsections, we evaluate their significance.
Table 4. Descriptive map interaction statistics: mean (standard deviation)
5.1.1. Schematic map type requires fewer zoom interactions
In order to evaluate the effect of the schematic map type on the number of zoom interactions, we analyzed the relationship between map type and the total number of zoom interactions made by participants. In order to account for the fact that the average number of zoom interactions increases proportionally to the total map use time, we included the total map use time as a fixed effect in the model. As random effects, we included random intercepts for the routes. The model for the RIO task’s results also included the intercept for participants since each participant did the ordering twice (outward and backward, in a counterbalanced order, see Section 4.4.1).
Participants who used the schematic map type required significantly fewer zoom interactions to complete both RIO and driving tasks. In the RIO task, the schematic visualization affected the number of zoom interactions (,
), lowering it by about
; and the map use time affected the number of zoom interactions (
,
), increasing it by about
for each second of map use. In the driving task, the schematic visualization affected the number of zoom interactions (
,
), lowering it by about
; and the map use time did not significantly affect the number of zoom interactions (
,
). These results consistently confirm the Hypothesis H1.1 across both tasks.
5.1.2. Schematic map type requires less panning interactions
In order to evaluate the effect of the schematic route map type on panning interactions, we analyzed the relationship between map type and the cumulative amount of panning, measured in centimeters. In order to account for the fact that panning interactions increase proportionally to the total map use time, we included the total map use time as a fixed effect in the model. As random effects, we included intercepts for the route. The model for the results of the RIO task additionally included the intercept for participants since each participant did the ordering twice (outward and backward, in a counterbalanced order, see Section 4.4.1).
Participants that used the schematic route map type required significantly less panning to complete both tasks: RIO and driving. In the RIO task, the schematic visualization significantly affected the number of panning interactions (,
), lowering it by about
; and the map use time significantly affected the number of panning interactions (
,
), increasing it by about
for every second of map use. In the driving task, the schematic visualization significantly affected the number of panning interactions (
,
), lowering it by about
; and the map use time significantly affected the number of panning interactions (
,
), increasing it by about
for every second. These results consistently confirm Hypothesis H1.2 across both tasks.
5.2. Visibility and Memorability
summarizes the mean of the visibility of the landmarks (the proportion of time for which each landmark was visible), the landmarks’ correct recall ratio, and the placement topological accuracy ratio of the global landmarks. In the following subsections, we evaluate their significance.
Table 5. Descriptive statistics of landmarks’ visibility, correct recall, and correct placement: mean (standard deviation)
5.2.1. Landmarks are visible for longer during schematic map type use
We evaluated the visibility of the landmarks on the maps by analyzing the proportion of total map use time for which each landmark was visible, i.e. lay within the map’s viewport (Visible% in ). For the statistical evaluation, we analyzed the relationship between map type and the percentage of visible time of each landmark. As random effects, we included the intercepts for routes, landmarks, and participants.
Landmarks were significantly more visible during schematic map type use in both tasks: RIO and driving. In the RIO task, the schematic visualization significantly affected the relative visibility of landmarks (,
), increasing it by about
. In the driving task, the schematic visualization significantly affected the relative visibility of landmarks (
,
), increasing it by about
. These results consistently confirm Hypothesis H2 across both tasks.
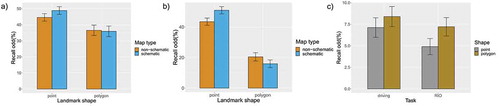
5.2.2. No clear evidence for the effect of the schematic map type on higher odds of recalling point landmarks
show the aggregated landmark recall results grouped by the map type and landmark shape. In both tasks, the users recalled more point-like landmarks correctly in the schematic condition than in the non-schematic map condition; however, users recalled more polygonal landmarks correctly in the non-schematic condition. One possible explanation for this is that while point-like landmarks are represented with unique icons, polygonal landmarks are distinguishable with three colors (gray, green, and blue). Therefore, participants might have recalled the polygonal landmarks based on their geographic type. For example, after a participant has seen a lake on the map (or in the virtual environment), the participant might confirm recalling any lake shown in the landmark recall test, being it a foil or another unnoticed lake on the map. The results shown in corroborate this hypothesis. There, we consider only the foils, and it can be seen that the polygonal landmarks were often erroneously recalled (false positive responses) compared to the point-like landmarks. For this reason, we decided to analyze the landmark recall test results excluding the polygonal landmarks.
Figure 9. Recall of landmarks: a) After the RIO task, 44.6% of the map’s point-like landmarks were recalled by non-schematic map type users, while 48.9% by the schematic map type users. For polygonal landmarks, 36.6% by non-schematic users and 35.9% by schematic users. b) After the driving task, 43.4% of the map’s point-like landmarks were recalled by non-schematic map type users, while 50.9% by the schematic map type users. For polygonal landmarks, 20.4% by non-schematic users and 15.9% by schematic users. c) After the driving task, 7.1% of the point-like and 8.4% of the polygonal foils were (erroneously) recalled. After the RIO task, 4.9% of the point-like and 7.2% of the polygonal foils were (erroneously) recalled
In order to evaluate the effect of the schematic route map type on the odds of recalling point-like landmarks, we performed a binomial logistic mixed-effects analysis of the relationship between map type and the correctness (true vs. false) of all point-like landmarks presented on the map (i.e. the analysis excluded responses to foils). As random effects, the model included random intercepts for participants, routes, and landmarks.
The effect of schematic map type on the number of recalled landmarks was not significant: neither for the RIO task (,
) nor for the driving task (
,
). Therefore, Hypothesis 3.1 was not confirmed. However, we report additional analyses for this result in Appendix A.
5.2.3. The placement of the global landmarks is more correct in the schematic map type group
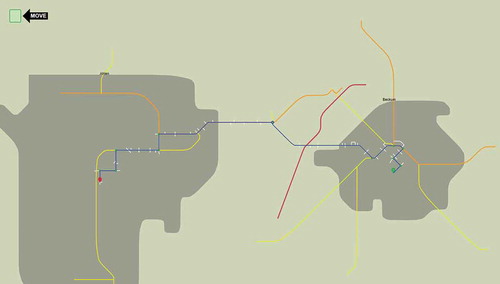
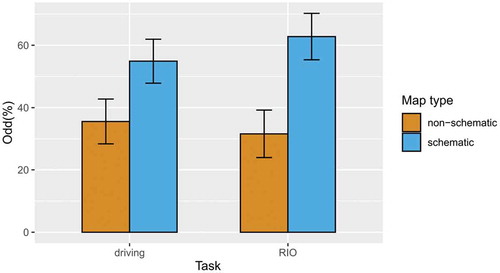
We evaluated the landmark placement’s correctness by analyzing whether each landmark was placed in the topologically correct region delimited by the street network and the city’s boundaries. illustrates the topological subdivisions: placement would be considered “correct” if the participant’s solution to the landmark placement task is inside the same subdivision as the original location of the landmark. We focus on the global landmarks because they are not attached to the route path and have, therefore, a primary pertinence for survey knowledge acquisition and orientation (Anacta et al., Citation2017). In the statistical analysis, we excluded responses for which participants reported 0% of confidence, i.e. blind guess placements. shows the aggregated results of the global landmarks placement grouped by the map type across both tasks. We performed a binomial logistic mixed-effects analysis of the relationship between map type and landmark placement’s topological correctness (correct vs. incorrect). As random effects, the model included random intercepts for routes, landmarks, and participants.
Figure 10. Topological subdivisions are formed by the street network and the city’s boundaries. a) Route 1 and b) Route 2
Figure 11. Topologically correct placement: Percentage of the correctly recalled global landmarks that were placed in the correct topological region, aggregated by the map type. Excluding responses for which participants reported 0% of confidence
In the RIO task, global landmarks had a significantly higher chance of being placed correctly. The topological correctness of the global landmarks’ placement was significantly affected by the schematic map type (,
), increasing the probability of correctly placing a landmark by about
on the logit scale. This translates to the schematic map type having the odds ratio of correct landmark placement
(i.e. the chance of correctly placing a landmark in the schematic map type conditions is like 10:1, compared to the non-schematic map type). In the driving task, this difference was not significant (
,
). These results partially confirm Hypothesis H3.2 (i.e. only in one task and only on the subset of landmarks).
5.3. No evidence for the effect of the schematic map type on driving performance
Considering the high level of generalization and scale variations (space distortions) of the schematic route map type, we saw the risk of negatively affecting driving performance. To examine this potential adverse effect, we formulated hypothesis H4, investigating whether schematic maps do not increase the number of wrong turns during driving. In order to evaluate this hypothesis, we performed a linear mixed-effects analysis of the relationship between map type and the number of wrong turns in the driving task. As random effects, we included random intercepts for the route. Random intercepts for participants were not included because each participant performed a single route drive.
The schematic map type did not significantly affect the number of wrong turns in the driving task (,
). Thus, there was no significant evidence for the difference in the number of wrong turns between schematic and non-schematic map types. However, a non-significant p-value does not quantify evidence for the lack of such effect. In order to do so, we repeated the above analysis in the Bayesian framework using the brms R package (Bürkner, Citation2017). We have implemented the same model formula, specified weakly informative priors (default brms priors and a normal(0,1) prior for the effect of schematic map type), performed a Poisson regression suitable for count data, and derived Bayes Factor (BF) for the no-effect (null) hypothesis.
, indicating substantial evidence for the null: the schematic and the non-schematic map types are 3.8 times more likely to cause the same amount of wrong turns, compared to the alternative hypothesis that they cause a different number of wrong turns. Thus, Hypothesis H4 was confirmed.
6. Discussion
Schematic maps make use of generalizations in order to improve specific functionalities of a map. However, relatively little empirical evidence is available about the usability of schematic route maps for in-car navigation. This study evaluated the effects of the schematic route maps proposed by Galvão et al. (Citation2020) on the interaction with the map and subsequent spatial knowledge acquisition. Two map conditions (schematic and non-schematic) were tested using two routes in two different tasks: prospective route reading implemented in the RIO task and situated route reading implemented in the virtual driving task. Results provide empirical evidence that the schematizations improve the usability of route maps and contribute to the map user spatial knowledge acquisition. summarizes the results according to the raised hypotheses. In Section 6.1, we discuss the implications on map interaction (H1.1 and H1.2), and in Section 6.2 the implications on map visibility and spatial learning (H2, H3.1, and H3.2).
Table 6. Confirmation of hypotheses summary
6.1. Map interactions
Participants using the schematic map type required less interaction in both tasks. In the RIO task participants required fewer zoom interactions and
less panning, while in the driving task, participants required
fewer zoom interactions and
less panning. This result is in accordance with our expectations and with previous qualitative studies on the usability of schematic route maps (Agrawala & Stolte, Citation2001; Lavie et al., Citation2011). The reason for this reduction of interactions – as already discussed by Godfrey and Mackaness (Citation2017) and Galvão et al. (Citation2020), p. – is related to the scale variation of the schematic maps and the small map’s viewport size. The tested schematic route maps have a larger scale in those regions that contain a higher concentration of decision points. This effect makes turns more recognizable compared to the non-schematic layout. Therefore, the map user requires less zooming and, consequently, less panning, which improves the interaction and is less effortful for the user.
The reduction of map interactions is important in the prospective map reading task. In this case, the map user usually tries to get a general understanding of the route, and they need to freely interact with the digital map, often in a non-linear manner. In the situated map reading case, the navigation systems may use the positioning system (GPS) in order to automatize the interaction by following the traveler’s location. Drivers will benefit because the evaluated schematic map type reduces the dynamics of change during the navigation by improving the visibility of the surrounding landmarks.
6.2. Visibility and spatial memorability
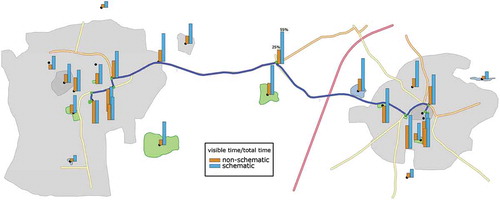
In addition to the map interactions, we measured how long each landmark was present within the map’s viewport, i.e. was visible to the user. As hypothesized earlier by Galvão et al. (Citation2020), schematic route maps increase the visibility time of landmarks. In the schematic map type condition, the turns at decision points are generalized. Moreover, due to the scale variation, areas with a higher concentration of decision points have an enlarged scale taking the space of more empty areas of the map. Therefore, on smaller screens, it is possible to read the route information while at the same time more of the surroundings are visible. compares the mean visibility times of all landmarks in the driving task for Route 1 (similar results were found for Route 2 and in the RIO task). Note that the difference between map type conditions is larger for landmarks located further away from the regions with a higher concentration of decision points (green circles on the route). We believe that schematic route maps facilitated the visibility of contextual information. Our experiments focused on individual routes, but further studies should research whether this improved visibility of contextual information can systematically contribute to survey knowledge acquisition. For example, does seeing more distant contextual information on schematic route maps helps participants integrate separate routes into a comprehensive memory of the city?
Figure 12. The difference in the landmarks’ relative visibility between non-schematic (orange) and schematic (blue) map type in the driving task for Route 1 (similar results were found for Route 2 and in the RIO task). The bars show each landmark’s mean visible time divided by the map use time, calculated as . Where
is map use time, and
is the time for which the given landmark
was present within the map’s viewport
We conducted two spatial memorability tests in order to evaluate whether the increased landmark visibility on the schematic map type affected landmark recall and placement. Results preliminarily point to some possible benefits of schematic maps, specifically in the recall of point landmarks and in the placement of global landmarks. These limited effect sizes are explainable by the fact that it is difficult to gain an accurate understanding of an individual’s mental representation of an environment based on a single wayfinding experience (Kim et al., Citation2020). When the environment is entirely unknown, wayfinding tasks are more stressful, and the driver tends to focus on the route information, which is more relevant for completing the task. In the driving task, we did not stimulate participants to learn about the environment. Also, they performed their task only on a single route (in two directions in the RIO task). This experimental set-up might be thus sub-optimal for testing landmark memorability. Future work could shed more light on the issue, for instance, by asking participants to perform several wayfinding tasks using different routes that cross and overlap each other. This way, participants could gradually accumulate limited knowledge acquired from individual wayfinding experiences, and the differences between map types might prove to be more evident.
7. Limitations
One limitation of this study concerning its results on map interaction is the single screen size with which we evaluated the maps. We conducted the study using the same viewport size for the maps: 150 × 75 mm (corresponding to a regular smartphone size). The available screen area for displaying the map most likely would affect the amount of interaction. The larger the map size, the larger is the visible region at the same scale. Future studies can experiment with different screen sizes, and the level of schematization can be optimized for the user’s device size. Also, in the situated route reading experiment, we forced the participant to stop the vehicle in order to make the map visible. We apply this condition in order to have more accurate control of the map use time and to motivate map memorization. It is important to mention that in natural situated route reading, the map might be available all time, and therefore the recall rates of landmarks could be higher.
The results indicated that the tested schematic route maps–despite their distortions–do not impair driving performance. However, this result needs to be interpreted carefully. In our experimental condition, there was no traffic or pedestrians. Also, the routes did not contain complex intersections, such as highway exits. Participants were also allowed to ignore street signalization and traffic rules, e.g. by driving on all lanes. The distortions of the schematic map type might affect driving performance if driving conditions are more challenging. Furthermore, typical limitations of virtual reality studies apply to our situated route reading task, such as restricted body movement, not identical behavior pattern compared to real live (Dong, Liao et al., Citation2020; Richardson et al., Citation1999), and nausea in a small subset of the participants.
It is also important to emphasize that our object of study was the map type. This approach excluded the problem of selecting specific features that are depicted on the map, as well as map dynamics during navigation (e.g. the choice of its current point of view, speed of rotation, etc.). It is our position that while these aspects are essential for the usability of specific map applications, the scientific methods for their study and improvement are already well-accepted. Instead, we argue for questioning the turn-by-turn paradigm of wayfinding support and aim to draw attention to alternative ways of defining the task of “wayfinding with a map.”
8. Conclusion
This study provided empirical evidence for the benefits of schematizing route maps regarding improving map interaction and memorability in two common wayfinding tasks for in-car navigation: prospective route reading and situated route reading on digital devices. This work’s main contribution is: (a) empirically confirming the benefit of route map schematization as suggested by Galvão et al. (Citation2020), and (b) quantifying the effect that schematization has on interaction with and memorability of route maps. Previous researches on schematic route maps typically focused on analyzing user opinions about their perceived usability or lacked user evaluation altogether (Agrawala & Stolte, Citation2001; Barkowsky et al., Citation2000; Delling et al., Citation2014; Galvão et al., Citation2020; Luxen & Niklaus, Citation2014; Nivala et al., Citation2008).
The results are consistent with previous research and in line with our hypotheses. Participants using the evaluated schematic map type needed considerably fewer interactions with the map device to complete the tasks. Using schematic map type also resulted in more of the environmental surroundings becoming visible in the map viewport for longer. At the same time, schematic map type did not negatively influence the navigation performance. Preliminary evidence supports the thesis that increased visibility might be a contributing factor to better memorability of some of the route map’s elements. We believe the study’s results can contribute to the field of computer graphics and cartography in the scope of designing visualizations for navigation systems that improve the usability of wayfinding support systems and promote orientation (Schwering et al., Citation2017).
Disclosure statement
No potential conflict of interest was reported by the author(s).
Data availability
The data that support the findings of this study are openly available in OSF at DOI 10.17605/OSF.IO/JV9WF.
Additional information
Funding
References
- Agrawala, M., & Stolte, C. (2001). Rendering effective route maps: Improving usability through generalization. In Proceedings of the 28th annual conference on computer graphics and interactive techniques (Vol.1, pp. 241–249). Los Angeles, CA: ACM.
- Anacta, V. J. A., Li, R., Löwen, H., Galvao, M., & Schwering, A. (2018). Spatial distribution of local landmarks in route-based sketch maps. In S. Creem-Regehr, J. Schöning, & A. Klippel (Eds.), Spatial cognition xi (pp. 107–118). Springer International Publishing.
- Anacta, V. J. A., Schwering, A., Li, R., & Muenzer, S. (2017). Orientation information in wayfinding instructions: Evidences from human verbal and visual instructions. GeoJournal, 82(3), 567–583. https://doi.org/10.1007/s10708-016-9703-5
- Barkowsky, T., Latecki, L. J., & Richter, K. F. (2000). Schematizing maps: Simplification of geographic shape by discrete curve evolution. In C. Freksa, C. Habel, W. Brauer, & K. F. Wender (Eds.), Spatial cognition ii: Integrating abstract theories, empirical studies, formal methods, and practical applications (pp. 41–53). Springer Berlin Heidelberg.
- Bartram, D. (1980). Comprehending spatial information: The relative efficiency of different methods of presenting information about bus routes. Journal of Applied Psychology, 65(1), 103. https://doi.org/10.1037/0021-9010.65.1.103
- Bates, D., Mächler, M., Bolker, B., & Walker, S. (2015). Fitting linear mixed-effects models using lme4. Journal of Statistical Software, Articles, 67(1), 1–48. https://www.jstatsoft.org/v067/i01
- Bronzaft, A. L., Dobrow, S. B., & O’Hanlon, T. J. (1976). Spatial orientation in a subway system. Environment and Behavior, 8(4), 575–594. https://doi.org/10.1177/001391657684005
- Bürkner, P.-C. (2017). brms: An R package for Bayesian multilevel models using Stan. Journal of Statistical Software, 80(1), 1–28. https://doi.org/10.18637/jss.v080.i01
- Carpenter, B., Gelman, A., Hoffman, M. D., Lee, D., Goodrich, B., Betancourt, M., Brubaker, M., Guo, J., Li, P., & Riddell, A. (2017). Stan: A probabilistic programming language. Journal of Statistical Software, 76(1), 1. https://doi.org/10.18637/jss.v076.i01
- Chen, C.-H., & Li, X. (2020). Spatial knowledge acquisition with mobile maps: Effects of map size on users’ wayfinding performance with interactive interfaces. ISPRS International Journal of Geo-Information, 9(11), 11. https://doi.org/10.3390/ijgi9110614
- Credé, S., & Fabrikant, S. I. (2018). Let’s put the skyscrapers on the display—decoupling spatial learning from working memory. In P. Fogliaroni, A. Ballatore, & E. Clementini (Eds.), Proceedings of workshops and posters at the 13th international conference on spatial information theory (cosit 2017) (pp. 163–170). Cham: Springer International Publishing.
- Credé, S., Thrash, T., Hölscher, C., & Fabrikant, S. I. (2019). The acquisition of survey knowledge for local and global landmark configurations under time pressure. Spatial Cognition and Computation, 19(3), 190–219. https://doi.org/10.1080/13875868.2019.1569016
- Delling, D., Gemsa, A., Nöllenburg, M., Pajor, T., & Rutter, I. (2014). On d-regular schematization of embedded paths. Computational Geometry, 47(3), 381–406. https://doi.org/10.1016/j.comgeo.2013.10.002
- Dickmann, F. (2012). City maps versus map-based navigation systems – An empirical approach to building mental representations. The Cartographic Journal, 49(1), 62–69. https://doi.org/10.1179/1743277411Y.0000000018
- Dong, W., Liao, H., Liu, B., Zhan, Z., Liu, H., Meng, L., & Liu, Y. (2020). Comparing pedestrians’ gaze behavior in desktop and in real environments. Cartography and Geographic Information Science, 47(5), 432–451. https://doi.org/10.1080/15230406.2020.1762513
- Dong, W., Qin, T., Liao, H., Liu, Y., & Liu, J. (2020). Comparing the roles of landmark visual salience and semantic salience in visual guidance during indoor wayfinding. Cartography and Geographic Information Science, 47(3), 229–243. https://doi.org/10.1080/15230406.2019.1697965
- Dong, W., Wu, Y., Qin, T., Bian, X., Zhao, Y., He, Y., Xu, Y., & Yu, C. (2021). What is the difference between augmented reality and 2d navigation electronic maps in pedestrian wayfinding? Cartography and Geographic Information Science, 48(3), 225–240. https://doi.org/10.1080/15230406.2021.1871646
- Evans, G. W., Skorpanich, M. A., Gärling, T., Bryant, K. J., & Bresolin, B. (1984). The effects of pathway configuration, landmarks and stress on environmental cognition. Journal of Environmental Psychology, 4(4), 323–335. https://doi.org/10.1016/S0272-4944(84)80003-1
- Frankenstein, J. (2015). Human spatial representations and spatial memory retrieval (Unpublished doctoral dissertation). ETH Zurich.
- Galvão, M., Krukar, J., Nöllenburg, M., & Schwering, A. (2020). Route schematization with landmarks. Journal of Spatial Information Science, 21, 99–136. https://doi.org/10.5311/JOSIS.2020.21.589
- Galvão, M., Krukar, J., & Schwering, A. (2021, May). Rio: An application to test human- computer interaction with route maps. OSF. osf.io/4epr6
- Gartner, G., & Radoczky, V. (2005). Schematic vs. topographic maps in pedestrian navigation: How much map detail is necessary to support wayfinding. In Aaai spring symposium: Reasoning with mental and external diagrams: Computational modeling and spatial assistance (Vol.5, pp. 41–47). Palo Alto, CA: AAI Press.
- Godfrey, L., & Mackaness, W. (2017). The bounds of distortion: Truth, meaning and efficacy in digital geographic representation. International Journal of Cartography, 3(1), 31–44. https://doi.org/10.1080/23729333.2017.1301348
- Hölscher, C., Tenbrink, T., & Wiener, J. M. (2011). Would you follow your own route description? cognitive strategies in urban route planning. Cognition, 121(2), 228–247. https://doi.org/10.1016/j.cognition.2011.06.005
- Huang, H., Schmidt, M., & Gartner, G. (2012). Spatial knowledge acquisition with mobile maps, augmented reality and voice in the context of gps-based pedestrian navigation: Results from a field test. Cartography and Geographic Information Science, 39(2), 107–116. https://doi.org/10.1559/15230406392107
- Ishikawa, T., Fujiwara, H., Imai, O., & Okabe, A. (2008). Wayfinding with a gps-based mobile navigation system: A comparison with maps and direct experience. Journal of Environmental Psychology, 28(1), 74–82. https://doi.org/10.1016/j.jenvp.2007.09.002
- Ishikawa, T., & Montello, D. R. (2006). Spatial knowledge acquisition from direct experience in the environment: Individual differences in the development of metric knowledge and the integration of separately learned places. Cognitive Psychology, 52(2), 93–129. https://doi.org/10.1016/j.cogpsych.2005.08.003
- Kim, K., Bock, O., Labadi, B., & Deak, A. (2020). Acquisition of landmark, route, and survey knowledge in a wayfinding task: In stages or in parallel? Psychological Research, 84(1), 1–9. https://doi.org/10.1007/s00426-018-0974-y
- Klippel, A., Tappe, H., & Habel, C. (2003). Pictorial representations of routes: Chunking route segments during comprehension. In C. Freksa, W. Brauer, C. Habel, & K. Wender (Eds.), Spatial cognition iii. spatial cognition 2002 (pp. 11–33). Springer.
- Klippel, A., Tappe, H., Kulik, L., & Lee, P. U. (2005). Wayfinding choremes: A language for modeling conceptual route knowledge. Journal of Visual Languages & Computing, 16(4), 311–329. https://doi.org/10.1016/j.jvlc.2004.11.004
- Krukar, J., Münzer, S., Lörch, L., Anacta, V. J., Fuest, S., & Schwering, A. (2018). Distinguishing sketch map types: A flexible feature-based classification. In S. Creem-Regehr, J. Schöning, & A. Klippel (Eds.), Spatial cognition xi (pp. 279–292). Springer International Publishing.
- Krukar, J., Anacta, V. J., & Schwering, A. (2020, April). The effect of orientation instructions on the recall and reuse of route and survey elements in wayfinding descriptions. Journal of Environmental Psychology, 68(2), 101407. https://doi.org/10.1016/j.jenvp.2020.101407
- Lavie, T., Oron-Gilad, T., & Meyer, J. (2011). Aesthetics and usability of in-vehicle navigation displays. International Journal of Human-Computer Studies, 69(1), 80–99. https://doi.org/10.1016/j.ijhcs.2010.10.002
- Li, R., Korda, A., Radtke, M., & Schwering, A. (2014). Visualising distant off-screen landmarks on mobile devices to support spatial orientation. Journal of Location Based Services, 8(3), 166–178. https://doi.org/10.1080/17489725.2014.978825
- Li, Z. (2015). General principles for automated generation of schematic network maps. The Cartographic Journal, 52(4), 356–360. https://doi.org/10.1080/00087041.2015.1108661
- Löwen, H., Krukar, J., & Schwering, A. (2019). Spatial learning with orientation maps: The influence of different environmental features on spatial knowledge acquisition. ISPRS International Journal of Geo-Information, 8(3), 149. https://doi.org/10.3390/ijgi8030149
- Luxen, D., & Niklaus, P. (2014, November). A practical approach to generating route sketches. In Proceedings of the 2nd ACM SIGSPATIAL international workshop on interacting with maps (pp. 1–7). Dallas/Fort Worth, TX: Association for Computing Machinery. https://doi.org/10.1145/2677068.2677074
- Makowski, D., Ben-Shachar, M. S., & Lüdecke, D. (2019). bayestestr: Describing effects and their uncertainty, existence and significance within the bayesian framework. Journal of Open Source Software, 4(40), 1541. https://doi.org/10.21105/joss.01541
- Manson, S. M., Kne, L., Dyke, K. R., Shannon, J., & Eria, S. (2012). Using eye-tracking and mouse metrics to test usability of web mapping navigation. Cartography and Geographic Information Science, 39(1), 48–60. https://doi.org/10.1559/1523040639148
- Meilinger, T., Hölscher, C., Büchner, S. J., & Brösamle, M. (2007). How much information do you need? Schematic maps in wayfinding and self localisation. In T. Barkowsky, M. Knauff and G. Ligozat, D. R. Montello (Eds.), Spatial Cognition V Reasoning, Action, Interaction (pp. 381–400). Berlin, Heidelberg: Springer Berlin Heidelberg. https://doi.org/10.1007/978-3-540-75666-8_22
- Montello, D. R. (1998). A new framework for understanding the acquisition of spatial knowledge in large-scale environments. In Max J. Egenhofer, Reginald G. Golledge (Eds.), Spatial and temporal reasoning in geographic information systems (pp. 143–154). Oxford University Press. https://doi.org10.1007/978-3-319-05732-3_1
- Montello, D. R., & Raubal, M. (2013). Functions and applications of spatial cognition. In D. Waller & L. Nadel (Eds.), Handbook of spatial cognition (pp. 312–321). American Psychological Association.
- Montello, D. R., Fabrikant, S. I., & Davies, C. (2018). Cognitive perspectives on cartography and other geographic information visualizations. In Daniel R. Montello (Ed.), Handbook of behavioral and cognitive geography (pp. 177–196). Edward Elgar Publishing.
- Münzer, S., Zimmer, H. D., & Baus, J. (2012). Navigation assistance: A trade-off between wayfinding support and configural learning support. Journal of Experimental Psychology. Applied, 18(1), 18. https://doi.org/10.1037/a0026553
- Münzer, S., Zimmer, H. D., Schwalm, M., Baus, J., & Aslan, I. (2006). Computer-assisted navigation and the acquisition of route and survey knowledge. Journal of Environmental Psychology, 26(4), 300–308. https://doi.org/10.1016/j.jenvp.2006.08.001
- Nivala, A.-M., Brewster, S., & Sarjakoski, T. L. (2008). Usability evaluation of web mapping sites. The Cartographic Journal, 45(2), 129–138. https://doi.org/10.1179/174327708X305120
- Nyerges, T. L., Mark, D. M., Laurini, R., & Egenhofer, M. J. (2012). Cognitive aspects of human-computer interaction for geographic information systems (Vol. 83). Springer Science & Business Media.
- OpenStreetMap contributors. (2017). Planet dump https://planet.osm.org.https://www.openstreetmap.org
- Quesnot, T., & Roche, S. (2015). Measure of landmark semantic salience through geosocial data streams. ISPRS International Journal of Geo-Information, 4(1), 1–31. https://doi.org/10.3390/ijgi4010001
- R Core Team. (2020). R: A language and environment for statistical computing [Computer software manual] https://www.R-project.org/
- Richardson, A. E., Montello, D. R., & Hegarty, M. (1999). Spatial knowledge acquisition from maps and from navigation in real and virtual environments. Memory & Cognition, 27(4), 741–750. https://doi.org/10.3758/BF03211566
- Richter, K.-F. (2008). Context-specific route directions: Generation of cognitively motivated wayfinding instructions (Vol. 314). IOS Press.
- Roberts, M. J. (2019). Us versus them: Ensuring practical and psychological utility of measurements of schematic map usability. Proceeding of the 2nd Schematic Mapping Workshop, 20, 23–24. https://www.ac.tuwien.ac.at/files/pub/smw19-position-3.pdf
- Roberts, M. J., Gray, H., & Lesnik, J. (2017, February). Preference versus performance: Investigating the dissociation between objective measures and subjective ratings of usability for schematic metro maps and intuitive theories of design. International Journal of Human-Computer Studies, 98(2), 109–128. https://doi.org/10.1016/j.ijhcs.2016.06.003
- Roberts, M. J., Newton, E. J., Lagattolla, F. D., Hughes, S., & Hasler, M. C. (2013). Objective versus subjective measures of paris metro map usability: Investigating traditional octolinear versus all-curves schematics. International Journal of Human-Computer Studies, 71(3), 363–386. https://doi.org/10.1016/j.ijhcs.2012.09.004
- Roth, R. E., Çöltekin, A., Delazari, L., Filho, H. F., Griffin, A., Hall, A., Korpi, J., Lokka, I., Mendonça, A., Ooms, K., & Van Elzakker, C. P. (2017). User studies in cartography: Opportunities for empirical research on interactive maps and visualizations. International Journal of Cartography, 3(sup1), 61–89. https://doi.org/10.1080/23729333.2017.1288534
- Schmelter, A., Jansen, P., & Heil, M. (2009). Empirical evaluation of virtual environment technology as an experimental tool in developmental spatial cognition research. European Journal of Cognitive Psychology, 21(5), 724–739. https://doi.org/10.1080/09541440802426465
- Schwering, A., Krukar, J., Li, R., Anacta, V. J., & Fuest, S. (2017). Wayfinding Through Orientation. Spatial Cognition and Computation, 17(4), 273–303. https://doi.org/10.1080/13875868.2017.1322597
- Steck, S. D., & Mallot, H. A. (2000). The role of global and local landmarks in virtual environment navigation. Presence: Teleoperators & Virtual Environments, 9(1), 69–83. https://doi.org/10.1162/105474600566628
- Thorndyke, P. W., & Hayes-Roth, B. (1982). Differences in spatial knowledge acquired from maps and navigation. Cognitive Psychology, 14(4), 560–589. https://doi.org/10.1016/0010-0285(82)90019-6
- Wessel, G., Ziemkiewicz, C., Chang, R., & Sauda, E. (2010). Gps and road map navigation: The case for a spatial framework for semantic information. In Proceedings of the international conference on advanced visual interfaces (p. 207-214). Rome, Italy: ACM.
- Winter, S (Ed.). (2014). Landmarks: GIScience for Intelligent Services. In Landmarks. Springer International Publishing. https://doi.org/10.1007/978-3-319-05732-3_1
- Yong-Uk, S., Lee, K.-J., Viswanathan, M., Yang, Y.-K., & Whangbo, T.-K. (2005). Sketch map generation method using leveled spatial indexing technique in a mobile environment. In Proceedings. 2005 ieee international geoscience and remote sensing symposium, Seoul, Korea (South), 2005. igarss ‘05. Vol. 1, p. 6.
- You, M., Chen, C., -w., Liu, H., & Lin, H. (2007). A usability evaluation of web map zoom and pan functions. International Journal of Design, 1(1), 15–25. http://www.ijdesign.org/index.php/IJDesign/article/view/31
Appendix A.
A supplemental Bayesian analysis of inconclusive non-significant results
A.1. The effect of schematic map type on the number of recalled landmarks
In Section 5.2.2, we reported a non-significant outcome of the evaluation of Hypothesis 3.1. However, this p-value does not inform whether the influence of the map type is: non-existing, existing but uncertain, or small. In order to further explain this, we repeated the above analysis of the driving task data in the Bayesian statistical framework, using the brms R package (Bürkner, Citation2017) which is based on Stan (Carpenter et al., Citation2017). We derived indicators of effect existence using the bayestestR package (Makowski et al., Citation2019). The probability of direction (indicating the probability that the effect of schematic map type is positive), equaled and the 89% Highest Density Interval excluded 0 (ranging
on the logit scale). These results indicate a high probability of the positive effect of schematic maps on the recall of point landmarks, although the size of this effect is uncertain. We consider these results inconclusive: there seems to be weak evidence for the possible influence of schematic maps on the recall of point landmarks. This result would partially confirm Hypothesis H3.1 (i.e. only in one task and only on the subset of landmarks).