
ABSTRACT
Maps, like other types of extensive data collections, are usually created and maintained by a larger number of individuals. The number of individuals using the map is even larger in most cases. Considering the complex interaction of these people, the question arises as to why maps can be used meaningfully. Ultimately, the represented geographical reality can rarely be perfectly reconstructed from the map, and misunderstandings are inevitable when using the map. This article sets factors into context that facilitate the readability of a map as well as factors that can lead to misunderstandings and non-interpretability. The creation of a map is thereby considered a complex system the stability, coherence, and heterogeneity of which can be explained by its attractors and, in the temporal context, by means of disruptive behavior and autopoiesis. To this end, a coherence theory of map making and reading is proposed. This allows for a broader perspective on the map-making process and a deeper understanding of a map’s affordances. In particular, the considerations made can serve as a starting point to develop better measures of data quality and fitness for purpose. Finally, a more reflective behavior and active influence on the map-making process is made possible.
1. Introduction
The way a map works is seemingly simple: someone observes geographical realityFootnote1 and represents it in a map such that someone else can decode the information contained in the map and thereby gain at least a partial understanding of geographical reality without the need to experience that reality directly on the ground. However, there are cases where this fails. For example, when place names are misspelled or buildings are entered in the wrong place, or when information is decoded in some other unintentional or misleading way. Besides these cases related to data quality, many other misunderstandings can occur. The position of a place name in the map, for example, is not exclusively determined by the location of the place itself, but also by the space still available in the map face; the interpretation of the position, however, does not necessarily follow the same rules. In addition, the inferences made possible can be consciously influenced by political opinionsFootnote2.
The existence of such cases where unintended inferences are drawn from the map are far from coincidental, as all more extensive map series involve a large number of individuals who collect the necessary data and use them to create a map. In addition, the map reader is, in many cases, not the one who contributed to the creation of the map. So why should a map, or any other extensive geographical data set, not lead to unintended inferences?
Unintended inferences are often considered data quality issues (e.g., Bégin et al., Citation2013; Girres & Touya, Citation2010; Neis et al., Citation2012). This view thrives on the fact that data quality is a common problem but ignores that, in a sense, misunderstandings should actually be the rule. In fact, the creation and impact of maps is complex (e.g., Perkins, Citation2003) and data quality is only one facet of the predicament. This becomes obvious when considering the completeness of the information presented in a map, which goes far beyond data quality considerations (cf., Barrington-Leigh & Millard-Ball, Citation2017), as it inevitably relates to the map reader’s perception, expectations of a map, agreements made on the interpretation of the map, and political messages to be conveyed. Only a broader consideration can thus provide a frame of reference for such and related questions.
The question of why we can read maps is more than just the question of how we visually perceive geometries. Rather, map reading refers to what is represented, and as a purpose-oriented process, the success of map reading must be measured by the successful use of the map. To this end, we consider maps in the context of their creation and use, the former describing the path from the perception of reality to conceptualization, creation of a data base and rendering of the actual map, and the latter describing the perception and interpretation of the map and the resulting actions. The question of why we can read maps thus goes beyond cartographic representation and touches upon questions of the representation of geographical features as dataFootnote3 (Sherman & Tobler, Citation1957). Indeed, these data determine what can be represented on the map in the first place and therefore have an influence on how we can eventually interpret the map. And since the various steps of map making and map reading combine to form a complex network of social interactions, we refer to theories of the Social Sciences and Philosophy in the discourse conducted here.
As a general example, OpenStreetMap (OSM) will be referred to throughout the article. This has two major reasons. First, OSM is one of the most important examples of Volunteered Geographic Information, which is why we have good insight into the process of creating and reading maps in that case. In particular, we can trace how individual collaborators interact, that is, individuals who feel part of the project and contribute to one of the maps based on the OSM data. (To emphasize the role of the collaborators in relation to the data set, we sometimes refer to them as contributors.) Secondly, there are a large number of publications that can shed light on the functioning of map creation and reading. In particular, it has been widely investigated who contributes in what way to the data set from which a map is generated (e.g., Arsanjani et al., Citation2013; Budhathoki & Haythornthwaite, Citation2013; Mooney & Corcoran, Citation2012b; Quinn & MacEachren, Citation2018).
Despite the regular reference to OSM as an example, the discourse is by no means limited to this particular project. Maps based on OSM data are often compared to other maps, the latter sometimes being described as reference data (e.g., Arsanjani et al., Citation2013, Citation2015; Cipeluch et al., Citation2010; Haklay, Citation2010; Helbich et al., Citation2012; Ludwig et al., Citation2011; Neis et al., Citation2012). This is based on the assumption that commercially available data sets and corresponding maps are fundamentally different from maps compiled by volunteers. Although this may be true with regard to the heterogeneity of the data due to a lack of agreement on the nature of the contributions (cf., Cipeluch et al., Citation2010; Haklay, Citation2010), the contrasting comparison seems to be misleading. After all, a multitude of individuals is involved in the data collection and rendering of both commercial and “official” maps, too, and social dynamics can exist in principle as well. While mapping agencies usually have mechanisms in place with the aim to standardize both data collection and map generation, the influence of the individual contributor cannot be denied. And even beyond this, many of the considerations on unintended interpretation and inference apply not only to maps, but also to particular typesFootnote4 of data sets and other representations of geographical information in more general, as these have many parallels (Phillips, Citation1989).
This article addresses why we can read and use maps despite the many reasons why we should not be able to. First, we discuss six mechanisms that suggest the interpretability of maps. The perspectives adopted range from the representation one to the social and emergent ones (Section 2). This is followed by a discussion of the reasons that stand in the way of interpreting a map, including but not limited to the perception issue, the evolution issue, and the collective sense issue (Section 3). These perspectives and issues are finally synthesized and placed in the wider context of maps as complex social and technological systems in themselves and as part of even larger systems. In particular, the stability of the system and corresponding attractors are addressed; the convergence and heterogeneity of the parts of the system are discussed in the context of coherence theories; as well as the temporal evolution of the system in terms of disruptive behavior and autopoiesis (Section 4).
2. Six perspectives on why we can read maps
There are a variety of reasons that suggest the readability of maps. In this section, we shed light on these reasons from six different perspectives, which are shown schematically in . These originate from different schools of thought within Information Science, Cognitive Science, and Social Science and are therefore not fully mutually exclusive. While there might exist more such perspectives, I have made a selection here based on their relevance and the way they emphasize the relationships between the different relevant actors. They were partly derived from existing literature but further refined and specialized to the map medium.
Figure 1. Several perspectives on why we can read maps. a) the map is guided by reality; b) the effect of individual perception on maps is partly systematic in nature; c) maps are a medium meant to communicate information; d) the usage of a map guides how it looks like; e) contributors socially interact and align their efforts; and f) external actors influence and streamline the representations found in the map.
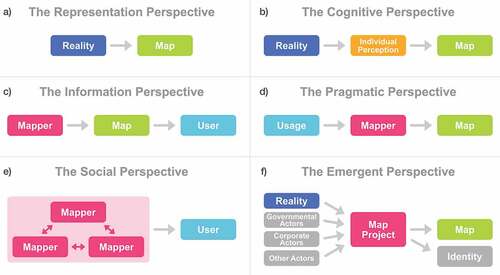
2.1. The representation perspective
Geographical reality primarily determines the content of a map, if the latter is considered a representation of the former. This view is indeed widespread, as Andrews (Citation1996) has shown in a study: the majority of the definitions of a map he found in various print media refer, indeed, to the representative functionFootnote5. Thus, if the representation of the map primarily depicts geographical reality and not the product of individual preferences, this suggests that the map reader is able to reconstruct geographical reality, at least in part.
Although this view seems straight-forward at first, it leaves some room for interpretation as very different aspects of geographical reality can be represented. In addition to the physically existing characteristics of a geography, also those can be represented in a map that are individually or socially constructed but do not or only indirectly manifest themselves physically. Examples of these are speed limits, functions of buildings, bus and train lines, and points of interest (POIs). Instances of potentially more complex geographical concepts, such as places and neighborhoods, can also be represented in principle. However, despite this necessary choice of which geographical aspects should be represented on a map, the existence of geographical reality creates a frame of reference within which the map operates.
2.2. The cognitive perspective
Maps are not the result of a higher authority encoding “objective truth” in visual symbols. Rather, it is individuals who perceive their environment and then represent it. And this individual perception leads to potentially different maps (cf., e.g., Freundschuh & Kitchin, Citation1999; Saarinen, Citation1987; Wood, Citation1972). In the light of this view, the question arises as to why maps should be readable, whether or not there are differences in perception. There are several reasons for this. Perhaps the most important one is that the influences on how we perceive and thus create maps are largely systematic in nature and exhibit structural invariants (Tang et al., Citation2020; Tversky, Citation1981). Therefore, ideally, the influence on mapping and on reading the map balances out, and existing issues can be systematically addressed. Also, the concepts for semantic description seem to be chosen in such a way in case of OSM that they hide the differences in conceptualization arising from individual differences in perception: they are chosen sufficiently coarse and compatible with our perception by being the result of an intensive coordination process (Aliakbarian & Weibel, Citation2016; Mocnik et al., Citation2017; Mocnik, Citation2020).
It is usually not just a single individual who creates a map, but a multitude of individuals. This is interesting insofar as it influences their cognition if individuals consider themselves to form part of a group, as this can trigger emotions and lead to reward (Madan, Citation2017). They usually feel empathy and perceive group cohesion (cf., Nijstad & van Knippenberg, Citation2008). And they align with others when forming part of a group in terms of cognition, shared norms, identities, preferences, et cetera (e.g., Tindale & Kameda, Citation2000). If the cognitive influence on the ways we map thus converges even further, this will again increase the comprehensibility of the resulting map. Further consequences of group dynamics and collaborative mapping activities are discussed in more detail in Section 2.5.
2.3. The information perspective
Maps are a medium of communication, as are books and newspapers, records and CDs, paintings and photographs, and many others. In the context of the sender–receiver model, they therefore play a central role (Andrews, Citation1988; Robinson & Petchenik, Citation1975; Wood, Citation1972): the map creator encodes information in the symbols of a map, which he or she can subsequently communicate; the map reader, in turn, can decode the symbols contained in the map and thus receives corresponding information. Ideally, this works smoothly and the message sent and received match. Although this is usually not the case (Robinson & Petchenik, Citation1975; Wood, Citation1972), the intention to transmit information suggests that the information is encoded in such a way that it can to a large extent be decoded again in a meaningful way. For this reason, national mapping agencies in particular, but also industry, draft and review standards to ensure the smooth transmission of information. The inevitable deviation between the information sent and received can be investigated in practical experiments (Frank, Citation2000; Muller, Citation1987; Robinson, Citation1971; Robinson & Petchenik, Citation1975) and conceptualized as data quality and fitness for purpose (Mocnik et al., Citation2018).
2.4. The pragmatic perspective
The creation of a map is complex and usually carried out for a specific purpose. Even if there may be a variety of motivations for contributing to maps, in particular, if they are meant to serve for a number of applications (Budhathoki & Haythornthwaite, Citation2013; Budhathoki et al., Citation2010; Heipke, Citation2010), it can be assumed that in commercial projects the intended uses are clearly defined, such as in the case of public transport maps (Garland, Citation1994). Also, in volunteered projects many contributors themselves have their own use of the generated map in mind, such as orientation or routing purposes. So if the focus is on the use, it suggests itself that contributors provide the information and generate the corresponding maps in such a way that this use becomes possible. Among the examples are the OpenSkiMap and the OpenSeaMapFootnote6 in case of OSM, as well as the discussion of how the classic map paradigm can be adequately modified such that maps can tell stories in more suitable ways (cf., Keil et al., Citation2018; Mocnik & Fairbairn, Citation2018; Roth, Citation2021). Even creative maps that deviate greatly from the traditional paradigm may still be readable, and they are made for that very reason (cf., Bogucka et al., Citation2020). Pragmatically, most maps would not exist if they did not live up to their intended use.
2.5. The social perspective
A map can be construed as the interplay of individual actions. These actions happen in a shared context and gain meaning as a result. For example, there are usually agreements and a consensus about which aspects of geographical reality should be represented and how this should be done. For if such agreements were not made either explicitly or implicitly, such as through direct communication in forums, Wiki applications, or e-mail lists, then individual differences would be paramount and a shared mode of representation would not exist. However, once the collection of data and the creation of a map are placed in a social context that synchronizes the individual contributions, a common product, the map, emerges. This perspective suggests that the resulting map is comprehensible because map readers intuitively grasp the decisions made in the social context and because they are not distracted by the individual differences of the contributors that become visible on the map.
The social context manifests in several aspects. In the simplest case, a contributor observes how other features in the vicinity are represented when mapping a geographical feature him or herself, in order to then adapt his or her own contribution to it (cf., Stein et al., Citation2015). One reason for this is the will to integrate into the existing social structure of contributors (cf., Heck et al., Citation2020; Holyoak & Simon, Citation1999). Not only features in the immediate environment but also preexisting representations of the feature can have an influence on mapping behavior (cf., Mooney & Corcoran, Citation2012a, Citation2012b). After all, when modifying an existing representation, the contributor often observes only the latest version of the representation, which leads to sequential collaboration (Mayer & Heck, Citation2022). Beyond the very representations, meta-communication has an impact on mapping behavior in many cases. This communication often seeks to reach consensus on what geographical features and what qualities of these should be represented, as well as how they should be represented. Finally, joint activities can be organized in the context of consensus building or the mapping process itself, such as so-called mapathons (Poiani et al., Citation2016; Quill, Citation2018).
The collective of contributing individuals and the image they have of the collective play a central role in this perspective (cf., Budhathoki & Haythornthwaite, Citation2013; Mooney & Corcoran, Citation2012b; Poiani et al., Citation2016; Stein et al., Citation2015). This self-understanding as a collective can, however, vary greatly. For example, this understanding may be shaped primarily by formal arrangements, such as being a company, corporation, or association, or by substantive cooperation. In the latter case, joint action is paramount and thus constitutes the collective as an acting entity from within. If a collective emerges that does justice to this understanding of joint action, a shared identity can also emerge, which the collaborators feel. The self-image as a collective and the identity finally lead to the previously mentioned agreements on how reality is captured in the map.
2.6. The emergent perspective
While acknowledging that a map is usually a product of social action, it can also be viewed as an entity in its own right with emergent qualities. The identity alluded to earlier is shaped in part via the collective and thus the actions of individuals in the social context, but ultimately identity can often only be fully understood in the context of external influences (cf., Georgiou, Citation2003; Ikegami, Citation2000). Similar considerations apply to the complex dynamics of mapping behavior, for example, when a feature can be represented in several ways, but one of these ways prevails because of reasons that can only be understood in the overall context. Consequently, not every quality of a map can and must be seen as a result of social action following the emergent perspective, but maps can also be seen as autonomous entities in a larger context. The perspective described here therefore understands a map and its social function primarily in the larger context of societal influence, such as the interests of state and non-state actors, and their societal use and function grounded at least in part therein.
The various outside interests concerning maps improve their readability, because they tend to align the contexts in which a map has to be interpreted. Even if the descriptive quality of a map is initially oriented toward reality as a silent actor, the influence of cultures and society on this description is evident (cf., Bittner, Citation2014, Citation2017). In addition to descriptive qualities, maps also possess prescriptive and performative ones (Aalbers, Citation2014a, Citation2014b, Citation2014c). Maps can, for instance, be utilized to draw attention to social injustices and uncomfortable truths that would otherwise be inadequately communicated, to then initiate a change of societal perception and action. In such counter-mapping, interest groups emerge as actors who target performative qualities of the map (Peluso, Citation1995; Wood, Citation2010). These various qualities and the associated functions of a map in societal discourse and for societal action make a map appear to be more than just the sum of individual representation, as they give the map a societal meaning. It is quite possible that none of the individual actions involved in the map-making process has such social meaning, but the resulting map does. Ultimately, maps can thus acquire a high social and societal relevance and significance (Perkins, Citation2004; Vaughan, Citation2018).
The emergent perspective is closely related to power relations (Crampton, Citation2001; Schröder-Bergen et al., Citation2021; Wood, Citation1992). For when actors use maps to communicate and persuade, they exert power on the map reader. This external power is itself represented in the map, but is also manifested in the various qualities and functions of the map. This is opposed to the internal power that map makers inevitably possess when they create a map, and which often goes hand in hand with ethical concerns (Harley, Citation1989, Citation1990). Power relations are evident, among others, in the political message and even propaganda conveyed by the map (e.g., Harley, Citation1988). Such power relations can make territorial claims and lead to war (e.g., Bord, Citation2003; Edney, Citation1997; Neocleous, Citation2003). In this context, however, the effects of power relations expressed in maps are by no means historical anecdotes, but are also clearly present in current developments (e.g., Callahan, Citation2009). Because of the importance of power relations to this perspective, the latter is often considered within the framework of critical theory.
3. Six reasons why we should not be able to read maps
In the previous section, we outlined good reasons why we can read maps effectively. However, as much as these reasons may be true, map reading sometimes turns out to be much more difficult than these reasons suggest (cf., Robinson & Petchenik, Citation1975). There are a number of reasons for this, six major ones of which we will examine in more detail in the following.
3.1. The perception issue: individuals perceive differently
Individuals perceive geographical reality differently, simply because we are unique as humans, because we are culturally different, and because we have different previous experiences. The latter includes, among other things, the level of education and cultural background as well as experience with cartography and map handling, but also previous experience of the places we intend to map. In addition, the circumstances in which we perceive and which we represent in the map can be very different. For example, not all individuals involved in the mapping process are necessarily at the same place, especially since it can be mapped remotely. The perspectives shaped by the aforementioned and other factors make fiat objects, that is, those that exist only because of human decision and therefore depend on our cognition (cf., Smith, Citation2001), as well as socially constructed concepts sometimes appear quite different depending on the individual. Even though there are good reasons for mapping similarly despite differences in cognition (cf., Section 2.2), it seems impossible to hide these differences completely. For in the end it is inevitable that the individuality of the individual will have an effect (Wright, Citation1942).
3.2. The representation issue: different representations can be equivalent
There is more than one way to represent geographical reality. This is because geographical features are complex and their conceptualization often vague and fuzzy (cf., Mocnik & Kühl, Citation2022; Montello et al., Citation2003). Ultimately, many of the geographical features are therefore fiat objects, as their conceptualization depends at least partially on human choice (Smith, Citation1995). This circumstance is not problematic in itself, because if the individual representing the feature and the individual reading the map choose a pair of matching representations and interpretationsFootnote7, there will be no ambiguities and misunderstandings. In general, however, there is no reason for both individuals to choose a pair of matching representations and interpretations. This is particularly evident in the fact that different representations can be equivalent in the sense that in principle any of these representations can be chosen to convey the same geographical reality, and a particular understanding of that reality does not yet fully determine the choice of representation. Thus, misunderstandings are inevitable.
3.3. The evolution issue: both reality and the mapping process change over time
Geographical reality is in constant flux and is evolving. It is never static. This view is widespread and has given rise to a host of different schools of thought, such as time geography and nonrepresentational theory (cf., Hägerstrand, Citation1970; May & Thrift, Citation2001; Thrift & Pred, Citation1981). So how can a map show the state at a certain point in time if the process of data acquisition and mapping in most cases takes a longer period of time?Footnote8 Nautical charts illustrate this dilemma particularly well, because their creation has often taken many decades. Following this idea, a map cannot represent only one point in time but must rather represent different ones (Wood, Citation2010, p. 93ff), usually without indicating which ones these are. In addition to the resulting inconsistencies in the map, the context in which the map must be interpreted is to some degree unclear. Since by the time the map is interpreted, it is already out of date, which inevitably means that the context in which the map is read cannot be the context in which it was created.
Also the process of mapping is subject to temporal changes according to the perspectives outlined in Section 2. Here, the change of geographical reality is causal for that of the mapping process, because the former has an influence on our cognition and conceptualization, on the social collaboration, on the interests of different actors, et cetera. The fact that neither geographical reality nor the mapping process is static further complicates meaningful interpretation. Moreover, the processual nature of mapping described above does not allow the resulting map to be described as the intersection of the temporally changing reality and the temporally changing mapping process. Rather, it is a diffuse “overlapping area” that does not suggest a clear choice of interpretation.
3.4. The goal issue: individuals may have different goals
As previously discussed in Section 2, common benefits, goals, and interests suggest that maps can be interpreted. However, if different goals do not align or even contradict each other, the opposite may also be the case. The existence of different mapping styles can, for instance, be attributed to the fact that the motivations for contributing to a map differ greatly (Anderson et al., Citation2019; Schröder-Bergen et al., Citation2021), as in case of people mapping for the purpose of positioning and navigation, for reuse in the creation of thematic maps, for geocoding and reverse geocoding, et cetera. Such differences manifest themselves especially when volunteers and corporate contributors alike participate in the mapping process (Anderson et al., Citation2019; Mooney & Minghini, Citation2017; Schröder-Bergen et al., Citation2021) and data of different origins are imported (Witt et al., Citation2021; Zielstra et al., Citation2013). For in these situations, not only data are added or imported, but also potentially conflicting goals and power relations. Even though the integration of different data sources can contribute to the completeness and quality of the data, it also potentially complicates the interpretation of the data.
3.5. The trust issue: without trust no effective cooperation
Some of the perspectives discussed earlier focus on one or another form of collaborative behavior. However, such behavior presupposes that the participating individuals have trust in each other (Ansell & Gash, Citation2008; Bryson et al., Citation2006, Citation2015; Provan & Kenis, Citation2008; Thomson & Perry, Citation2006). Accordingly, it has been suggested that trust should be used as a proxy for data quality in relation to maps and their data basis (Bishr & Kuhn, Citation2007, Citation2013; Keßler & de Groot, Citation2013). Given the scale that a mapping project can have in terms of the necessary number of individuals involved, it cannot be expected that all individuals trust each other, even though common goals and a group identity can be trust-building. There are, however, reasonable doubts specifically about the common goals in the example of the OSM project (Anderson et al., Citation2019; Schröder-Bergen et al., Citation2021; Witt et al., Citation2021; Zielstra et al., Citation2013).
3.6. The collective sense issue: collective decisions might not be understood as such
Many forms of collaborative behavior mentioned above presuppose that the collaborators feel and understand themselves as part of a group and not just as one of the many independently acting individuals. Otherwise, for example, no group identity and no group consciousness will emerge. Also, it can be assumed that the individuals contributing to the map are aware of their individual decision, but they do not always understand their decision as part of a collective one. This is the case, for instance, if the contributors only include the current version of the map’s data base in deciding whether and how to modify the data and thus collaborate sequentially (cf., Mayer & Heck, Citation2022). If however the full history of the data is included and the considerations pertaining to representation are even made collaboratively, the wisdom of crowds may lead to more appropriate representations (cf., Goodchild, Citation2007; Surowiecki, Citation2004). However, since the completeness of the mapping and thus the current mapping status, especially with regard to the number of features represented in a map, is probably one of the most important motivations to contribute, sequential collaboration is yet widespread at least in the case of OSM.
4. The creation of maps as a complex system
As was discussed in the previous two sections, the emergence of maps needs to be considered from different perspectives. The actors involved in these perspectives – geographical reality, information, affordances of map use, individuals contributing, power relations, and many more – need to be considered in context to explain how maps emerge. This common context can be understood as a complex, partly social system in which actors influence each other. This section addresses the question of whether the system described here is chaotic in the sense of a temporal dynamic and which reasons favor an equilibrium in such a system. For this reason, the previously discussed perspectives are synthesized by placing them in a common context based on the concept of coherence theories of truth.
4.1. Mapping projects as a system
The several perspectives described in Section 2 coexist and complement each other. They collectively provide a more complete picture than any single perspective could. Obviously, this implies an increase in complexity, which makes the holistic view resulting from these perspectives even more difficult to understand.
The system resulting from the various perspectives and supplemented by a few more actors is shown schematically in . In this system, the cycle that is constituted by the creation and use of the map is determining. Individuals who contribute to the map create a mental representation of geographical reality, an individual conceptualization. Physical reality as well as socially constructed and even individually constructed reality plays a role in this. This individuality in conceptualization is among the main reasons that facilitate the creation of different maps, because when aspects of individual conceptualization are represented in data bases and finally as symbols on a map, the result can differ significantly. The interpretation of a map can, in turn, lead to very different actions and corresponding diverse use in the context of geographical reality (Mocnik et al., Citation2018).
Figure 2. Simplified conceptual overview of map creation and use as a complex system. The magenta boxes (agreement and social interaction) exemplify social actors at the prototypical example of OpenStreetMap (OSM).
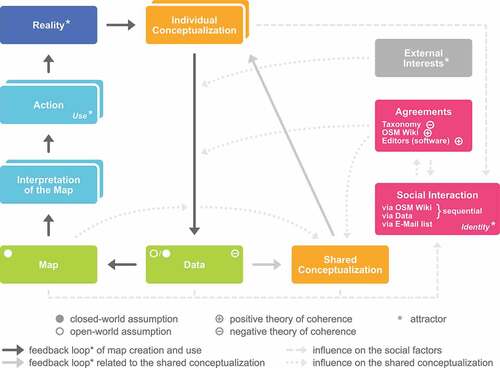
The transfer of the individual conceptualizations into the data set is crucial for the stability of the common representation in this cycle, because the data set exists only once and can therefore per se only reflect one such conceptualizationFootnote9. The interweaving of the individual, relevant actions can intervene in a stabilizing way, which makes the resulting process of map creation far less dependent on individual differences in conceptualization than might at first seem obvious, as discussed earlier in Section 2 and is evident in the system through the many reciprocal influences. If, for instance, individuals trace the various coexisting conceptualizations made by others in the data set, then their own conceptualization and its transfer to the data set may become consciously or unconsciously aligned (Mayer et al., Citation2020; Mocnik et al., Citation2017). The resulting shared conceptualization manifests itself in various aspects, such as a more unified perception of reality, the mechanisms for transferring this conceptualization into the data set and its interpretation, and the map together with the resulting actions, and must therefore be understood as much more than just a shared idea of representation. The social interaction between the individuals and resulting agreements in the form of taxonomies, documentation, and software affect thereby the shared conceptualization.
The creation of a map from the data is not a trivial process. Rather, the technical procedure of transferring formal symbols into visual ones is only one of the many relevant processes in this context. Further processes are initiated through the various requirements concerning the way the map can be used, that is, how it can be interpreted and what actions can be initiated as a result. Checking the success of this interpretation and corresponding actions in the context of geographical reality, for instance, enables conclusions to be drawn about how this transfer of symbols can be optimized. The finished map also has a potential influence on the perception and social interaction in the context of the map project, and thus indirectly once again on the data and their transfer to the map. In particular, questions of generalization, the positioning of labels, and other decisions of this transfer process that are not imposed by the data have, in addition to the direct effect on the resulting map, a potential indirect effect on the data themselves.
4.2. Stability and attractors
Let us now turn to the question of what confers stability on the system in the sense that the data and the map are not arbitrary and do not change unsystematically over time. If we assume that the various actors in the system are interrelated and influence each other accordingly, then the system is dynamic. Dynamic in the sense that small changes can potentially affect the entire system. Guided by the observation that, despite being dynamic, maps do not change constantly but rather often show strong continuity over long periods of time even in the case of collaboratively produced maps, it must be assumed that there is some type of self-control in the system created by attractors and feedback mechanisms. Otherwise, a map could not exist and be used in the long term because the system would regularly change its form.
Indeed, there are several attractors in the system under consideration. Such an attractor is characterized by the fact that it has a dampening effect on the system by influencing and controlling it. Obviously, geographical reality is such an attractor, because it determines what is represented (cf., Section 2.1). However, reality is far from being the only attractor, which is evident from the fact that the data are only made more complete and improved if there is an interest in doing so. In this sense, the use is another attractor (cf., Section 2.4). Not only can individual actors be conceived of as attractors, but also feedback loops. For example, the representation of geographical reality in the form of data and a map and their subsequent use in the context of this very reality forms such a feedback loop. For if the message sent by the representation of reality can be received meaningfully in the sense that it leads to an action that is logical in the context of the original perception and representation of reality, this stabilizes the loop (cf., Section 2.3).
Now, it could be assumed that not only the meaningful enabling of an action but also the correspondence of the message, sent by the representation of reality, and the message, received through an action, is an attractor, because the correspondence of these two already implies the meaningful enabling of an action. However, this assumption must be rejected because an action can already be meaningfully enabled even without an exact correspondence, meaning that an exact match of these two messages is not necessary for successful feedback. For instance, it is not necessary for the map creator and the map reader to have the same idea of the size of the buildings displayed on the map to enable the map reader to navigate using the map. Therefore, there can be no striving of the system for such a correspondence on the basis of enabling navigation-related actions. On the contrary, it is unclear how such a correspondence can be meaningfully defined and verified at all, either theoretically or practically, because the map creator and the map reader are not identical in most cases. However, the meaningful enabling of an action in the context of representations seems practically verifiable and to have such stabilizing effect.
Likewise, common patterns of individual perception mean that the shared conceptualization formed by means of the data can have a stabilizing effect on the individual conceptualization (cf., Section 2.2), for example, when we observe how other individuals contribute to the map. If this feedback loop is established in terms of action patterns and an identity, these can affect the transfer of individual conceptualization into the data set by means of common agreements (cf., Section 2.6). Finally, external interests and power relations have a stabilizing effect on the system, because they aim to systematically influence the representation and the use of this very system. If these attractors did not exist, the system and the resulting map would not exist in the long term.
The stability resulting from the attractors is to be understood in a spatial context. This is due to the explicit or (through culture, national borders and, other factors) implicit space-dependence of reality and its conceptualization, the use of a map, social interaction and the resulting agreements, and external interests. Accordingly, the attractors can vary spatially, which implies spatially varying forms of representation in the data and the map, as well as spatial variations in the balance between the various actors of the system. In a sense, this variation of attractors can be expected to depend continuously on space (cf., Tobler’s First Law of Geography; Tobler, Citation1970) and local stability thus coexists and unfolds in quite different ways. This makes the system appear even more complex.
Finally, it is worth noting that the existence of attractors does not necessarily lead to temporally stable limit states (“fixed points”). Although this is practically the case in many respects – the long-term existence and use of maps has already been discussed as a reason for this – the same cycles may also be passed through repeatedly in the limit case (“limit cycles”). If, for instance, consensus cannot be achieved, data might be changed in cycles (“edit wars;” Glasze & Perkins, Citation2015; Quinn & Bull, Citation2019). But even in such cases, stability seems ultimately achievable and limit cycles remain the exception.
4.3. Coherence
The stability of the system and especially of the map does not yet imply that the latter can be used in a meaningful way. The stability of the map representation seems indeed to be a sensible prerequisite for readability and interpretability, because otherwise, in a certain sense, any map representation could be interpreted in a similar way. More than just the stability of the map representation seems, however, to be necessary in order to be able to use a map in a meaningful way. A map that does not adequately describe reality, for example, because it depicts non-existent geographical features, cannot be used in a meaningful way simply because it remains unchanged over time. Rather, the map must refer to reality in some particular way. As discussed in the previous section with respect to the correspondence of the messages sent and received, a correspondence of the map and the underlying data with reality, although indispensable, is difficult to define and establish. This section therefore addresses the question of how coherence can be defined in the context of the system described here, to then formulate necessary conditions for the interpretability of the map.
In the following, we consider the map and the underlying data as a belief system, that is, a collection of statements describing reality (e.g., BonJour, Citation1985, p. 87ff). Then, coherence can be understood as the quality of this belief system that its statements are entangled and mutually supportive (e.g., Bartelborth, Citation1996; Blanshard, Citation1939; BonJour, Citation1985; Bradley, Citation1939; Petraschka, Citation2014). Following this definition, coherence is a much stronger condition than consistency, that is, the freedom from contradiction of the statements, and consistency is therefore often regarded as a necessary condition for coherence (e.g., Cohen, Citation1978; Stout, Citation1908). The condition of the statements being intertwined and mutually supportive requires a common context in which they can be interpreted. Such a context can be constituted, for example, by spatial proximity and corresponding geographical similarity (cf., Tobler’s First Law of Geography; Tobler, Citation1970), but also by temporal proximity (in the sense that reality does not change too much) and thematic similarity. Coherence therefore often only applies to a certain degree and in a certain context and not necessarily universally.
In the literature, coherence is characterized in different ways. All these characterizations have in common that they refer to the mutual relationships of the statements of the belief system in one form or another. In the case of a data set used to create a map, the representations of geographical entities and their relationships take the place of these statements. One possible characterization of coherence refers to the number of contradictions between the statements, or the geographical entities: a low number of contradictions is commonly regarded as an indicator of coherence (inconsistency condition; Bartelborth, Citation1996, p. 193ff; BonJour, Citation1985, p. 95f; Petraschka, Citation2014, p. 121ff). Such contradictions manifest themselves in data collected to produce a map, for example, by the occurrence of logical inconsistencies that contradict rules derived from geographical reality (cf., Ali et al., Citation2014; Ballatore & Zipf, Citation2015; Barron et al., Citation2014; Girres & Touya, Citation2010; for theoretical underpinning, cf., Mocnik et al., Citation2018). Like a watercourse is not interrupted or even stops without continuing to flow underground or draining into the sea, and individual roads are rarely unconnected to the larger road network. Both logical and other types of inconsistencies can be uncovered when existing representations in the data are reviewed and modified. Therefore, certain modifications and deletions of a representation can be considered indicative of such inconsistencies (Antoniou et al., Citation2016; Bégin et al., Citation2013; Stein et al., Citation2015). The more often a representation is confirmed, perhaps only indirectly by editing spatially adjacent and thematically similar representations without changing or deleting the statement itself, the more secure and strong it can be considered (explanatory strength; Antoniou et al., Citation2016; Bartelborth, Citation1996, p. 193f; Keßler & de Groot, Citation2013; Petraschka, Citation2014, p. 121ff; cf., Stein et al., Citation2015; Touya et al., Citation2017). If the data turn out to be stable over time in the sense that no strong changes occur and a plausible lineage can be observed, this is also an indication of coherence (stability condition; Bartelborth, Citation1996, p. 193ff). It should be noted that different types of collaboration can contribute to explanatory strength, while the stability condition focuses on sequential collaboration.
Besides contradictions, explanatory anomalies can also be regarded as an indication of low coherence (anomaly condition; Bartelborth, Citation1996, p. 193ff; BonJour, Citation1985, p. 99f; Petraschka, Citation2014, p. 121ff). The term “explanatory anomaly” here refers to phenomena of reality that cannot be explained by the statements, although they lie within the explanatory scope of the belief system. For example, the existence of a lake is an explanatory anomaly if it is not represented on the map, although other similar lakes are represented on the map and thus the representation of this missing lake would be expected. It is important to note that an explanatory anomaly does not refer to the phenomenon of reality itself but to its lack of explainability in the context of the belief system. The missing representation of the lake is thus only problematic in terms of the interpretability of the map and the quality of the data if the scope of the map is clearly defined. If, as an example, the type of lakes to be depicted in the map is included in the corresponding data, this can help to understand why the particular lake is not represented in the map due to its type. Or when the minimum size of a lake to be represented is noted. The non-communication of such a scope indeed improves the congruence between what is supposed to be represented and what is de facto represented, because the former is in this case implicitly derived from the latter. At the same time, however, the non-communication of the scope diminishes the message of the map.
The degree to which the statements are interconnected is often seen as another characterization of coherence. For if the various statements are interrelated, they can support each other and make it less likely that the overall statement is true by chance (degree of interconnectedness; Bartelborth, Citation1996, p. 193ff; BonJour, Citation1985, p. 98f; Petraschka, Citation2014, p. 121f). In the context of geographical data, numerous types of relations exist, many of which occur primarily in a local context (cf., Tobler’s First Law of Geography; Tobler, Citation1970). This locality can be traced in numerous real-world networks, which are spanned by geographical and spatial relations (Hecht & Moxley, Citation2009; Mocnik, Citation2015, Citation2018a, Citation2018b). As a consequence, the local degree of interconnectedness is potentially very high and the belief system is characterized by a correspondingly high local coherence (cf., Bittner, Citation2014, Citation2017; Bittner & Glasze, Citation2018; Davidovic et al., Citation2016). The large diameter of geographical networks, in contrast, suggests that distant local contexts are only very indirectly related to each other (cf., Mocnik & Frank, Citation2015), indicating a generally low global coherence (subsystem condition; Bartelborth, Citation1996, p. 193ff; BonJour, Citation1985, p. 98f; Petraschka, Citation2014, p. 121ff).
Finally, the absence of competing explanations is often taken as an indication of strong coherence (competition condition; Bartelborth, Citation1996, p. 193ff). If a map, for instance, represents lakes of the same kind by means of two different symbols, the choice of representation appears to be random as there is no obvious reason to prefer one of the competing kinds of representation over the other. The taxonomy or ontology used in the map and the underlying data has a strong influence on the existence of such competing explanations, especially with regard to their level of detail and appropriate documentation.
4.4. Coherence theories
In case the belief system formed by the map and the data is coherent, this can be considered an indication of a good description of reality in the sense that potentially meaningful actions are made possible. For if many statements, some of which were collected independently by different individuals, support each other, abductive reasoning suggests that this is not a coincidence but guided by reality (cf., Ali et al., Citation2014). Based on this consideration, maps and the underlying data can be discussed in the framework of a coherence theory of truth (cf., Blanshard, Citation1939; Bradley, Citation1939), which understands “truth” as coherence between statements and not, as in the case of a correspondence theory, as correspondence between statements and reality. This view is favorable because the relation of the belief system to reality is judged by largely intrinsic qualities of the belief system itself, making it possible to understand how different interpretations of reality are intertwined and thus support or contradict each other. This is of great importance here, because an absolute understanding of a map representation referring to reality is difficult or impossible to examine – our access to reality is inevitably subject to epistemological limitations. Despite building on the coherence theory of truth, this article will neither define nor discuss what truth is, as is done in many philosophical contexts, but will merely consider coherence as an indicator of the map’s usability.
If we regard the coherence of a map and the underlying data as a belief system in the sense of a theory of truth and if we thus regard coherence as an indicator of the quality to enable actions in a meaningful way, then the question arises how such a theory of truth can be characterized. Given the complexity of the geographical context, it seems inevitable to assume that contradictory statements can exist to a certain degree without making the data or the map appear nonsensical. After all, when several individuals make statements about geographical entities that are difficult to grasp in their totality, slightly different impressions inevitably arise. In this sense, a coherence theory must be moderate in this context (moderate theories of truth; Haack, Citation1993, p. 18ff). Practically, being moderate means that the property of statements to be in agreement or contradiction is considered gradual, as is the degree of interconnectedness, including relations arising by inference (degree of embedding; Bartelborth, Citation1996, p. 193ff; weighted theories of truth; cf., Bartelborth, Citation1996, p. 260).
How comprehensive a map and the underlying data are, can provide an indication of the significance of the coherence theory with regard to the map and the data. If the scope of the map or the data is sufficiently comprehensive, that is, if a large number of classes of geographical features and thematic aspects are represented, incoherences can occur and can thus potentially be detected. It is hence only in this case that coherence can be interpreted as an indicator of the degree to which the map and the data can facilitate actions in a meaningful way. In addition to this internal comprehensiveness there is also an external comprehensiveness (comprehensiveness; BonJour, Citation1985, p. 215ff; Rescher, Citation1973, p. 72ff). The latter refers to the degree to which external factors, such as external interests, the social interaction, and the resulting agreements including the software tools enable a large scope and potentially its expansion (Davidovic et al., Citation2016; Mooney & Minghini, Citation2017).
A coherence theory can be considered from more perspectives than only in terms of the comprehensiveness of the belief system. Rather, it is essential to know which statements are incorporated into the belief system and then interpreted. In the first place, it seems reasonable that only those statements are included in the data and the map for the assumption of which we have concrete reasons. For example, we would not represent a lake in the data and on the map if we did not know of its existence. Other contributors, however, must assume that the statements present in the data are correct until they have evidence to the contrary, because they cannot actively verify the data to any greater extent (negative coherence theory; Pollock & Cruz, Citation1999, p. 70ff, 80ff). Yet, if a statement has not been added to the belief system, then it may be unclear how to interpret this fact. According to the classical paradigm of map interpretation, such statements not claimed and not added to the map are assumed to be false as long as they are within the scope of the map. If at a certain location no lake is indicated on the map although lakes of a certain type and size generally are, then it is usually assumed that no such lake exists at that location (Mocnik & Fairbairn, Citation2018). The same often applies to the data on the basis of which the map is created. In the case of Volunteered Geographic Information (VGI) and especially in the case of OSM, however, it is assumed that some true statements are not included in the data, since no generally accepted notion of completeness has been agreed upon and the completeness of the data and the level of detail varies spatially (closed vs. open-world assumption; Reiter, Citation1977). This can lead to problems especially when creating the map, because the open-world assumption of the OSM data and the closed-world assumption usually made in the context of maps conflict each other.
Coherence theories are not artificial in the sense that they are conceived only for the purpose of a formal description. They rather emerge naturally through the creation and use of maps. The contributors and map readers have to decide how to represent reality and how to interpret the resulting map, whereby they usually judge about the coherence. As discussed earlier, this process is complex and many factors influence the data used to create the map. In the process, explicit or implicit agreements are formed between the contributors. These can also be considered as a belief system and interpreted in the context of a coherence theory. In the case of OSM, for example, the development of the taxonomy can be described by means of a negative coherence theory, because it is created collaboratively and is a folksonomy (Mocnik et al., Citation2017). The OSM Wiki and the editors (software), on the other hand, have a normative function, and they practically represent a consensus of the community. In a sense they are complete, because if a consideration that seems important has not been documented, it can be assumed that there was no (or a different) consensus on it (positive coherence theory; Pollock & Cruz, Citation1999, p. 70ff, 80ff). These co-existing paradigms (open vs. closed-world assumption; positive vs. negative coherence theory; etc.) contribute to the complexity of the system and influence both the creation and the use of the map, including its development over time.
4.5. Convergence and heterogeneity
The temporal amplification of the coherence is causal for the fact that we can read maps in a meaningful way. If the map would become less and less coherent, then in the medium term it could no longer be interpreted by the map reader. Due to its important role, we therefore refer to the temporal amplification of the coherence as the convergence of the system in the following. As convergence plays a role in relation to several actors of the system as was discussed before, it also takes place with respect to different aspects: in relation to which geographical features are represented, how they are represented, and which level of detail is chosen, but also in relation to the agreed granularity of the representation in terms of a taxonomy or other conventions. The interrelatedness of the involved actors implies that the respective convergence of these aspects is though not independent of each other.
Heterogeneity in the representation of geographical features in the data is often used as a proxy for the lack of coherence, and thus data quality (cf., e.g., Ma et al., Citation2015; Mocnik, Citation2021). Heterogeneity here refers to the diversity of the chosen representations (although this is usually not explicitly stated in the literature), but not necessarily to the diversity of the interpretation of these representations. Thus, theoretically, different symbols may be used in a map to represent lakes, which would be a heterogeneous type of representation, without this having to lead to misunderstandings. Following the definitions, a high degree of heterogeneity is an indication of a lack of coherence, and convergence is usually accompanied by a decrease of heterogeneity.
Convergence relates to the decisions on how to update existing representations. A distinction can thereby be made between at least four forms of decision making. Some decisions are made by the individual without the involvement of others, which is why they do not constitute a decision at the collective level (individual decision). This is the case, for instance, if an individual decides to complete the map regarding a certain region and theme without influencing other individuals. In other cases, an individual decision contributes to a collective decision, for example, when individual deliberations lead in the wider discourse to a change in the taxonomy or ontology. In many cases, the individual is aware of this collective decision (conscious collective decision); but in other cases, the individual is unaware of the collective decision, or at least how the individual decision contributes to the collective one (unconscious collective decision). Finally, collective decisions can emerge without individuals having made relevant decisions (emergent collective decision). The overall density of features mapped is not uniform, because OSM contributors individually decide to map features of a certain region that they know well or seems interesting to them.Footnote10 The actual variation of this density can, however, be interpreted as a collective decision. If the dynamics of the system play a role in the individual decision, such as when individuals decide to map where others have mapped before, then the collective decision becomes emergent. In addition to these four forms of decision-making, individual and collective decisions can be entangled to different degrees. The coarser the collectively agreed taxonomy is, for instance, the greater the leeway (and pressure) for an individual decision.
Convergence may not only vary across the various aspects of the system but is often also spatially shaped. As discussed in Section 2.5, the way a geographical feature is represented is often aligned with those of features in spatial proximity. In such cases, convergence occurs locally, while in other cases convergence may be more global in nature. This can be practically investigated by analyzing the local and global heterogeneity of the data. The stronger the globally acting regulatory mechanisms such as external interests and agreements resulting from social interaction are, the more obvious it is to assume that global convergence prevails.
In the case of OSM, an increase in complexity and a diversification of the folksonomy can be observed. As a result, individual decisions take place within a narrower framework, because the social agreements set narrower limits on these decisions, which means in consequence that the representation becomes potentially more and more homogeneous. However, the increase in complexity and diversification also oppose the convergence, because they cause at least a temporary increase in heterogeneity. Indeed, older and more recent representations have different degrees of detail, which potentially allows for more heterogeneity – if there were only one semantic category in the representation, every geographical feature would be represented in the same way. These opposing forces only highlight once more the complexity of the system.
4.6. Evolution, disruptive behavior, and autopoiesis
The creation of a map is a complex undertaking that requires a long period of time. Therefore, maps are in many cases regularly updated and maintained long-term, which also means that the map and the underlying data change over time. Since the existing data have an influence on their further development, it can be assumed that the map and the underlying data improve, for example, in the sense that they become more coherent over time and convergence is taking place, as has been discussed earlier. Given this influence of the current state on future states of the map and the underlying data, this updating of the data should be considered as an evolution of these rather than only a continuous modification.
However, such evolution can by no means be described by a “time evolution operator,” which can infer the next state of the system exclusively from the current one, as is the case in certain physical systems. Rather, the interaction of the different actors is complex and the feedback loops discussed above can lead to unexpected evolution and disruptive behavior of the system. Social processes like the ones involved in the creation of a map can, in particular, foster such disruptive behavior (cf., Centola et al., Citation2018; Grodzins, Citation1957; Jain, Citation2003; Spaiser et al., Citation2016). In addition, upheavals can be observed when framework conditions change. Data imports, for instance, can both have an effect on the completeness and nature of the mapping process, as well as integrate the implicitly imported intentions of the imported data set into the system of map making and reading. In case of OSM, mapping behavior in the USA and other regions for which extensive data imports have taken place differs from that of such regions where such data imports have not taken place (Witt et al., Citation2021; Zielstra et al., Citation2013). Similarly, license changes can affect the system (Neis et al., Citation2013) as well as can external interests (Anderson et al., Citation2019; Schröder-Bergen et al., Citation2021). Already in 2017, company-contributed changes in OSM data make up the majority for some feature classes (Anderson et al., Citation2019).
The system of map making and reading creates itself. At least, it can in the sense of Luhmann’s social system theory be assumed that, considering the inherent complexity and unpredictability described above, the system exists only because it is in a self-stabilizing state (cf., Luhmann, Citation1984, p. 295f). The autopoiesis, that is, this self-creating quality of the system, forms over time and leads to a self-reproduction, which is obviously stronger in the long term than the external and internal influences that lead to disruptive behavior of the system. The attractors discussed in Section 4.2 contribute to the autopoiesis, and coherence and convergence can be understood as its consequence, like discussed in Sections 4.3 and 4.5. However, the autopoietic perspective suggests that the capacity of producing and maintaining itself must be understood not only in the context of these attractors, but at least also as an emergent quality of the system.
5. Conclusion
In this article we have understood one thing above all: how complicated the process of making and reading maps is. A variety of perspectives are necessary to describe this process adequately at least to some degree. Sender–receiver models and pragmatic reasons alone cannot explain why maps are successful. Rather, a multitude of interrelated and mutually influencing factors play a role. Have we then given an answer to the question of why we can read maps? We have, in the sense that we have discussed the mechanisms underlying map creation and map reading. How exactly these are shaped, however, differs depending on the map project. A universal answer is not possible.
The considerations made have relevance beyond the “pure” understanding with regard to data quality and fitness for purpose. Both of these concepts can only be made sense of in the context of the processes that relate a map to reality, such as map-making and map-reading, and the social processes that influence them. In the literature, the influence of social processes on data quality and fitness for purpose has already been discussed, as well as how the former can therefore serve as a proxy for the latter. Interpreting the considerations made here from the perspective of data quality opens up the possibility to develop further measures of data quality and fitness for purpose and to better cross-link and interpret existing ones in context.
Geographical data sets are digitally available in large numbers and increasingly also freely accessible. It therefore seems obvious to use different data sources for the creation of a map. Such combining of existing sources and imports including the corresponding ontology and taxonomy merging lead to interactions between the various social and technological systems underlying the individual data sources. In some cases, there is even a mutual entanglement of the data sets themselves, such as in the case of OSM, Wikipedia, and Wikidata. If future research provides better insights into these mutual influences, this will also lead to a better understanding of the long-term perspective of maps, the underlying data, and the corresponding social processes.
It can be expected that the discourse of this article applies, in principle, also to other systems, as long as they bear a corresponding resemblance to the process of making and reading maps. For example, if one considers maps as a collection of symbols, they degenerate into a special form of a data set. It can accordingly be assumed that this discourse essentially also applies to data sets in general, including their creation and use. In the broader context, it is hoped that collaborative modes of representation such as social media, Volunteered Geographic Information (VGI), and Participatory Geographic Information (PGI) can be better understood. Besides the many parallels to the map-based systems discussed here, there are also differences. The phenomenon of fake news, for instance, consciously reinforces existing incoherence and leads to its own dynamics in social media. In this sense, the discourse conducted here is to be understood as prototypical and must be specialized to the specific case both in the context of maps and in the more general context of data.
Acknowledgements
I would like to gratefully thank Laura Kühl for the discussions that contributed to this article as well as the critical review of the manuscript.
Disclosure statement
No potential conflict of interest was reported by the author.
Data availability statement
Data sharing is not applicable to this article as no new data were created or analyzed in this study.
Additional information
Funding
Notes
1. The term geographical reality is used here in demarcation to the map as well as its creation and use. In a way, this choice of words reflects the philosophical position of scientific realism, because we assume in the context of this article that geographical reality can be meaningfully described by means of maps. Beyond that, however, the choice of words is not intended to communicate any philosophical assumptions.
2. For illustrative examples, see works on border disputes by Kabir (Citation2009) and König and tho Pesch (Citation2013).
3. Maps can even be understood as data, because they can be interpreted to gain information (Phillips, Citation1989).
4. Most of the considerations made here do not apply to automatically generated GPS data or the text media, for example, because these have very different characteristics and can usually not serve as the sole data basis for map production either.
5. This function is not equally pronounced, for instance, in case of paintings, which is why it can be assumed that they are generally worse to “read.”
6. See https://openskimap.org and https://openseamap.org.
7. The processes of representing a geographical feature by a symbol on the map and of interpreting a symbol on the map as a reference to a particular geographical feature are conceptually closely related. This is because the interpretation of a symbol on the map, unless agreed by convention, raises the question of which geographical feature can most likely be represented in a way that matches the very symbol. In this sense, the process of interpreting a map can, in many cases, be understood as the simulation of the process of representing a geographical feature on a map (cf., e.g., Barsalou, Citation1999).
8. A weather map is one of the few exceptions, because it usually represents data that have been measured in a highly automated way and relate to a very short period of time. A map containing political borders or other topographic elements, in contrast, usually relies directly or indirectly on the result of several years of work.
9. Of course, different conceptualizations can be represented in a data base, but ultimately one of these conceptualizations will prevail in the map.
10. There exist further reasons for non-uniform densities, among them political borders, varying regional environments, and co-existing data collection processes.
References
- Aalbers, M. B. (2014a). Do maps make geography? Part 1: Redlining, planned shrinkage, and the places of decline. ACME: An International Journal for Critical Geographies, 13(4), 525–556.
- Aalbers, M. B. (2014b). Do maps make geography? Part 2: Post-Katrina New Orleans, post-foreclosure Cleveland and neoliberal urbanism. ACME: An International Journal for Critical Geographies, 13(4), 557–582.
- Aalbers, M. B. (2014c). Do maps make geography? Part 3: Reconnecting the trace. ACME: An International Journal for Critical Geographies, 13(4), 586–588.
- Ali, A. L., Schmid, F., Al-Salman, R., & Kauppinen, T. (2014). Ambiguity and plausibility: Managing classification quality in volunteered geographic information. In Proceedings of the 22nd ACM International Conference on Advances in Geographic Information Systems (SIGSPATIAL) (pp. 143–152). https://doi.org/10.1145/2666310.2666392 . New York, NY.
- Aliakbarian, M., & Weibel, R. (2016). Integration of folksonomies into the process of map generalization. In Proceedings of the 19th ICA Workshop on Generalisation and Multiple Representation, Helsinki, Finland.
- Anderson, J., Sarkar, D., & Palen, L. (2019). Corporate editors in the evolving landscape of OpenStreetMap. ISPRS International Journal of Geo-Information, 8(5), 232. https://doi.org/10.3390/ijgi8050232
- Andrews, S. K. (1988). Applications of a cartographic communication model to tactual map design. The American Cartographer, 15(2), 183–195. https://doi.org/10.1559/152304088783887008
- Andrews, J. H. (1996). What was a map? The lexicographers reply. Cartographica, 33(4), 1–12. https://doi.org/10.3138/NJ8V-8514-871T-221K
- Ansell, C., & Gash, A. (2008). Collaborative governance in theory and practice. Journal of Public Administration Research and Theory, 18(4), 543–571. https://doi.org/10.1093/jopart/mum032
- Antoniou, V., Touya, G., & Raimond, A.-M. (2016). Quality analysis of the Parisian OSM toponyms evolution. In C. Capineri et al. (Eds.), European handbook of crowdsourced geographic information (pp. 97–112). London, UK: Ubiquity Press. https://doi.org/10.5334/bax.h
- Arsanjani, J. J., Barron, C., Bakillah, M., & Helbich, M. (2013). Assessing the quality of OpenStreetMap contributors together with their contributions. In Proceedings of the 16th AGILE Conference on Geographic Information Science, Leuven, Belgium.
- Arsanjani, J. J., Mooney, P., Zipf, A., & Schauss, A. (2015). Quality assessment of the contributed land use information from OpenStreetMap versus authoritative datasets. In J. J. Arsanjani, A. Zipf, P. Mooney, & M. Helbich (Eds.), OpenStreetMap in GIScience. Experiences, research, and applications (pp. 37–58). Cham, Switzerland: Springer. https://doi.org/10.1007/978-3-319-14280-7_3
- Ballatore, A., & Zipf, A. (2015). A conceptual quality framework for volunteered geographic information. In Proceedings of the 12th Conference on Spatial Information Theory (COSIT) (pp. 89–107). https://doi.org/10.1007/978-3-319-23374-1_5. Santa Fe, NM.
- Barrington Leigh, C., & Millard-Ball, A. (2017). The world’s user-generated road map is more than 80% complete. PLoS ONE, 12(8), e0180698. https://doi.org/10.1371/journal.pone.0180698
- Barron, C., Neis, P., & Zipf, A. (2014). A comprehensive framework for intrinsic OpenStreetMap quality analysis. Transactions in GIS, 18(6), 877–895. https://doi.org/10.1111/tgis.12073
- Barsalou, L. W. (1999). Perceptual symbol systems. The Behavioral and Brain Sciences, 22(4), 577–660. https://doi.org/10.1017/S0140525X99002149
- Bartelborth, T. (1996). Begründungsstrategien. Ein Weg durch die analytische Erkenntnistheorie. Berlin, Germany: Akademie Verlag. https://doi.org/10.1515/9783050073514
- Bégin, D., Devillers, R., & Roche, S. (2013). Assessing volunteered geographic information (VGI) quality based on contributors’ mapping behaviours. In Proceedings of the 8th International Symposium on Spatial Data Quality (pp. 149–154). https://doi.org/10.5194/isprsarchives-XL-2-W1-149-2013. Hong Kong.
- Bishr, M., & Kuhn, W. (2007). Geospatial information bottom-up: A matter of trust and semantics. In Proceedings of the 10th AGILE Conference on Geographic Information Science (pp. 365–387). https://doi.org/10.1007/978-3-540-72385-1_22. Aalborg, Denmark.
- Bishr, M., & Kuhn, W. (2013). Trust and reputation models for quality assessment of human sensor observations. In Proceedings of the 11th Conference on Spatial Information Theory (COSIT) (pp. 53–73). https://doi.org/10.1007/978-3-319-01790-7_4. Scarborough, UK.
- Bittner, C. (2014). Reproduction of social fragmentations in OpenStreetMap: The example of Jerusalem. Kartographische Nachrichten, 64(3), 136–144. https://doi.org/10.1007/BF03544143
- Bittner, C. (2017). Diversity in volunteered geographic information: Comparing OpenStreetMap and Wikimapia in Jerusalem. GeoJournal, 82(5), 887–906. https://doi.org/10.1007/s10708-016-9721-3
- Bittner, C., & Glasze, G. (2018). Excluding effects of cartographic epistemologies – thinking about mapping paradigms in OpenStreetMap and Wikimapia. Kartographische Nachrichten, 3, 120–125. https://doi.org/10.1007/BF03544554
- Blanshard, B. (1939). The nature of thought. London, UK: George Allen & Unwin.
- Bogucka, E. P., Constantinides, M., Aiello, L. M., Quercia, D., So, W., & Bancilhon, M. (2020). Cartographic design of cultural maps. IEEE Computer Graphics and Applications, 40(6), 12–20. https://doi.org/10.1109/MCG.2020.3026596
- BonJour, L. (1985). The structure of empirical knowledge. Cambridge, MA: Harvard University Press.
- Bord, J.-P. (2003). Cartographie, géographie et propagande. De quelques cas dans l’Europe de l’après-guerre. Vingtième Siècle: Revue d’histoire, 80(4), 15–24. https://doi.org/10.3917/ving.080.0015
- Bradley, F. H. (1939). Essays on truth and reality. London, UK: Clarendon.
- Bryson, J. M., Crosby, B. C., & Stone, M. M. (2006). The design and implementation of cross-sector collaborations: Propositions from the literature. Public Administration Review, 66(s1), 44–45. https://doi.org/10.1111/j.1540-6210.2006.00665.x
- Bryson, J. M., Crosby, B. C., & Stone, M. M. (2015). Designing and implementing cross-sector collaborations: Needed and challenging. Public Administration Review, 75(5), 647–663. https://doi.org/10.1111/puar.12432
- Budhathoki, N. R., & Haythornthwaite, C. (2013). Motivation for open collaboration: Crowd and community models and the case of OpenStreetMap. The American Behavioral Scientist, 57(5), 548–575. https://doi.org/10.1177/0002764212469364
- Budhathoki, N. R., Nedović-Budić, Z., & Bruce, B. C. (2010). An interdisciplinary frame for understanding volunteered geographic information. Geomatica, 64(1), 313–320. https://doi.org/10.5623/geomat-2010-0003
- Callahan, W. A. (2009). The cartography of national humiliation and the emergence of China’s geobody. Public Culture, 21(1), 141–173. https://doi.org/10.1215/08992363-2008-024
- Centola, D., Becker, J., Brackbill, D., & Baronchelli, A. (2018). Experimental evidence for tipping points in social convention. Science, 360(6393), 1116–1119. https://doi.org/10.1126/science.aas8827
- Cipeluch, B., Jacob, R., Winstanley, A. C., & Mooney, P. (2010). Comparison of the accuracy of OpenStreetMap for Ireland with Google Maps and Bing Maps. In Proceedings of the 9th International Symposium on Spatial Accuracy Assessment in Natural Resources and Environmental Sciences (Accuracy) (pp. 337–340). Leicester, UK.
- Cohen, L. J. (1978). The coherence theory of truth. Philosophical Studies: An International Journal for Philosophy in the Analytic Tradition, 34(4), 351–360. https://doi.org/10.1007/BF00364702
- Crampton, J. W. (2001). Maps as social constructions: Power, communication and visualization. Progress in Human Geography, 25(2), 235–252. https://doi.org/10.1191/030913201678580494
- Davidovic, N., Mooney, P., Stoimenov, L., & Minghini, M. (2016). Tagging in volunteered geographic information: An analysis of tagging practices for cities and urban regions in OpenStreetMap. ISPRS International Journal of Geo-Information, 5(12), 232. https://doi.org/10.3390/ijgi5120232
- Edney, M. H. (1997). Mapping an empire. The geographical construction of British India, 1765–1843. Chicago, IL: University of Chicago Press.
- Frank, A. U. (2000). Spatial communication with maps: Defining the correctness of maps using a multi-agent simulation. In Proceedings of the International Workshop on Maps and Diagrammatical Representations of the Environment (pp. 80–99). https://doi.org/10.1007/3-540-45460-8_7 . Hamburg, Germany.
- Freundschuh, S. M., & Kitchin, R. (1999). Contemporary thought and practice in cognitive mapping research: An introduction. The Professional Geographer, 51(4), 507–510. https://doi.org/10.1111/0033-0124.00187
- Garland, K. (1994). Mr. Beck’s underground map. A history. Harrow Weald, UK: Capital Transport.
- Georgiou, I. (2003). The idea of emergent property. Journal of the Operational Research Society, 54(3), 239–247. https://doi.org/10.1057/palgrave.jors.2601520
- Girres, J.-F., & Touya, G. (2010). Quality assessment of the French OpenStreetMap dataset. Transactions in GIS, 14(4), 435–459. https://doi.org/10.1111/j.1467-9671.2010.01203.x
- Glasze, G., & Perkins, C. (2015). Social and political dimensions of the OpenStreetMap project: Towards a critical geographical research agenda. In J. J. Arsanjani, A. Zipf, P. Mooney, & M. Helbich (Eds.), OpenStreetMap in GIScience. Experiences, research, and applications (pp. 143–166). Cham, Switzerland: Springer. https://doi.org/10.1007/978-3-319-14280-7_8
- Goodchild, M. F. (2007). Citizens as sensors: The world of volunteered geography. GeoJournal, 69(4), 211–221. https://doi.org/10.1007/s10708-007-9111-y
- Grodzins, M. (1957). Metropolitan segregation. Scientific American, 197(4), 33–41. https://doi.org/10.1038/scientificamerican1057-33
- Haack, S. (1993). Evidence and inquiry. Towards reconstruction in epistemology. Oxford, UK: Blackwell.
- Hägerstrand, T. (1970). What about people in regional science? Papers of the Regional Science Association, 24, 6–21. https://doi.org/10.1007/BF01936872
- Haklay, M. (2010). How good is volunteered geographical information? A comparative study of OpenStreetMap and Ordnance Survey datasets. Environment and Planning B, 37(4), 682–703. https://doi.org/10.1068/b35097
- Harley, J. B. (1988). Maps, knowledge, and power. In D. Cosgrove & S. Daniels (Eds.), The iconography of landscape. Essays on the symbolic representation, design and use of past environments (pp. 277–312). Cambridge, UK: Cambridge University Press.
- Harley, J. B. (1989). Deconstructing the map. Cartographica, 26(2), 1–20. https://doi.org/10.3138/E635-7827-1757-9T53
- Harley, J. B. (1990). Cartography, ethics and social theory. Cartographica, 27(2), 1–23. https://doi.org/10.3138/C211-1512-0603-XJ14
- Hecht, B., & Moxley, E. (2009). Terabytes of Tobler: Evaluating the first law in a massive, domain-neutral representation of world knowledge. In Proceedings of the 9th Conference on Spatial Information Theory (COSIT) (pp. 88–105). https://doi.org/10.1007/978-3-642-03832-7_6 . Aber Wrac’h, France.
- Heck, D. W., Seiling, L., & Bröder, A. (2020). The love of large numbers revisited: A coherence model of the popularity bias. Cognition, 195, 104069. https://doi.org/10.1016/j.cognition.2019.104069
- Heipke, C. (2010). Crowdsourcing geospatial data. ISPRS Journal of Photogrammetry and Remote Sensing, 65(6), 550–557. https://doi.org/10.1016/j.isprsjprs.2010.06.005
- Helbich, M., Amelunxen, C., Neis, P., & Zipf, A. (2012). Comparative spatial analysis of positional accuracy of OpenStreetMap and proprietary geodata. In Proceedings of the GI_Forum (pp. 24–33). Salzburg, Austria.
- Holyoak, K. J., & Simon, D. (1999). Bidirectional reasoning in decision making by constraint satisfaction. Journal of Experimental Psychology: General, 128(1), 3–31. https://doi.org/10.1037/0096-3445.128.1.3
- Ikegami, E. (2000). A sociological theory of publics: Identity and culture as emergent properties in networks. Social Research, 67(4), 989–1029.
- Jain, K. V. P. (2003). Non-linear models of social systems. Economic and Political Weekly, 38(35), 3678–3685.
- Kabir, A. J. (2009). Cartographic irresolution and the line of control. Social Text, 27(4), 45–66. https://doi.org/10.1215/01642472-2009-054
- Keil, J., Mocnik, F.-B., Edler, D., Dickmann, F., & Kuchinke, L. (2018). Reduction of map information regulates visual attention without affecting route recognition performance. ISPRS International Journal of Geo-Information, 7(12), 469. https://doi.org/10.3390/ijgi7120469
- Keßler, C., & de Groot, R. T. A. (2013). Trust as a proxy measure for the quality of volunteered geographic information in the case of OpenStreetMap. In Proceedings of the 16th AGILE Conference on Geographic Information Science (pp. 21–37). https://doi.org/10.1007/978-3-319-00615-4_2. Leuven, Belgium.
- König, D., & tho Pesch, S. (2013). Der Festlandsockelvertrag von 1964 und seine Auswirkungen auf die deutsch-niederländische Küstenmeergrenze. Zeitschrift für ausländisches öffentliches Recht und Völkerrecht, 73, 483–508.
- Ludwig, I., Voss, A., & Krause-Traudes, M. (2011). A comparison of the street networks of Navteq and OSM in Germany. In S. Geertman, W. Reinhardt, & F. Toppen (Eds.), Advancing geoinformation science for a changing world (pp. 65–84). Berlin, Germany: Springer. https://doi.org/10.1007/978-3-642-19789-5_4
- Luhmann, N. (1984). Soziale Systeme. Grundriß einer allgemeinen Theorie. Frankfurt am Main, Germany: Suhrkamp.
- Ma, D., Sandberg, M., & Jiang, B. (2015). Characterizing the heterogeneity of the OpenStreetMap data and community. ISPRS International Journal of Geo-Information, 4(2), 535–550. https://doi.org/10.3390/ijgi4020535
- Madan, C. R. (2017). Motivated cognition: Effects of reward, emotion, and other motivational factors across a variety of cognitive domains. Collabra: Psychology, 3(1), 24. https://doi.org/10.1525/collabra.111
- May, J., & Thrift, N. (Eds.). (2001). Timespace. Geographies of temporality. London, UK: Routledge.
- Mayer, M., & Heck, D. W. (2022). Sequential collaboration: The accuracy of dependent, incremental judgments. Decision. https://doi.org/10.1037/dec0000193
- Mayer, M., Heck, D. W., & Mocnik, F.-B. (2020). Shared mental models as a psychological explanation for converging mental representations of place – the example of OpenStreetMap. In Proceedings of the 2nd International Symposium on Platial Information Science (PLATIAL’19) (pp. 43–50). https://doi.org/10.5281/zenodo.3628871 . Coventry, UK.
- Mocnik, F.-B. (2015). A scale-invariant spatial graph model ( Doctoral thesis). Vienna University of Technology, Vienna, Austria.
- Mocnik, F.-B. (2018a). Dimension as an invariant of street networks. In Proceedings of the 7th International Conference on Complex Networks and Their Applications (pp. 455–457). Cambridge, UK.
- Mocnik, F.-B. (2018b). The polynomial volume law of complex networks in the context of local and global optimization. Scientific Reports, 8(11274). https://doi.org/10.1038/s41598-018-29131-0
- Mocnik, F.-B. (2020). Tracing mental models in cartographic datasets – the case of OpenStreetMap. Abstracts of the International Cartographic Association, 2(5). https://doi.org/10.5194/ica-abs-2-5-2020
- Mocnik, F.-B. (2021). Benford’s law and geographical information – the example of OpenStreetMap. International Journal of Geographical Information Science, 35(9), 1746–1772. https://doi.org/10.1080/13658816.2020.1829627
- Mocnik, F.-B., & Fairbairn, D. (2018). Maps telling stories? The Cartographic Journal, 55(1), 36–57. https://doi.org/10.1080/00087041.2017.1304498
- Mocnik, F.-B., & Frank, A. U. (2015). Modelling spatial structures. In Proceedings of the 12th Conference on Spatial Information Theory (COSIT) (pp. 44–64). https://doi.org/10.1007/978-3-319-23374-1_3. Santa Fe, NM.
- Mocnik, F.-B., & Kühl, L. (2022). (Un)represented places – a case study of two sports venues in Gelsenkirchen and Dortmund. In Proceedings of the 3rd International Symposium on Platial Information Science (PLATIAL’21) (pp. 25–30). https://doi.org/10.5281/zenodo.5767180 . Enschede, the Netherlands.
- Mocnik, F.-B., Mobasheri, A., Griesbaum, L., Eckle, M., Jacobs, C., & Klonner, C. (2018). A grounding-based ontology of data quality measures. Journal of Spatial Information Science, 16, 1–25. https://doi.org/10.5311/JOSIS.2018.16.360
- Mocnik, F.-B., Zipf, A., & Raifer, M. (2017). The OpenStreetMap folksonomy and its evolution. Geo-spatial Information Science, 20(3), 219–230. https://doi.org/10.1080/10095020.2017.1368193
- Montello, D. R., Goodchild, M. F., Gottsegen, J., & Fohl, P. (2003). Where’s downtown? Behavioral methods for determining referents of vague spatial queries. Spatial Cognition and Computation, 3(2–3), 185–204. https://doi.org/10.1080/13875868.2003.9683761
- Mooney, P., & Corcoran, P. (2012a). How social is OpenStreetMap? In Proceedings of the 15th AGILE Conference on Geographic Information Science (pp. 282–287). Avignon, France.
- Mooney, P., & Corcoran, P. (2012b). Who are the contributors to OpenStreetMap and what do they do? In Proceedings of the 20th Annual GIS Research UK (GISRUK), Lancaster, UK.
- Mooney, P., & Minghini, M. (2017). A review of OpenStreetMap data. In G. M. Foody et al. (Eds.), Mapping and the citizen sensor (pp. 37–59). London, UK: Ubiquity Press. https://doi.org/10.5334/bbf.c
- Muller, J.-C. (1987). The concept of error in cartography. Cartographica, 24(2), 1–15. https://doi.org/10.3138/5R70-4W74-1H17-6X06
- Neis, P., Zielstra, D., & Zipf, A. (2012). The street network evolution of crowdsourced maps: OpenStreetMap in Germany 2007–2011. Future Internet, 4(1), 1–21. https://doi.org/10.3390/fi4010001
- Neis, P., Zielstra, D., & Zipf, A. (2013). Comparison of volunteered geographic information data contributions and community development for selected world regions. Future Internet, 5(2), 282–300. https://doi.org/10.3390/fi5020282
- Neocleous, M. (2003). Off the map: On violence and cartography. European Journal of Social Theory, 6(4), 409–425. https://doi.org/10.1177/13684310030064003
- Nijstad, B. A., & van Knippenberg, D. (2008). The psychology of groups: Basic principles. In M. Hewstone, W. Stroebe, & K. Jonas (Eds.), Introduction to social psychology. A European perspective (4th ed., pp. 244–262). Malden, MA: Blackwell.
- Peluso, N. L. (1995). Whose woods are these? Counter-mapping forest territories in Kalimantan, Indonesia. Antipode, 27(4), 383–406. https://doi.org/10.1111/j.1467-8330.1995.tb00286.x
- Perkins, C. (2003). Cartography: Mapping theory. Progress in Human Geography, 27(3), 341–351. https://doi.org/10.1191/0309132503ph430pr
- Perkins, C. (2004). Cartography – cultures of mapping: Power in practice. Progress in Human Geography, 28(3), 381–391. https://doi.org/10.1191/0309132504ph504pr
- Petraschka, T. (2014). Interpretation und Rationalität. Billigkeitsprinzipien in der philologischen Hermeneutik. Berlin, Germany: de Gruyter. https://doi.org/10.1515/9783110351163
- Phillips, R. J. (1989). Are maps different from other kinds of geographic information? The Cartographic Journal, 26(1), 24–25. https://doi.org/10.1179/caj.1989.26.1.24
- Poiani, T. H., dos Santos Rocha, R., Castro Degrossi, L., & de Albuquerque, J. P. (2016). Potential of collaborative mapping for disaster relief: A case study of OpenStreetMap in the Nepal earthquake 2015. In Proceedings of the 49th Hawaii International Conference on System Sciences (pp. 188–197). https://doi.org/10.1109/HICSS.2016.31 . Koloa, HI.
- Pollock, J. L., & Cruz, J. (1999). Contemporary theories of knowledge (2nd ed.). Lanham, MD: Rowman & Littlefield.
- Provan, K. G., & Kenis, P. (2008). Modes of network governance: Structure, management, and effectiveness. Journal of Public Administration Research and Theory, 18(2), 229–252. https://doi.org/10.1093/jopart/mum015
- Quill, T. M. (2018). Humanitarian mapping as library outreach: A case for community-oriented mapathons. Journal of Web Librarianship, 12(3), 160–168. https://doi.org/10.1080/19322909.2018.1463585
- Quinn, S., & Bull, F. (2019). Understanding threats to crowdsourced geographic data quality through a study of OpenStreetMap contributor bans. In N. A. Valcik (Ed.), Geospatial information system use in public organizations (pp. 80–96). New York, NY: Routledge. https://doi.org/10.4324/9780429272851-6
- Quinn, S., & MacEachren, A. M. (2018). A geovisual analytics exploration of the OpenStreetMap crowd. Cartography and Geographic Information Science, 45(2), 140–155. https://doi.org/10.1080/15230406.2016.1276479
- Reiter, R. (1977). On closed world data bases. In H. Gallaire & J. Minker (Eds.), Logic and data bases (pp. 55–76). New York, NY: Plenum. https://doi.org/10.1007/978-1-4684-3384-5_3
- Rescher, N. (1973). The coherence theory of truth. Oxford, UK: Oxford University Press.
- Robinson, A. H. (1971). Discussion: An interchange of ideas and reactions. Cartographica, 8(2), 46–53. https://doi.org/10.3138/CJ11-02Q4-2284-0308
- Robinson, A. H., & Petchenik, B. B. (1975). The map as a communication system. The Cartographic Journal, 12(1), 7–15. https://doi.org/10.1179/caj.1975.12.1.7
- Roth, R. E. (2021). Cartographic design as visual storytelling: Synthesis and review of map-based narratives, genres, and tropes. The Cartographic Journal, 58(1), 83–114. https://doi.org/10.1080/00087041.2019.1633103
- Saarinen, T. F. (1987, September). Centering of mental maps of the world (Unpublished discussion paper). University of Arizona, Tucson, AZ.
- Schröder-Bergen, S., Glasze, G., Michel, B., & Dammann, F. (2021). De/colonizing OpenStreetMap? Local mappers, humanitarian and commercial actors and the changing modes of collaborative mapping. GeoJournal. https://doi.org/10.1007/s10708-021-10547-7
- Sherman, J. C., & Tobler, W. R. (1957). Multiple use concept in cartography. The Professional Geographer, 9(5), 5–7. https://doi.org/10.1111/j.0033-0124.1957.095_5.x
- Smith, B. (1995). On drawing lines on a map. In Proceedings of the 2nd Conference on Spatial Information Theory (COSIT) (pp. 475–484). https://doi.org/10.1007/3-540-60392-1_31 . Semmering, Austria.
- Smith, B. (2001). Fiat objects. Topoi, 20(2), 131–148. https://doi.org/10.1023/A:1017948522031
- Spaiser, V., Hedström, P., Ranganathan, S., Jansson, K., Nordvik, M. K., & Sumpter, D. J. T. (2016). Identifying complex dynamics in social systems: A new methodological approach applied to study school segregation. Sociological Methods & Research, 47(2), 103–135. https://doi.org/10.1177/0049124116626174
- Stein, K., Kremer, D., & Schlieder, C. (2015). Spatial collaboration networks of OpenStreetMap. In J. J. Arsanjani, A. Zipf, P. Mooney, & M. Helbich (Eds.), OpenStreetMap in GIScience. Experiences, research, and applications (pp. 167–186). Cham, Switzerland: Springer. https://doi.org/10.1007/978-3-319-14280-7_9
- Stout, G. F. (1908). Immediacy, mediacy and coherence. Mind, 17(65), 20–47.
- Surowiecki, J. (2004). The wisdom of crowds. New York, NY: Anchor.
- Tang, M., Falomir, Z., Freksa, C., Sheng, Y., & Lyu, H. (2020). Extracting invariant characteristics of sketch maps: Towards place query-by-sketch. Transactions in GIS, 24(4), 903–943. https://doi.org/10.1111/tgis.12621
- Thomson, A. M., & Perry, J. L. (2006). Collaboration processes: Inside the black box. Public Administration Review, 66(s1), 20–32. https://doi.org/10.1111/j.1540-6210.2006.00663.x
- Thrift, N., & Pred, A. (1981). Time-geography: A new beginning. Progress in Human Geography, 5(2), 277–286. https://doi.org/10.1177/030913258100500209
- Tindale, R. S., & Kameda, T. (2000). ‘Social sharedness’ as a unifying theme for information processing in groups. Group Processes & Intergroup Relations, 3(2), 123–140. https://doi.org/10.1177/1368430200003002002
- Tobler, W. R. (1970). A computer movie simulating urban growth in the Detroit region. Economic Geography, 46, 234–240. https://doi.org/10.2307/143141
- Touya, G., Antoniou, V., Olteanu-Raimond, A.-M., & van Damme, M.-D. (2017). Assessing crowdsourced POI quality: Combining methods based on reference data history, and spatial relations. ISPRS International Journal of Geo-Information, 6(3), 80. https://doi.org/10.3390/ijgi6030080
- Tversky, B. (1981). Distortions in memory for maps. Cognitive Psychology, 13(3), 407–433. https://doi.org/10.1016/0010-0285(81)90016-5
- Vaughan, L. (2018). Mapping society. The spatial dimensions of social cartography. London, UK: UCL Press. https://doi.org/10.14324/111.9781787353053
- Witt, R., Loos, L., & Zipf, A. (2021). Analysing the impact of large data imports in OpenStreetMap. ISPRS International Journal of Geo-Information, 10(8), 528. https://doi.org/10.3390/ijgi10080528
- Wood, M. (1972). Human factors in cartographic communication. The Cartographic Journal, 9(2), 123–132. https://doi.org/10.1179/00087041.9.2.p123
- Wood, D. (1992). The power of maps. New York, NY: Guilford.
- Wood, D. (2010). Rethinking the power of maps. New York, NY: Guilford.
- Wright, J. K. (1942). Map makers are human: Comments on the subjective in maps. The Geographical Review, 32(4), 527–544. https://doi.org/10.2307/209994
- Zielstra, D., Hochmair, H., & Neis, P. (2013). Assessing the effect of data imports on the completeness of OpenStreetMap. A United States case study. Transactions in GIS, 17(3), 315–334. https://doi.org/10.1111/tgis.12037