
ABSTRACT
There has been a limited amount of research focused on the design of landslide maps, which are considered as one of the potential means to communicate disaster risks to the public. Hence, this article aims to conduct a systematic review of the process involved in creating landslide maps specifically for the purpose of disaster risk communication with non-expert users. While this topic is still under-studied, it has gained increasing coverage in the peer-reviewed literature over the past five years. The review examines the variations in the process of creating landslide maps, considering aspects such as planning, mapping techniques, presentation, and dissemination. However, there are several areas that require improvement, including diversifying the types of maps, considering the role and involvement of users, developing more user-friendly designs, and reducing reliance on experts during the dissemination process. The findings of this review provide valuable insights into the current limitations in establishing these maps and offer guidance for future research in this field.
1. Introduction
Landslides have resulted in devastating calamities across numerous countries globally. Researchers have extensively documented the significant consequences due to landslides each year, encompassing loss of life, injuries, financial setbacks, and the deterioration of public infrastructure (Calvello & Pecoraro, Citation2018; Leng et al., Citation2022; Sultana, Citation2020). The rapid expansion of development and human settlements in regions susceptible to landslides is believed to be a primary contributing factor that exacerbates the associated risks of disasters over time (ISDR-ICL, Citation2015). Simultaneously, mitigating these risks has become increasingly challenging (Shinohara & Kume, Citation2022) due to the effects of ongoing climate change, which is projected to substantially amplify the frequency and/or intensity of landslide events that trigger disasters (Chiang & Chang, Citation2011).
In response to the global climate crisis, The International Consortium on Landslides (ICL) organized a series of meetings with the aim of allowing every nation to share their latest technologies and strategies for mitigating landslide risks (Alcántara-Ayala & Sassa, Citation2021). The most recent and noteworthy gathering, known as the world landslide forum, took place in Japan in 2020. This forum resulted in the establishment of the Kyoto Landslide Commitment framework (KLC2020). The framework introduced a fresh approach to implementing the Sendai Landslide Partnership 2015–2030, emphasizing the provision of essential tools, platforms, information, and technical expertise to key actors and stakeholders. This approach is deemed vital for promoting global-scale reduction of landslide risks (ICL-IPL, Citation2021). Since then, developing various media to enable open communication between experts, government and society become one of the priorities works to date (KLC2020, action 5).
Maps have been widely acknowledged as a dependable medium for effectively communicating disaster risks to the public (Albano & Sole, Citation2018). They play a crucial role in helping individuals comprehend the spatial and temporal characteristics of various risk factors, including hazards, vulnerability, exposure, and capacity. By presenting information through maps, users are prompted to gain a better understanding of the spatial context, thereby enhancing their awareness of potential disasters (Tsai et al., Citation2021). Furthermore, maps specifically designed for public interests offer an excellent opportunity to enhance people’s perception of risks, minimize personal vulnerabilities, and foster the credibility of social data (Dransch et al., Citation2010).
When it comes to the field of landslide research, numerous researchers have dedicated their efforts to creating maps that facilitate the implementation of disaster risk reduction measures (Jaboyedoff et al., Citation2012; Lee et al., Citation2018; Thiery et al., Citation2020). The quality of these maps has witnessed significant advancements with the advent of high-resolution Digital Elevation Models (DEMs), satellite imagery, and image-based photogrammetry techniques (Barbarella et al., Citation2019; Gomez & Hotta, Citation2021; Verbovšek et al., Citation2019). Various statistical and machine-learning approaches have been also extensively employed to study maps pertaining to landslide hazards and risks (Abdulwahid & Pradhan, Citation2017; Fanos et al., Citation2020). However, it is worth noting that these maps were primarily tailored to cater to the needs of specialists rather than non-expert users.
Designing a landslide map intended for non-expert users necessitates a distinct approach compared to maps created for specialists. It is crucial to carefully deliberate on various factors to ensure that individuals with limited knowledge of disasters can readily comprehend the information conveyed by the map. To avoid overwhelming complexity, certain studies (Coratza et al., Citation2021; Griffiths & Abraham, Citation2008) have suggested that maps tailored for laypeople should contain less scientific data compared to those intended for expert users. Emphasizing the utilization of simple yet visually appealing symbols should be given priority to pique people’s interest in the map. Additionally, the choice of background is also an important consideration, as it significantly impacts the map’s readability and comprehensibility (Peng et al., Citation2021).
While there has been a growing focus and concern regarding the use of landslide maps for communicating disaster risks, there is a notable absence of articles that specifically review their design and visualization aspects. This article aims to fill that gap by conducting a systematic review of the design of landslide maps for the purpose of disaster risk communication. The findings of this review will provide valuable insights into the current state of map design, identify research gaps, and offer opportunities for future analysis. The ultimate goal is to enhance the quality of landslide maps, which serve as a crucial medium for effectively communicating risks to the public.
This article is structured into five sections for clarity and organization. Following the introduction, the second section delves into the scope of the review, encompassing the definitions of relevant terminologies and contextual frameworks employed to guide the review process. The third section outlines the methodology employed, with a primary focus on the application of the systematic review approach. Moving forward, the fourth section presents the results and engages in a comprehensive discussion of the current advancements and limitations in designing landslide maps for disaster risk communication. Lastly, the concluding remarks, positioned as the fifth section, provides a concise summary of all the findings, and underscores their significance in shaping future research endeavors.
2. Scope of review
In this study, landslide maps are defined as maps specifically designed for the purpose of disaster risk communication, targeting non-expert users such as the local community, the general public, teachers, local agencies, and other stakeholders willing to participate in disaster risk reduction (DRR) activities. It is important to note that the concept of disaster risk communication extends beyond solely assessing losses (Alcántara-Ayala, Citation2018), and thus, landslide maps encompass a broader range of maps intended to educate and motivate communities to actively engage in disaster risk reduction measures. Nevertheless, this review does not encompass landslide maps specifically designed for environmental and land use planning purposes. This exclusion is due to the fact that while these maps do contribute to mitigating disaster risks, they are typically tailored for experts employed within government agencies (Hadmoko et al., Citation2010).
Disaster risk communication maps can take the form of static graphic or interactive web-based mapping. However, the landslide maps reviewed in this article are referring to static graphic maps, rather than interactive web mapping products. Despite the greater popularity of web-based mapping products, static maps possess certain advantages, which make them worth exploring and learning about. Static maps do not require additional devices or internet connectivity for dissemination, making them more suitable for disaster risk communication purposes (Song et al., Citation2022) particularly for individuals residing in remote areas who may have limited access to the internet or familiarity with digital devices. Furthermore, the process of recognizing and comprehending the information presented in a static map demands less effort compared to an interactive web-based map (Hegarty et al., Citation2003; Tversky et al., Citation2002). Consequently, this facilitates the map user to extract information more efficiently.
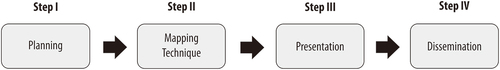
When considering map design, it can be approached from two perspectives, as outlined by Tyner (Citation2014). Firstly, it pertains to the visual arrangement of the map, aiming to make it visually appealing and user-friendly. Secondly, design is regarded as a comprehensive process that begins well before the maps are created and encompasses the selection of the most suitable dissemination technique for end-users. This study specifically focuses on the latter definition, delving into four key steps () proposed by Tyner (Citation2014) in the map-making process.
Figure 1. The workflow of the map design modified from Tyner (Citation2014).
3. Methodology
A systematic search method which encompassed searching, screening, and content analysis steps was implemented to locate pertinent literature. This methodology is commonly employed across diverse scientific disciplines to mitigate bias in the selection of materials and enhance the reliability of the obtained results (de Jesús Arce-Mojica et al., Citation2019; Liquete et al., Citation2013). It is particularly well-suited for studying specific topics (Snyder, Citation2019), such as the focus of the present study, which addresses the specific issue of landslide map design for risk communication purposes. The subsequent subsections provide a comprehensive explanation of the process and outcomes achieved at each stage.
3.1. Searching
The Scopus and International Consortium on Landslides (ICL) book series were used as data sources to find the representative maps reviewed in this study. Scopus, being a comprehensive repository, includes a wide range of high-impact journals focusing on natural hazards, disaster management, and mapping, which are crucial for this research. On the other hand, the ICL book series consists of peer-reviewed articles contributed by esteemed landslide experts from around the world. The utilization of these two data sources is vital due to their provision of up-to-date progress in landslide-related research and technological advancements.
The searching process in Scopus database was conducted using a Boolean operator. To expand the quest, several types of landslide terminology, such as “rockfall,” “debris flow,” “lateral spreading,” and “earth flow,” were utilized instead of using “landslide” as the only keyword. Then, the term “map” was also used to search for articles related to landslide mapping. Eventually, some keywords such as “communication,” “education,” “community,” and “awareness” were applied as filters to ensure that the map was used for its actual purposes. However, since some articles in the ICL book series were unable to be detected using the Boolean operator, the searching process for these sources were conducted manually using the exact strings as Scopus.
The article searches intentionally avoided specifying temporal limitations, especially within the Scopus database. This approach aimed to provide a comprehensive overview of landslide maps, covering a wide range of time periods from the earliest to the most recent. In addition, it is important to analyze when the discussion on the design of landslide maps for disaster risk communication purposes first emerged in that scientific publications and how it has evolved over time. When this screening process was conducted in May 2022, a minimum of 66 Scopus articles published between January 2013 and April 2022 and 10 ICL articles published in 2017, 2018 and 2021, met the string requirements and satisfied for the next process in the systematic approach.
3.2. Screening
After the initial searching process, each detected article underwent a screening phase to eliminate irrelevant ones that were deemed unsuitable for further analysis. This screening process involved considering specific criteria such as non-English language and incomplete text articles. Simultaneously, the articles that met the specified criteria were individually examined to ensure that they focused on landslide mapping for risk communication purposes. Of utmost importance was that the authors had included images of the landslide maps in their papers. As a result of the screening process, a total of 8 relevant articles, encompassing 13 maps, which are outlined in , met the criteria for the subsequent content analysis step.
Table 1. The list of document sources that meet the screening criteria.
Although the number of maps reviewed in this article may appear small, they encompass a wide range of information essential for comprehending the concept of disaster risk. The details regarding natural processes and social aspects are the two crucial pieces of information to explain how natural phenomena, like landslides, transform into hazards and give rise to disaster risk (Ismail-Zadeh, Citation2022). In the context of cartography, Henstra et al. (Citation2019) emphasizes that high-quality maps designed to communicate disaster risk should not merely depict the extent of the hazard zone, but should also incorporate information concerning social factors, such as vulnerability levels and the tangible or intangible consequences resulting from the hazard. Furthermore, the 13 maps examined in this study not only provide information about the natural characteristics of landslides [Map2–4, Map6, Map9–11, Map13], but also encompass social aspects [Map1, Map5, Map7–8, Map12], thereby effectively representing the typical landslide maps created for the purpose of disaster risk communication.
3.3. Content analysis
A comprehensive analysis of 13 maps derived from 8 articles was conducted using the sub-coding approach. This particular approach has been widely utilized in numerous reviews that entail extensive data analysis (Yazdani et al., Citation2021). Furthermore, it helps to obtain clear boundaries regarding the extent to which the information is evaluated (Wicks, Citation2017). In this study, the main focus lies on analyzing the four steps of designing map proposed by Tyner (Citation2014). Tyner’s explanation of important factors to consider at each step serves as a reference for constructing the reviewed sub-codes. However, certain modifications were made to the sub-codes to enhance their relevance to this study’s aim and scope. For instance, sub-codes pertaining to map formats or presentation media have been excluded due to the uniformity observed in all reviewed maps, which are static and non-web maps presented in paper media. Additionally, the sub-codes regarding map editing during the dissemination stage has been omitted as the reviewed articles generally did not provide such information. Finally, each step in the process of designing a landslide map is translated into several sub-coding frameworks or attributes, illustrated in .
Figure 2. The sub-coding framework for the analysis of landslide maps design (modified from Tyner (Citation2014)).
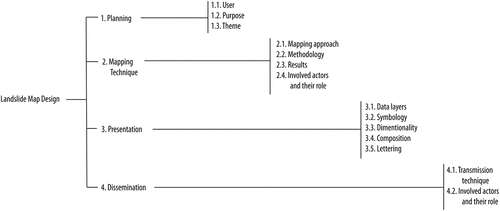
During the initial step, we examined the planning design of landslide maps, incorporating a series of inquiries such as the intended user, the map purpose, and the primary theme conveyed. However, as this article solely focuses on reviewing landslide maps intended for non-expert users and utilized as a means of disaster risk communication, the first and second sub-codes within the planning step were not addressed. Consequently, only the third sub-code, which pertains to the theme, or the main information depicted on these maps, was identified, and subjected to analysis.
In the second step, we utilized four sub-codes to elucidate the techniques employed in the map-making process. The initial aspect addressed the choice of mapping approach, followed by the methodology employed for data collection or analysis, as well as the intended data presented on the map. This second step ended by evaluating the actors involved alongside their respective roles in the map-making process.
In the third step, we employed five sub-codes to characterize the presentation of the landslide maps. The first sub-code, data layers, pertains to the catalog of information displayed on the map. Symbology refers to the representation of data on the map which is described based on its form and visual type, while dimensionality relates to the commonly employed background that illustrates the morphological condition of the mapped area. Composition or layout describes the arrangement of the map on paper, while lettering encompass the additional texts, words or sentences that elucidate the symbols or clarify the conveyed messages.
In the final step, two sub-codes were utilized to depict the dissemination process of the landslide maps. The first sub-code elucidated how the map makers communicate the results to the users. Lastly, the second sub-code outlined the individuals involved and the roles they played in the dissemination process.
4. Results and discussion
4.1. Planning
Various landslide map themes were found in the disaster risk communication agenda (). These were classified as follows: (1) maps focusing on landslide controlling factors, (2) inventory maps, (3) zoning maps, and (4) evacuation maps.
Table 2. The themes found in the landslides map for disaster risk communication.
The initial theme identified in this study falls under the category of landslide-controlling factor maps. This theme encompasses maps that showcase the natural or physical environment, which significantly influences the likelihood of landslides. Within this review, examples of such maps include slope [Map10] and geological maps [Map2, Map11]. These landslide-controlling factor maps were developed to assist individuals in recognizing areas within their natural environment that are prone to landslides.
The subsequent theme identified in this review pertains to landslide inventory maps, which illustrate the spatial distribution of previous landslide occurrences [Map13, Map3]. These maps hold significant importance for non-experts by providing precise information about the specific locations of post-landslide events [Map13]. This information is beneficial for identifying neighborhoods that require heightened awareness regarding the potential impact of future landslides [Map3].
The subsequent theme uncovered in this review pertains to zoning-based landslide maps. The first and second types of zoning maps are susceptibility maps [Map4] and hazard maps [Map6, Map9], which share certain similarities. These maps illustrate the likelihood of an area being susceptible to landslides in the future based on the natural and physical characteristics of the land surface. However, unlike the susceptibility map, which primarily aims to predict the location, the hazard map also incorporates information regarding the frequency and magnitude of potential landslides. The third example is the exposure map [Map5, Map7], which highlights the likelihood of individuals, or their assets being impacted or harmed by landslides. The level of exposure can be evaluated either by considering the population residing in the area [Map5] or by measuring the distance of assets from regions prone to landslides [Map7].
The final theme discovered in this literature review pertains to evacuation maps. The primary objective of these maps is to provide the public with crucial information regarding the appropriate locations to seek out during any disaster or crisis period. Evacuation maps serve as guides, directing individuals away from areas susceptible to landslides or approaching regions with the lowest level of danger [Map8]. These maps direct people toward designated disaster shelters [Map1] or highlight alternative routes (roads) that connect to the designated safer meeting points [Map8].
Landslide maps employed in disaster risk communication encompass a diverse range of themes, primarily due to the inclusion of landslide-controlling factor maps. Since landslides are strongly influenced by local environmental conditions (Wang et al., Citation2014; Wu et al., Citation2022), the information about their causative factors in specific areas needs to be mapped and communicated to the public. This enables the community to gain awareness of the characteristics associated with areas prone to landslides, thereby enhancing their level of preparedness toward disasters (Chen & Huang, Citation2013).
Nevertheless, there remains a limited variety of landslide-controlling factor maps. Landslides are intricate geomorphic processes influenced by various factors within the environment, including slope morphology, geology, soil characteristic, hydrology, geomorphology, and land use (Pratiwi et al., Citation2019; Tufano et al., Citation2021; Wadhawan et al., Citation2020). However, when it comes to maps intended for communicating landslide risk, only geology and slope are commonly depicted among these factors. Whereas, there are other significant factors that should be communicated, including geomorphological maps that provide a comprehensive understanding of landslide events and areas prone to future occurrences (Nonomura et al., Citation2020). Furthermore, soil maps play a crucial role by providing detailed characteristics of unconsolidated materials, such as thickness, texture, and clay minerals. These maps are valuable resources in assisting individuals in recognizing the causative factors of landslides within their local areas.
This current study identified gaps concerning landslide zoning maps. Despite the various types of maps have been explored in this review, none of them addressed the topic of vulnerability and capacity, which are essential for comprehending disaster risk (Chen & Wu, Citation2016). Vulnerability refers to the condition that arises from physical, social, or economic factors that determine the extent of damage or loss suffered by individuals during a disaster (Rivera & Kapucu, Citation2015). On the other hand, capacity refers to the ability of individuals or community members in a specific area to implement measures aimed at reducing disaster risk (Gallopín, Citation2006). The lack of both types of maps suggests that, despite numerous researchers conducting landslide vulnerability or capacity mapping, their map products are primarily tailored for the scientific community or experts, rather than explicitly targeting public or non-expert users.
4.2. Mapping technique
The summary of the mapping technique employed in landslide maps is shown in . The data has been reorganized according to themes, facilitating comparative analysis among maps of the same type.
Table 3. Mapping techniques used in each landslide map.
In this review, all the landslide-controlling factors were generated using an expert mapping approach, where the mapmakers, predominantly academics, were responsible for the entire map-making process. Various methodologies were employed to acquire the necessary data. For instance, in the creation of a geological map for a Mexican city, the mapmakers adapted an existing geological map that was initially developed for mining purposes [Map2]. In another scenario, a geological map of an Indonesian village was generated through expert field investigations, as there was a lack of a local-scale geological map in that area [Map11]. Furthermore, available spatial data, such as slope information derived from a digital elevation model-based satellite imagery, were utilized to create landslide-controlling factor maps [Map10].
The landslide inventory maps identified in this review were developed using either an expert approach or a participatory approach. In the case of a city in the Philippines, a group of academics played as the mapmakers who conduct the entire map-making process. This involved identifying landslide-prone areas using multi-year aerial photographs or high-resolution satellite images and validating the resulting map through ground verification [Map3]. A slightly different scenario emerged in the creation of a landslide inventory map through participatory mapping in a community in Vietnam [Map13]. While academics retained control over the map-making process, the local community was actively engaged in field-based verification of the map.
The process of creating landslide zoning maps revealed the utilization of both expert and participatory mapping approaches. An example of the expert mapping approach is evident in the development of landslide susceptibility and exposure maps for a Mexican city, which were entirely carried out by academics. On the other hand, in the case of participatory mapping, there were two levels of non-expert involvement in the map-making process. The first level involved minor engagement, where the local community served as data providers, sharing information about historical landslide occurrences in their neighborhoods [Map6][Map7]. In this case, academics took charge of the primary data analysis, such as hazard and exposure assessments, as well as map representation. The second level encompassed major involvement, where the local community took on the primary responsibility for the entire map-making process, including data collection, hazard assessments, and map presentation [Map8]. In this category, academics assumed an advisory role during the map creation process.
In contrast to the other themes, all the landslide evacuation maps documented in this study were created through participatory mapping. These maps were developed by actively involving villagers or the local community in the map-making process. Typically, the community members played a significant role in determining the evacuation routes and identifying suitable locations for shelters. Throughout this participatory mapping process, academics offered assistance to the community, such as providing hazard or risk maps [Map8], converting manual maps into digital versions [Map1], or guiding the selection of optimal routes and shelters for evacuation [Map12].
In conclusion, two mapping approaches are employed for creating landslide maps in the context of disaster risk communication: expert mapping and participatory mapping. The expert mapping approach involves specialists exclusively, who undertake the entire map-making process, including planning, data collection, processing, and representation. This approach is typically employed to produce highly accurate maps. It avoids the involvement of individuals with limited knowledge and skills in mapping to maintain the quality of the maps.
In contrast, participatory mapping, also known as community-based mapping, is a technique that involves members of the community who also serve as the map users in the map-making process. The objective of this approach is to enhance the usability of maps, as many studies suggest that involving a number of users in the process of map creation leads to increased utilization of maps in the future (Cochrane & Corbett, Citation2020; Gaillard & Pangilinan, Citation2010). However, this study reveals that community involvement in generating landslide maps poses challenges. While some researchers claim to adopt participatory mapping (Klimeš et al., Citation2019; Thanh et al., Citation2021), their level of community engagement is relatively low, and only a few individuals play a central role in the map-making process. Furthermore, when local people participate in crucial stages such as hazard assessment, the accuracy of the map tends to decrease due to the utilization of simplified analytical methods. This raises important questions about the frequency and extent of community involvement. By appropriately allocating roles and responsibilities to experts and the public, it is hoped that the resulting landslide maps can meet the criteria from both scientific and user perspectives.
4.3. Presentation
The summary of the map presentation was shown in , while the obtained data was reorganized according to the map theme, aiming to promote the comparative analysis of maps of the same type.
Table 4. The presentation designs for each landslide map.
The presentation of the landslide-controlling factor maps conveyed a sense of simplicity and minimalism. The primary information was predominantly conveyed through area or volume symbols, employing either an area-class map (chorochromatic map) or a choropleth map for visualization. Additionally, supplementary data included some natural layers such as geological structures and rivers [Map10, Map11], as well as cultural layers such as roads and administration’s boundaries [Map2]. Hillshade was commonly employed as a map background in the themes related to landslide controlling factors due to its ability to generate a three-dimensional depiction of the topography, offering significant advantages in visual representation. The layout of this map theme consisted of a title, main map, and legend, occasionally incorporating information about the mapper. Finally, the text explanation was limited to clarifying the meaning of each symbol in the legend.
The landslide inventory maps presented in this study exhibit slight variations in their design. The first version [Map3] overlays the landslide area onto high-resolution aerial photographs, effectively depicting the potentially affected region as supplementary information. Its layout consists of a title, main map, and legend. On the other hand, the second version [Map13] represents landslide features (scarp, deposition, and direction) through lines placed above the contour lines. The road network information is visualized using line symbols, serving as an additional data layer in this map. Unlike the first version, this map lacks a legend but includes several randomly placed landslide images at the map’s corners. The written explanation is concise, except for the information concerning this natural disaster and elevation codes displayed on the map frame.
The designs of zoning maps exhibited a range of simplicity and complexity. The simplest design was observed in the landslide hazard map produced in Indonesia [Map9]. It utilized red, yellow, and green points to denote different hazard levels, without any map background. Conversely, other maps predominantly employed a choropleth map with hillshade [Map4, Map5, Map6] or aerial photography [Map7] as their background. These zoning maps commonly included crucial information regarding landslide symptoms, warning signs, or shelters, presented through pictorial point symbols. The most frequently observed layout format for zoning maps consisted of the title, main map, and legend. The most intricate examples were evident in the landslide hazard and debris flow maps generated in Peru. Additional frames were utilized to explain the functions of these maps, define the significance of hazard levels, and outline their implications for land use recommendations.
While the type of data layers and symbol variations remain relatively consistent, the three evacuation maps exhibit slight variations in their backgrounds. In one instance, easily discernible land uses are employed as map backgrounds to aid communities in accessing evacuation routes and crucial shelters [Map1]. Alternatively, contour lines are occasionally utilized to determine optimal routes that avoid steep slopes susceptible to landslides [Map8]. Furthermore, risk zones can also serve as map backgrounds, guiding individuals toward routes and shelter locations in areas least impacted by landslides [Map12].
Map presentation is crucial in determining maps efficacy for disaster risk communication. Those produced for laypeople need to possess a different visualization design from that generated for academics. Several studies reported that maps for laypeople should have less scientific data, simple but attractive symbols, and adequate explanation of technical terms to reduce user difficulty (Regolini-Bissig, Citation2010).
The review on landslide maps in this study reveals that most mapmakers possess a comprehension of map design principles. Firstly, they avoid overwhelming the maps with excessive scientific data and instead incorporate familiar local elements, such as public buildings and roads, which are easily identifiable by the public (Van Kerkvoorde et al., Citation2018). Secondly, certain maps offer personalized experiences by enabling individuals to locate their own homes or neighborhoods, fostering a sense of inclusion within the map (Kellens et al., Citation2009). Lastly, many maps employ pictorial symbols that closely resemble real-world objects, enhancing their visual appeal and ensuring easy recognition for users.
However, there is still room for improvement in the presentation aspect of the maps, particularly in terms of the cartographic layout. The majority of the reviewed maps followed a conventional structure consisting of a title, main map, and legend. This traditional layout approach restricts mapmakers from incorporating narrative elements that aid in helping non-experts understand the meaning behind the map’s symbols (de Bruijn et al., Citation2016). By conveying information through storytelling or narratives, users can gain a better understanding of the implicit message conveyed by the map. Furthermore, incorporating narratives can enhance the informativeness, persuasiveness, and memorability of maps for users (Roth, Citation2021). Therefore, there is a challenge in exploring new cartographic layout models that allow mapmakers to integrate more narrative or storytelling elements, thus enhancing the effectiveness of landslide maps as media for communicating disaster risks in the future.
Another opportunity for map presentation improvement lies in the geovisualization section. Effective visualization of land surface features is essential when depicting maps associated with geohazard phenomena (Mossa et al., Citation2019), as it can generate more realistic visuals that aid users in comprehending the map’s information. In the context of landslide maps, it is crucial to incorporate a 3D visualization of land surface forms, as it provides a sense of slope that is closely linked to the landslide process. With the advancements in remote sensing and photogrammetry data, there is now a significant potential to create more accurate 3D representations of the Earth’s surface. Consequently, exploring 3D visualization images and integrating them into maps presents a noteworthy challenge for mapmakers, enabling the creation of more meaningful information pertaining to landslides.
4.4. Dissemination
Dissemination technique acts as a catalyst for users to interact with and perceive information from the map. The results of the transmission technique and the actors involved in the dissemination activity are shown in .
Table 5. Dissemination techniques of each landslide map.
The dissemination process of landslide maps involves the utilization of at least four techniques. The most employed technique is community discussion, where mapmakers present the maps to the public. In these discussions, the maps are displayed, and mapmakers provide explanations regarding their purpose and how to interpret them. Community discussions typically take place during village community forums or cultural events and can span from a single session to several days [Map10, Map9].
The second technique employed for sharing landslide maps with users is workshops. Unlike community discussions that primarily involve verbal exchanges, workshops facilitate a more hands-on approach, enabling users to engage in practical activities to comprehend the maps. Workshops are commonly utilized for participatory-based landslide maps, where users actively participate in the map-making process. For instance, in certain Indonesian villages, a workshop was conducted to train individuals on generating a landslide evacuation map and instruct them on its practical utilization in drilling initiatives [Map8, Map12].
Landslide maps can also be distributed to users through the utilization of an atlas. An atlas refers to a compilation of landslide maps in a specific region, designed, printed, and compiled into a book format. These atlases of landslides can be presented during community meetings or showcased in city auditoriums, allowing visitors to freely peruse the book [Map2, Map3, Map4]. Another dissemination technique mentioned in this study involves the use of information boards. The primary objective of information boards is to provide access to the map for anyone, at any time. Typically, these boards are displayed in high-traffic areas such as village offices, traditional markets, or public spaces [Map8, Map12].
The design of transmission techniques utilized in map dissemination plays a crucial role in achieving communication objectives. A well-designed dissemination approach ensures the avoidance of noise that may hinder users from obtaining complete information from the map. Furthermore, it is also essential to minimize or eliminate meta-messages and ambiguous interpretations within the dissemination design.
When it comes to disseminating landslide maps to the public, workshops and community discussions are the preferred methods commonly embraced by academics. These direct forms of communication, as described above, aim to bridge the information gap between mapmakers and users. Additionally, dissemination techniques like workshops have proven to be effective in influencing audiences to showcase their newly acquired knowledge (Tanner & Hale, Citation2002). However, both community discussions and workshops heavily rely on the presence of experts. In essence, the dissemination process becomes challenging when conducted without the participation of experts, thus restricting the accessibility of these techniques to a wider target audience.
An atlas and an information board can be employed as alternative techniques to overcome the limitations posed by workshops and community discussions. These techniques offer the advantage of allowing information dissemination at any time, without the need for expert presence. However, when maps are disseminated without expert assistance, it is crucial to ensure a proper presentation design that is easily comprehensible to users (Dransch et al., Citation2010). Many of the landslide maps examined in this study adhere to conventional presentation designs, where map explanations are predominantly contained within the legend. The limited narrative elements in conventional map designs increase the risk of user confusion when interpreting map messages during the dissemination process without expert guidance. For instance, the geological map employed for landslide risk communication in an Indonesian village [Map2] solely presents information about the names of lithologies, without further elaboration on their susceptibility to this disaster, the reasons behind certain types being more vulnerable than others, or the scale and types of landslides that may occur in this geological context.
5. Concluding remarks
This study aimed to investigate the extent to which static landslide maps have been designed for the purpose of public communication and identify any existing limitations. While the availability of articles on landslide maps for non-expert users in academic journals is relatively scarce, all but one of the reviewed articles were published within the past five years, indicating an increasing focus on this topic among landslide experts. However, despite this growing attention, the review identifies several challenges in designing landslide maps for effective disaster communication, which are summarized in the following four points.
Map ’s theme. There is an urgency to develop more diverse types of maps, especially those related to landslide-controlling factors such as geomorphology, hydrology, soil characteristics, and risk-related themes such as vulnerability and capacity.
Mapping technique. The mapping approach is an important key that controls the quality of the map in terms of accuracy and presentation design. However, when employing participatory mapping techniques, it is essential to carefully determine the extent and stage of involvement of non-experts to uphold the map’s accuracy and representation standards.
Presentation. The cartographic design of a map plays a crucial role in facilitating user comprehension. However, many existing landslide maps predominantly adhere to conventional layouts that only include titles, the main map, and a legend, which may not effectively convey their intentions and core messages. To address this, the concept of map-based visual storytelling is proposed as a potential solution to create a more user-friendly map design. Furthermore, it is important to explore the utilization of modern tools such as satellite imagery and photogrammetry to generate more impactful and meaningful visualization on the map.
Dissemination technique. It is essential to ensure that landslide maps are well-designed to facilitate effective communication even in the absence of experts. Therefore, discovering novel approaches to map presentations can help reduce the reliance on experts during the dissemination process.
The findings of this review highlight the crucial role of collaboration between academics and other stakeholders in addressing the challenges associated with creating effective landslide maps for disaster risk communication in the future. In today’s technologically advanced era, Geographic Information System software is widely accessible beyond the cartographer community, making map creation seemingly effortless. However, it is important to emphasize that while many can design maps, not everyone possesses the skill to craft high-quality ones. Even academics well-versed in landslide research may struggle to design a user-friendly map. Therefore, it becomes essential for landslide experts to have a solid foundation in cartography as well as disaster risk communication science. Moreover, fostering collaborations with other experts such as graphic design, computer science, social sciences, and cultural sciences could yield substantial advantages in producing maps that are not only more diverse in theme and meaningful in their presentation but also user-friendly and easily distributable to the public.
Supplemental Material
Download Zip (96.3 KB)Acknowledgments
The authors would like to thank Dr. Mucahid Mustafa Bayrak for his positive and constructive inputs to the early manuscript. This article is part of the first author’s doctoral thesis about the role of visual story in improving the effectiveness of geomorphological maps as landslide risk communication instruments supported by National Science and Technology Center for Disaster Reduction, Taiwan, ROC [Grant Number NCDR -S-111024].
Disclosure statement
No potential conflict of interest was reported by the author(s).
Supplementary material
Supplemental data for this article can be accessed online at https://doi.org/10.1080/15230406.2023.2264754.
References
- Abdulwahid, W. M., & Pradhan, B. (2017). Landslide vulnerability and risk assessment for multi-hazard scenarios using airborne laser scanning data (LiDAR). Landslides, 14(3), 1057–1076. https://doi.org/10.1007/s10346-016-0744-0
- Albano, R., & Sole, A. (2018). Geospatial methods and tools for natural risk management and communications. ISPRS International Journal of Geo-Information, 7(12), 470. https://doi.org/10.3390/ijgi7120470
- Alcántara-Ayala, I. (2018). TXT-tool 4.052-1.2 landslide risk communication. In K. Sassa, B. Tiwari, K. F. Liu, M. McSaveney, A. Storm, & H. Setiawan (Eds.), Landslide dynamics: ISDR-ICL landslide interactive teaching tools (Vol. 2, pp. 731–742). Springer. https://doi.org/10.1007/978-3-319-57777-7_47
- Alcántara-Ayala, I., Garnica-Peña, R. J., Murillo-García, F. G., Salazar-Oropeza, M. O., Méndez-Martínez, A., & Coll-Hurtado, A. (2018). Landslide disaster risk awareness in Mexico: Community access to mapping at local scale. Landslides, 15(8), 1691–1704. https://doi.org/10.1007/s10346-018-1010-4
- Alcántara-Ayala, I., & Sassa, K. (2021). Contribution of the International Consortium on landslides to the implementation of the Sendai framework for disaster risk reduction: Engraining to the science and technology roadmap. Landslides, 18(1), 21–29. https://doi.org/10.1007/s10346-020-01539-8
- Barbarella, M., Cuomo, A., DiBenedetto, A., Fiani, M., & Guida, D. (2019). Topographic base maps from remote sensing data for engineering geomorphological modelling: An application on coastal Mediterranean landscape. Geosciences (Switzerland), 9(12), 500. https://doi.org/10.3390/geosciences9120500
- Calvello, M., & Pecoraro, G. (2018). FraneItalia: A catalog of recent Italian landslides. Geoenvironmental Disasters, 5(1). https://doi.org/10.1186/s40677-018-0105-5
- Chen, C. Y., & Huang, W. L. (2013). Land use change and landslide characteristics analysis for community-based disaster mitigation. Environmental Monitoring and Assessment, 185(5), 4125–4139. https://doi.org/10.1007/s10661-012-2855-y
- Chen, S. C., & Wu, C. Y. (2016). Annual landslide risk and effectiveness of risk reduction measures in Shihmen watershed, Taiwan. Landslides, 13(3), 551–563. https://doi.org/10.1007/s10346-015-0588-z
- Chiang, S. H., & Chang, K. T. (2011). The potential impact of climate change on typhoon-triggered landslides in Taiwan, 2010–2099. Geomorphology, 133(3–4), 143–151. https://doi.org/10.1016/j.geomorph.2010.12.028
- Cochrane, L., & Corbett, J. (2020). Participatory mapping. Handbook of Communication for Development and Social Change, 705–713. https://doi.org/10.1007/978-981-15-2014-3_6
- Coratza, P., Bollati, I. M., Panizza, V., Brandolini, P., Castaldini, D., Cucchi, F., Deiana, G., Del Monte, M., Faccini, F., Finocchiaro, F., Gioia, D., Melis, R., Minopoli, C., Nesci, O., Paliaga, G., Pennetta, M., Perotti, L., Pica, A., Tognetto, F., … Giardino, M. (2021). Advances in geoheritage mapping: Application to iconic geomorphological examples from the Italian landscape. Sustainability, 13(20), 11538. https://doi.org/10.3390/su132011538
- de Bruijn, K. M., Lips, N., Gersonius, B., & Middelkoop, H. (2016). The storyline approach: A new way to analyse and improve flood event management. Natural Hazards, 81(1), 99–121. https://doi.org/10.1007/s11069-015-2074-2
- de Jesús Arce-Mojica, T., Nehren, U., Sudmeier-Rieux, K., Miranda, P. J., & Anhuf, D. (2019). Nature-based solutions (NbS) for reducing the risk of shallow landslides: Where do we stand? International Journal of Disaster Risk Reduction, 41(August), 101293. https://doi.org/10.1016/j.ijdrr.2019.101293
- Dransch, D., Rotzoll, H., & Poser, K. (2010). The contribution of maps to the challenges of risk communication to the public. International Journal of Digital Earth, 3(3), 292–311. https://doi.org/10.1080/17538941003774668
- Fanos, A. M., Pradhan, B., Alamri, A., & Lee, C. W. (2020). Machine learning-based and 3d kinematic models for rockfall hazard assessment using LiDAR data and GIS. Remote Sensing, 12(11), 1755. https://doi.org/10.3390/rs12111755
- Gaillard, J. C., & Pangilinan, M. L. C. J. D. (2010). Participatory mapping for raising disaster risk awareness among the youth. Journal of Contingencies and Crisis Management, 18(3), 175–179. https://doi.org/10.1111/j.1468-5973.2010.00614.x
- Gallopín, G. C. (2006). Linkages between vulnerability, resilience, and adaptive capacity. Global Environmental Change, 16(3), 293–303. https://doi.org/10.1016/j.gloenvcha.2006.02.004
- Gomez, C., & Hotta, N. (2021). Deposits’ morphology of the 2018 Hokkaido Iburi-Tobu earthquake mass movements from LiDAR & aerial photographs. Remote Sensing, 13(17), 3421. https://doi.org/10.3390/rs13173421
- Griffiths, J. S., & Abraham, J. K. (2008). Factors affecting the use of applied geomorphology maps to communicate with different end-users. Journal of Maps, 4(1), 201–210. https://doi.org/10.4113/jom.2008.89
- Hadmoko, D. S., Lavigne, F., Sartohadi, J., Hadi, P., & Winaryo. (2010). Landslide hazard and risk assessment and their application in risk management and landuse planning in eastern flank of Menoreh Mountains, Yogyakarta Province, Indonesia. Natural Hazards, 54(3), 623–642. https://doi.org/10.1007/s11069-009-9490-0
- Hegarty, M., Kriz, S., & Cate, C. (2003). The roles of mental animations and external animations in understanding mechanical systems. Cognition and Instruction, 21(4), 209–249. https://doi.org/10.1207/s1532690xci2104_1
- Henstra, D., Minano, A., & Thistlethwaite, J. (2019). Communicating disaster risk? An evaluation of the availability and quality of flood maps. Natural Hazards and Earth System Sciences, 19(1), 313–323. https://doi.org/10.5194/nhess-19-313-2019
- ICL-IPL. (2021). Kyoto 2020 commitment for global promotion of understanding and reducing landslide disaster risk. https://doi.org/10.1007/978-3-030-60196-6_7
- ISDR-ICL. (2015). ISDR-ICL Sendai Partnerships 2015-2025 for global promotion of understanding and reducing landslide disaster risk. http://wlf5.iplhq.org/wp-content/uploads/2018/01/ISDR-ICL-Sendai-Partnerships-2015-2025-18.01.08.pdf
- Ismail-Zadeh, A. (2022). Natural hazards and climate change are not drivers of disasters. Natural Hazards, 111(2), 2147–2154. https://doi.org/10.1007/s11069-021-05100-1
- Jaboyedoff, M., Oppikofer, T., Abellán, A., Derron, M.-H., Loye, A., Metzger, R., & Pedrazzini, A. (2012). Use of LIDAR in landslide investigations: A review. Natural Hazards, 61(1), 5–28. https://doi.org/10.1007/s11069-010-9634-2
- Jaiswal, P., & van Westen, C. J. (2013). Use of quantitative landslide hazard and risk information for local disaster risk reduction along a transportation corridor: A case study from Nilgiri district, India. Natural Hazards, 65(1), 887–913. https://doi.org/10.1007/s11069-012-0404-1
- Karnawati, D., Fathani, T. F., Wilopo, W., & Andayani, B. (2018). TXT-tool 4.062-1.1 community hazard maps for landslide risk reduction. In K. Sassa, B. Tiwari, K. F. Liu, M. McSaveney, A. Storm, & H. Setiawan (Eds.), Landslide dynamics: ISDR-ICL landslide interactive teaching tools (Vol. 2, pp. 599–606). Springer International Publishing. https://doi.org/10.1007/978-3-319-57777-7_36
- Karnawati, D., Fathani, T. F., Wilopo, W., & Maarif, S. (2018). TXT-tool 4.062-1.1 a socio-technical approach for landslide mitigation and risk reduction. In K. Sassa, B. Tiwari, K. F. Liu, M. McSaveney, A. Storm, & H. Setiawan (Eds.), Landslide dynamics: ISDR-ICL landslide interactive teaching tools (Vol. 2, pp. 621–630). https://doi.org/10.1007/978-3-319-57777-7_38
- Kellens, W., Vanneuville, W., Ooms, K., & De Maeyer, P. (2009). Communicating flood risk to the public by cartography. In Proceedings of the 24th International Cartographic Conferences, Santiago Chile, February 2016, 1–11.
- Klimeš, J., Rosario, A. M., Vargas, R., Raška, P., Vicuña, L., & Jurt, C. (2019). Community participation in landslide risk reduction: A case history from Central Andes, Peru. Landslides, 16(9), 1763–1777. https://doi.org/10.1007/s10346-019-01203-w
- Lee, C.-F., Huang, W.-K., Chang, Y.-L., Chi, S.-Y., & Liao, W.-C. (2018). Regional landslide susceptibility assessment using multi-stage remote sensing data along the coastal range highway in northeastern Taiwan. Geomorphology, 300, 113–127. https://doi.org/10.1016/j.geomorph.2017.10.019
- Leng, Y., Kong, X., He, J., Xing, A., Zhang, Y., & Wang, Q. (2022). The July 10, 2020, red-bed landslide triggered by continuous rainfall in Qianxi, Guizhou, China. Landslides, 19(6), 1421–1433. https://doi.org/10.1007/s10346-022-01851-5
- Liquete, C., Piroddi, C., Drakou, E. G., Gurney, L., Katsanevakis, S., Charef, A., Egoh, B., & Bograd, S. J. (2013). Current status and future prospects for the assessment of Marine and coastal ecosystem services: A systematic review. PLoS ONE, 8(7), e67737. https://doi.org/10.1371/journal.pone.0067737
- Mossa, J., Chen, Y., & Wu, C. (2019). Geovisualization geoscience of large river floodplains. Journal of Maps, 15(3), 75–91. https://doi.org/10.1080/17445647.2019.1584129
- Nonomura, A., Fujisawa, K., Takahashi, M., Matsumoto, H., & Hasegawa, S. (2020). Analysis of the actions and motivations of a community during the 2017 torrential rains in northern Kyushu, Japan. International Journal of Environmental Research and Public Health, 17(7), 2424. https://doi.org/10.3390/ijerph17072424
- Peng, Q., Li, Z., & Gong, X. (2021). Exploring the effects of background image transparency on the usability of image maps. Transactions in GIS, 25(6), 3002–3024. https://doi.org/10.1111/tgis.12805
- Pratiwi, E. S., Sartohadi, J., & Wahyudi. (2019). Geoelectrical prediction for sliding plane layers of rotational landslide at the volcanic transitional landscapes in Indonesia. IOP Conference Series: Earth and Environmental Science, 286(1), 012028. https://doi.org/10.1088/1755-1315/286/1/012028
- Regolini-Bissig, G. (2010). Mapping geoheritage for interpretive purpose: Definition and interdisciplinary approach. Mapping Geoheritage, 35(35), 1–13.
- Rivera, F. I., & Kapucu, N. (2015). Disaster vulnerability, hazards and resilience: Perspectives from Florida. Disaster Vulnerability, Hazards and Resilience: Perspectives from Florida, 1–200. https://doi.org/10.1007/978-3-319-16453-3
- Roth, R. E. (2021). Cartographic design as visual storytelling: Synthesis and review of map-based narratives, genres, and tropes. The Cartographic Journal, 58(1), 83–114. https://doi.org/10.1080/00087041.2019.1633103
- Ruiz-Cortés, N. S., & Alcántara-Ayala, I. (2020). Landslide exposure awareness: A community-based approach towards the engagement of children. Landslides, 17(6), 1501–1514. https://doi.org/10.1007/s10346-020-01391-w
- Setiawan, H., Retnaningrum, E., Arrisaldi, T., & Wilopo, W. (2021). Capacity building and community preparedness towards landslide disaster in Pagerharjo village, Kulon Progo Regency of Yogyakarta, Indonesia. In F. Guzzetti, S. Mihalić Arbanas, P. Reichenbach, K. Sassa, P. T. Bobrowsky, & K. Takara (Eds.), Understanding and reducing landslide disaster risk, ICL contribution to landslide disaster risk reduction (pp. 603–610). Springer. https://doi.org/10.1007/978-3-030-60196-6_54
- Shinohara, Y., & Kume, T. (2022). Changes in the factors contributing to the reduction of landslide fatalities between 1945 and 2019 in Japan. Science of the Total Environment, 827, 154392. https://doi.org/10.1016/j.scitotenv.2022.154392
- Snyder, H. (2019). Literature review as a research methodology: An overview and guidelines. Journal of Business Research, 104(August), 333–339. https://doi.org/10.1016/j.jbusres.2019.07.039
- Song, J., Yamauchi, H., Oguchi, T., & Ogura, T. (2022). Application of web hazard maps to high school education for disaster risk reduction. International Journal of Disaster Risk Reduction, 72(February), 102866. https://doi.org/10.1016/j.ijdrr.2022.102866
- Sultana, N. (2020). Analysis of landslide-induced fatalities and injuries in Bangladesh: 2000-2018. Cogent Social Sciences, 6(1), 2000–2018. https://doi.org/10.1080/23311886.2020.1737402
- Tanner, J., & Hale, C. (2002). The workshop as an effective method of dissemination: The importance of the needs of the individual. Journal of Nursing Management, 10(1), 47–54. https://doi.org/10.1046/j.0966-0429.2001.00303.x
- Thanh, N. K., Miyagi, T., Isurugi, S., Van Tien, D., Luong, L. H., & Ha, D. N. (2021). Developing recognition and simple mapping by UAV/SfM for local resident in mountainous area in Vietnam—A case study in Po Xi Ngai community, Laocai Province. In F. Guzzetti, S. Mihalić Arbanas, P. Reichenbach, K. Sassa, P. T. Bobrowsky, & K. Takara (Eds.), Understanding and reducing landslide disaster risk. ICL contribution to landslide risk reduction (pp. 103–109). Springer. https://doi.org/10.1007/978-3-030-60227-7_10
- Thiery, Y., Terrier, M., Colas, B., Fressard, M., Maquaire, O., Grandjean, G., & Gourdier, S. (2020). Improvement of landslide hazard assessments for regulatory zoning in France: STATE–OF–THE-ART perspectives and considerations. International Journal of Disaster Risk Reduction, 47, 101562. https://doi.org/10.1016/j.ijdrr.2020.101562
- Tsai, Y. J., Syu, F. T., Shieh, C. L., Chung, C. R., Lin, S. S., & Yin, H. Y. (2021). Framework of emergency response system for potential large-scale landslide in Taiwan. Water, 13(5), 712. https://doi.org/10.3390/w13050712
- Tufano, R., Formetta, G., Calcaterra, D., & De Vita, P. (2021). Hydrological control of soil thickness spatial variability on the initiation of rainfall-induced shallow landslides using a three-dimensional model. Landslides, 18(10), 3367–3380. https://doi.org/10.1007/s10346-021-01681-x
- Tversky, B., Marrison, J. B., & Betrancourt, M. (2002). Animation: Can it facilitate? International Journal of Human-Computer Studies, 57(4), 247–262. https://doi.org/10.1006/ijhc.1017
- Tyner, J. A. (2014). Principles of map design. The Guilford Press.
- Van Kerkvoorde, M., Kellens, W., Verfaillie, E., & Ooms, K. (2018). Evaluation of web maps for the communication of flood risks to the public in Europe. International Journal of Cartography, 4(1), 49–64. https://doi.org/10.1080/23729333.2017.1371411
- Verbovšek, T., Popit, T., & Kokalj, Z. (2019). VAT method for visualization of mass movement features: An alternative to hillshaded DEM. Remote Sensing, 11(24), 2946. https://doi.org/10.3390/rs11242946
- Wadhawan, S. K., Singh, B., & Ramesh, M. V. (2020). Causative factors of landslides 2019: Case study in Malappuram and Wayanad districts of Kerala, India. Landslides, 17(11), 2689–2697. https://doi.org/10.1007/s10346-020-01520-5
- Wang, M., Liu, M., Yang, S., & Shi, P. (2014). Incorporating triggering and Environmental factors in the analysis of earthquake-induced landslide Hazards. International Journal of Disaster Risk Science, 5(2), 125–135. https://doi.org/10.1007/s13753-014-0020-7
- Wicks, D. (2017). The coding manual for qualitative researchers (3rd ed.). Qualitative Research in Organizations & Management: An International Journal, 12(2), 169–170. https://doi.org/10.1108/qrom-08-2016-1408
- Wu, B. S., Chuang, R. Y., Chen, Y. C., & Lin, Y. S. (2022). Characteristics of landslides triggered by the 2013 M L6.5 Nantou, Taiwan, earthquake. Earth, Planets and Space, 74(1). https://doi.org/10.1186/s40623-021-01560-8
- Yazdani, M., Mojtahedi, M., Loosemore, M., Sanderson, D., & Dixit, V. (2021). Hospital evacuation modelling: A critical literature review on current knowledge and research gaps. International Journal of Disaster Risk Reduction, 66(October), 102627. https://doi.org/10.1016/j.ijdrr.2021.102627