
ABSTRACT
Recently developed glacier forelands provide valuable insights into vegetation dynamics. We studied the vascular plants in the glacier forelands of the Ålmajallojekna glacier in comparison to the plants in the surrounding area. The glacier is retreating rapidly at an average rate of 0.17 km2 per year from 1898 to 2012. In the newly emerged glacier forelands, we found that 32 percent of the 381 plant taxa occurred in the surrounding region. Sixty-eight plant species were present on the youngest terrain (0–31 y), an additional thirteen species occurred on terrain aged 32–53 years, and an additional forty-two species were detected on terrain aged 54–114 years. Of the surrounding species pool, plant species that had successfully established in recently deglaciated terrains were characterized by high regional abundance and low seed weight, and they were more likely to be members of the plant families Saxifragaceae, Salicaceae, and Asteraceae. Woody plant species with a preference for well-drained soils were more likely to be present in the youngest terrain. Our results show that the vegetation of glacier forelands is developing rapidly depending on the plant species in the surrounding area and the species’ life-history traits.
Introduction
Climate change is especially pronounced in the Arctic, where temperatures have increased from two to three times more than the global average during the past fifty years (Post et al. Citation2009; Pachauri and Meyer Citation2014). This coincides both with widespread vegetation shifts (Kullman Citation2004; de Vernal and Hillaire-Marcel Citation2008; Kullman and Öberg Citation2009), decreasing the extent and thickness of glaciers (Hodkinson et al. Citation1998), and with the exposure of new glacier forelands. For decades, recently deglaciated lands have provided excellent opportunities to study the development of emerging ecosystems, to understand the mechanisms of primary succession, and to disentangle the role of species characteristics in colonization ability (Matthews Citation1992; Chapin et al. Citation1994; Stöcklin and Bäumler Citation1996; Rydgren et al. Citation2014; Klaar et al. Citation2015).
With an increasing area of new glacier forelands forming as the climate continues to change, thorough knowledge of the drivers of vegetation development can inform us about the susceptibility of species to climate change and about the importance of emerging habitats in mitigating the loss of habitats in arctic areas (Callaghan et al. Citation2013; Egerton Citation2015). Plants are colonizing glacier forelands relatively fast, with species composition changing rapidly from predominantly moss-dominated early vegetation to evergreen dwarf shrub-moss tundra (Jones and Henry Citation2003). Post-glacial plant colonizations have been studied intensively because they are suitable areas for studies of chronosequences where space is substituted for time in determining the sequences of the succession of plants, nutrients, and soil development (Crocker and Dickson Citation1957; Lawrence et al. Citation1967; Hobbie, Macko, and Shugart Citation1998). Several studies have been provided as textbook examples of primary succession on glacial till following ice retreat (Cooper Citation1939; Begon Citation2005).
Species composition in successional habitats often reflects that of surrounding habitats and nearby seed sources (Campbell, Rochefort, and Lavoie Citation2003; Kullman Citation2010). The ability of species from the surrounding landscape to disperse and establish in emerging habitats is related to their dispersal and persistence ability. Life-history traits such as height, seed weight, and seed number can be linked to the ability to colonize new habitats, and have often been used as a proxy for both dispersal and establishment success (Grime Citation1974; Moles and Westoby Citation2006; Thomson et al. Citation2011). Pioneer plant species are often efficient in terms of both dispersal and establishment success (Chapin, Autumn, and Pugnaire Citation1993; Pywell et al. Citation2003; Meiners et al. Citation2015), have rapid reproduction strategies (Elven Citation1980), and belong to opportunistic taxonomic families with corresponding life forms (McIntyre, Lavorel, and Tremont Citation1995; Alsos et al. Citation2007).
We explored how vegetation has developed in the glacier forelands in one of Europe’s most remote areas, examining a period covering 114 years. We were interested in whether plant occurrences in new terrain are related to species traits. By combining unique information about the current plant species occurring in the glacier forelands and the historical distribution of plant species in the region we tested whether species life-history traits, abundance, and distribution explain why certain species occur in the new terrain. We also explore glacier retreat in the study area and discuss the potential influence of temperature on glacier retreat and plant occurrences.
Material and methods
Study area
The study was conducted in the northwestern part of Swedish Lapland. Here, Sten Selander extensively studied the flora from 1941 to 1946 and published a plant atlas describing the distribution of each plant species in the region, covering 4,013 km2 (Selander Citation1950). Selander subdivided the area into eight districts (), and mapped plant occurrences and abundancies in each district. Most of Selander’s districts are within the UNESCO World Heritage site Laponia, and cover large parts of the national parks Padjelanta and Sarek. The atlas published by Selander is the only detailed vegetation survey available for the study region, and lists 381 plant taxa. Selander was very interested in plant succession patterns and studied the area surrounding the glaciers extensively, including the nunataks inside the glacier Ålmajallojekna.
Figure 1. (a) Location of the study area in northern Scandinavia. (b) Location of the eight districts surveyed by Selander (Citation1950) and the Ålmajallojekna glacier (located south of the label VII). Dark green areas indicate spruce forests, light green indicates birch forests, grey indicates the area above the tree limit, blue indicates lakes.
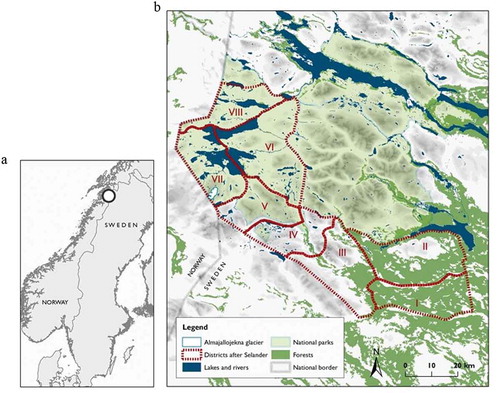
We studied the glacier forelands around what used to be the largest glacier in Sweden, the Ålmajallojekna glacier (N67°16ʹ25, E16°22ʹ45), which is located within Selander’s study area. The Ålmajallojekna glacier is on the border between Sweden and Norway in the northern part of the Scandes (Scandinavian mountain range) in Padjelanta National Park (). There are no roads and no permanent human inhabitants in the area and the closest village, Kvikkjokk, is situated 70 km away in a straight-line east of the glacier. The Ålmajallojekna glacier and its forelands nestle in a typical alpine landscape dominated by rocks and mountain heathlands, stretching from 950 m a.s.l. to 1,300 m a.s.l. From the Ålmajallojekna glacier, the closest fjord in Norway is only 35 km away and relatively warm and moist winds from Norway reach the site. The growing season is limited to the period from mid-June to the end of August and is characterized by high precipitation, amounting to about 1,500 mm per year (von Sydow Citation1983). There is no meteorological station available within 50 km from the study area. Occasionally, large areas are still covered by snow in July, as happened in 2012. The presence of Cambro Silurian bedrock containing calcareous phyllites and limestone has led to the development of a species-rich and specially adapted flora (Figure S1), with some species solely restricted to this region in Scandinavia (von Sydow Citation1983).
Characteristics of the Ålmajallojekna glacier and survey of its retreat
Ålmajallojekna glacier has a southeast-facing slope, with multiple ridges and swales ().Westman (Citation1899) was the first person to study the Ålmajallojekna glacier thoroughly, mapping its spatial extent and establishing reference cairns that are still present. In 1898, the glacier covered an area of about 22 km2; since then, it has continuously retreated to an area of 2.8 km2 in 2013 (). Because of this glacial retreat, new terrain with rivers, lakes, and rocks have been exposed in the formerly glaciated area.
Figure 2. (a) The extent of the Ålmajallojekna glacier in 1898 (dark green), 1958 (green), 1980 (light green), and 2012 (white), as well as the twelve transects used for the plant survey undertaken during this study. The red crosses show the positions of the two temperature loggers. (b) Photo point XII in Westman (Citation1899) showing the eastern parts of Ålmajallojekna. The photographs were taken July 30, 1898 (left), and September 5, 2013 (right). (c) Photo point from Selander (Citation1950) (seen from Mt. Kasakpuolta) photographed July 26, 1946 (left), and September 5, 2013 (right). Selander (Citation1950) described the area in the photo as “Recently formed nunatak” (i.e., area completely devoid of phanerogam vegetation) and on the bare gravel in the foreground he found no phanerogam vegetation other than Saxifraga rivularis. Photos from 2013: Markus Franzén.
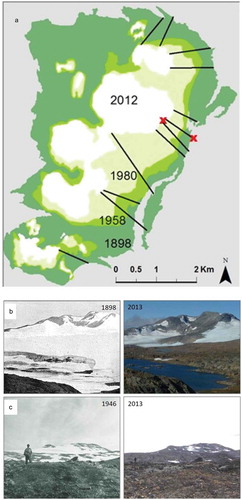
We measured the glacial retreat by analyzing maps from 1898 (Westman Citation1899), aerial photographs from both 1957–1958 and 1980, SPOT-5 satellite images from 2012, as well as data from our field visits from 2011 to 2013. For each year, glacier cover was based on information from July to September when the glacier was fully exposed. Based on the extent of the glacier, we classified the glacier foreland into three age classes: areas that had been deglaciated for 0–31 years, 32–53 years, and 54–114 years. The age classes were defined based on the years from which maps, aerial photographs, and satellite images were available and in which the extent of the glacier could be clearly defined. No information about the thickness of the glacier is available.
Plant survey in the glacial forelands
From the plant studies in the 1940s Selander gives detailed information about plants that occur in new terrain in a paragraph titled “The vegetation on ‘new soil’” (Selander Citation1950, 122–27). He also stated that he investigated the area surrounding Ålmallojekna glacier, and Saxifraga rivularis was the only vascular plant species present on the new terrain (that had been free from ice for approximately 50 years). Further, in the legend to a photograph (see ) Selander wrote: “Recently formed ‘nunatakk’ on the glacier of Ålmallojekna, seen from Mt Kasakpuolta. On the raw gravel in the foreground no phanerogam vegetation but Saxifraga rivularis was found. The ‘nunataks’ were completely devoid of phanerogam vegetation.” The few plant individuals that occurred in the glacier forelands at this time might reflect that the terrain was young, the large glacier was cooling the area, and previous years from 1943 to 1946 had been cold with large snowfields covering the area even during the summers ().
Our fieldwork was carried out from July 20 to August 3, 2011, and from August 3 to August 17, 2012. We established twelve transects (six were surveyed in 2011 and six in 2012) in the glacier foreland, stretching from the present glacier edge to where the edge was in 1898 (Table S4; Westman Citation1899). The transects had a total length of 11,185 m (average 1,016 m, ranging from 634 m to 1,828 m; ). The altitude along the transects ranged between 1,020 m a.s.l. and 1,200 m a.s.l. The youngest terrain that each plant taxon occupied was determined by recording the closest occurrence to the glacier edge along each transect (Table S4). We recorded the first time each plant taxon occurred in a fixed-width band of 1 m along each transect. To estimate the relative frequency of each taxon, we also identified all plant taxa in 1,507 plots of 50 cm × 50 cm that were placed approximately every 50 m (on neutral-aspect ground) along each transect. To obtain a complete picture of the plants occupying the former glacier-covered area, as well as the age of the terrain that they had occupied, we also recorded plant taxa (with the exact coordinates) that had not been observed along any transects while walking in the glacier foreland (for about 25 h each year). Most taxa were recorded along the transects and only seven additional taxa (of 123) were recorded during the random walks. We focused the plant survey on the western part of the former glacier because this area is easiest to access and has no great altitudinal differences. Two hybrid taxa were recorded: Betula nana x pubescens and Carex capitata x arctogena. Some individuals were impossible to identify to species level, especially among Salix spp. and Poa spp. Hybrids and individuals that were not identified to species level were deliberately excluded from the analyses. Draba oxycarpa was only recently split from Draba alpina and the two species were merged in the statistical trait analyses in line with the older data (Selander Citation1950). A few plant individuals could only be identified to genus level and these were attributed to the most common taxa in the genus that was found in the deglaciated area. We applied a chronosequence approach, and all plant occurrences were cross-referenced to the age of the terrain. Each occurrence was attributed to one of the three age classes based on where they occurred in the former glaciated area: 0–31, 32–53, and 54–114 years. Based on the extent of the glacier in 1898, 1957, 1980, and 2012, as well as the plant-species distribution in the glacier forelands in 1946 (Selander Citation1950) and 2011–2012, we explore the plant-species richness at each age class. In addition, we give broad estimates of the successful colonization rate by linking the plant richness and the age of the terrain for five time periods (1898–1946, 1898–2012, 1946–2012, 1957–2012, and 1980–2012).
Information about plant-species characteristics
All 381 plant species found by Selander (Citation1950) were treated as our species pool, consisting of species that could potentially occur in the deglaciated Ålmajallojekna area (Table S5). For each species in the species pool, we extracted information for eight different species-related variables as follows: from Selander (Citation1950) we obtained data on (1) local abundance, (2) distribution area in the eight districts, and (3) distance to the nearest district in which the species was recorded (). Species local abundance represents the number of single plant occurrences in Selander (Citation1950) and ranges from one to forty, where ubiquitous species were allocated the maximum number of occurrences recorded for any single species (40). Distribution area was defined as the number of occupied districts. For each plant species found during our study in the glacial foreland, we estimated the distance between the nearest district that it occupied in 1950 and the glacier edge in 1898. These distances ranged from 0 km to 67 km, where the Ålmajallojekna glacier district was allocated a distance value of zero ().
For each of the 381 species we also collated information about species taxonomy at the family level (4), habitat preferences (5), life form (6), pollen vector (7), and seed weight (8). Species habitat preferences (soil moisture [F], soil nitrogen [N], and soil reaction [R]) were obtained using Ellenberg indicator values for the Faroe Islands (Lawesson, Fosaa, and Olsen Citation2003). The Faroe Islands are environmentally similar to the study area and represent the only colder region for which Ellenberg values have been calibrated (cf. Hedwall, Brunet, and Diekmann Citation2019). When information was missing for some species in Lawesson, Fosaa, and Olsen (Citation2003), original Ellenberg values were used as described in Ellenberg et al. (Citation1992), and when still missing, values from Hill (Citation1999) were used. Life-form classifications were adapted from Ellenberg and Mueller-Dombois (Citation1967) and Raunkiaer (Citation1934), and included the following: phanerophytes (self-supporting woody perennials that grow taller than 25–50 cm), chamaephytes (self-supporting woody plants whose mature branch or shoot system remains perennially within 25–50 cm above the ground surface), hemicryptophytes (self-supporting perennial [including biennial] herbaceous plants with periodic shoot reduction to a remnant shoot system that lies relatively flat on the ground surface), geophytes (self-supporting perennial and biennial herbaceous plants with periodic reduction of the complete shoot system to storage organs that are buried in the soil), hydrophytes (free-moving water plants and partly submerged, amphibious plants), and therophytes (self-supporting annual plants whose shoot and root system dies after seed production and which complete their entire life cycle within one year). The pollen vector for each plant species was catagorized as follows: (1) predominantly insect pollinated, (2) predominantly selfing, (3) predominantly wind pollinated, or (4) no pollen (e.g., ferns). Seed and spore weight were classified into three weight classes: (1) spores and small seeds (<0.5 mg), (2) intermediate-sized seeds (0.5 ≤ 1.0 mg), and (3) large seeds (>1.0 mg). In our analysis height was captured by the trait “life form” and we considered height to be a less reliable trait because most plants did not grow to their full height in our study area.
Species information was extracted from the following individual studies: Grime, Hodgson, and Hunt (Citation1988); Ellenberg et al. (Citation1992); Hill (Citation1999); Lawesson, Fosaa, and Olsen (Citation2003); Molau, Nordenhall, and Eriksen (Citation2005); and Welling, Tolvanen, and Laine (Citation2005), as well as from the databases LEDA (Kleyer et al. Citation2008), BiolFlor (Klotz, Kühn, and Durka Citation2002), The Seed Information Database (Royal Botanic Gardens Citation2019, data.kew.org/sid/), Flora of Svalbard (svalbardflora.no/), FloraWeb (www.floraweb.de/index.html), Flora of the Canadian Arctic Archipelago (Aiken et al. Citation2007), The PLANTS Database (plants.usda.gov), Interactive Flora of NW Europe (wbd.etibioinformatics.nl/bis/flora.php?menuentry=inleiding), and the Online Atlas of the British and Irish flora (https://www.brc.ac.uk/plantatlas/index.php?q=title_page). All online resources were accessed April 15, 2016. The taxonomy follows The Plant List 2017 (www.theplantlist.org).
Temperature data
To monitor the temperature range in the recently established terrain available for plant colonization we collected daily temperature data using iButton dataloggers (model DS1922L; accurate to 0.4°C): one logger was placed at the site of the glacier edge in 1898 and one at the glacier edge in 2011 (). The loggers were fixed at a height of 120 cm on poles in radiation shade and they recorded the temperature each hour from July 2011 to July 2012 as described in Franzén and Dieker (Citation2014). The dataloggers provide a temperature gradient across the foreland unrelated to change over time.
Figure 3. (a) Annual mean temperature from the temperature logger placed at the location of the 1898 glacier edge (−0.35°C) and at the glacier edge in 2011 (−1.31°C), indicating a temperature increase of 0.008°C per year (upper line). The mean annual temperature of the entire glacier area is based on extrapolated temperature data on grids for the six periods 1898–1958 (slope = 0.0019), 1898–1980 (slope = 0.0071), 1898–2012 (slope = 0.0107), 1958–1980 (slope = 0.0212), 1958–2012 (slope = 0.0203), and 1980–2012 (slope = 0.0197) (lower lines). The colder temperature from the yearly data according to the grids is because the grid extends across the entire glacier area, which is mainly covered by ice and includes higher altitudes. (b) Temperature anomalies calculated for each decade from 1900 to 2015 (1900 is based on extrapolated yearly mean temperature data covering the entire glacier area from 1900 to 1909, 1910 is based on data from 1910 to 1919, and so on).
We also extracted yearly temperature data from a grid with a resolution of 10ʹ latitude times 10ʹ longitude that intersected the former glacier area in 1898. These data were extracted from Mitchell et al. (Citation2004) for the period 1900–2000 and from GISTEMP-Team (Citation2016) for the period 2001–2012 and were used to calculate the yearly change in temperature among the time periods 1898–1957, 1898–1980, 1898–2012, 1957–1980, 1957–2012, and 1980–2012. In addition, temperature anomalies were calculated for each decade. These were based on the difference from the average temperature for the entire area that the glacier covered from 1900 to 2013.
Statistical analyses
To analyze variables potentially associated with the vascular plant colonization of glacier forelands, we carried out the following analyses: (1) We performed a hierarchical cluster analysis of the seven continuous variables based on the complete linkage method (Dormann et al. Citation2012) to avoid further problems potentially arising from collinear variables when including the variables in general linear modeling (Figure S2). The hierarchical cluster analysis revealed a strong correlation among abundance, distribution, and the distance from the glacier (Figure S2). Thus, we could not separate effects from these three variables and, therefore, only included abundance (which is the most ecologically relevant trait [Brown Citation1984] in the statistical analyses). (2) We performed logistic regressions with binomial error distribution and the log link function, using species presence/absence in the glacier foreland as response variables and the six uncorrelated species traits as predictor variables. The combined information from the surrounding species pool in the 1940s (Selander Citation1950) and the species present in the formerly glaciated area recorded in 2011–2012 were used to classify the species as either present or not in the glacier foreland. The final model with the lowest AIC value (Burnham and Anderson Citation2002) was selected. (3) We explored whether any species traits were related to the age of the terrain that has been exposed since 1898 using plant occurrences only within the former glacier area. As response variables in the models, we assigned each species present in the glacier foreland to the youngest of the three age classes in which a given species was found: 0–31, 32–53, and 54–114 years. The six remaining species traits were included as predictor variables. Model selection was conducted as described previously. (4) We explored the relationship between the analyzed trait states across the species using correspondence analysis (CA) in which all noncontinuous trait states were dummy coded (Figure S3). This was investigated because some states of different characteristics might be linked, and the hierarchical cluster analysis (see previously) can only handle continuous variables. Species with missing trait data were excluded from the statistical analyses (n = 128, Table S5). All models were developed using the R software version 3.3.2 (R Development Core Team Citation2016) and the multivariate CA was performed in Canoco version 4.5.
Results
The Ålmajallojekna glacier has been retreating at an average rate of 0.17 km2 per year from 1898 to 2012 (). The mean temperature increased during the study periods, with the increase ranging from 0.0012°C per year (1898–1946) to 0.021°C per year (1958–1980; ). Temperature anomalies calculated for each decade (based on daily average temperatures from 1900 to 2015) also showed that the temperature had increased every decade since 1960, ranging from 0.11°C in the 1960s to 1.12°C in the 2000s (). The annual mean temperature measured from 2011 to 2012 varied between −0.35°C at the 1898 glacier edge and −1.31°C at the 2011 glacier edge ().
Figure 4. Plant-species richness at the different age classes of the deglaciated terrain among the time periods 1898–1946 (slope = 0.04), 1898–2012 (slope = 1.04), 1958–2012 (slope = 1.64), and 1980–2012 (slope = 2.34). The year 1946 represents the date Selander (Citation1950) visited the glacier area and found only one plant species in the recently deglaciated terrain.
Of the 381 vascular plant taxa in the surrounding species pool, 123 were present on the glacier forelands that have been deglaciated since 1898 (Table S5). Sixty-eight plant species were present on the youngest terrain (0–31 years), an additional thirteen species occurred on terrain aged 32–53 years, and forty-two additional species occurred only on the terrain aged 54–114 years. All the plant species that were present in the youngest terrain were also found in the oldest terrain. We obtained estimates of the rate of the number of plant species establishing in the deglaciated areas by linking the number of species with the age of the deglaciated terrain on which they occurred. The youngest terrains have obtained species at a rate of approximately 2.34 taxa per year from 1980 to 2012, while the oldest deglaciated terrains have gained species at a rate of approximately 1.04 taxa per year between 1898 and 2012 (). Twenty-nine species were only recorded once and seven species only outside of the transects. Of the 123 species present in the glacier foreland most species were locally abundant and ninety species were classified as very abundant by Selander (Citation1950) in the glacier’s surroundings. In the recently exposed glacier forelands Poa alpina was the most abundant species, followed by Salix herbacea and Saxifraga oppositifolia (Figure S1), all of which were present in more than 20 percent of the 1,507 plots.
Plant-species characteristics
To determine whether species characteristics were influencing the ability to occupy the glacier forelands, we included the six uncorrelated trait variables in the same general linear model. The best-fitting model revealed that local abundance (positively), seed weight (negatively), and taxonomic family were the most important traits influencing the species’ ability to occur in the glacier forelands (). The proportion of species occupying the new terrain was higher among species within the families Saxifragaceae, Salicaceae, and Asteraceae compared with Cyperaceae, Poaceae, Orchidaceae, and Rosaceae. Plant occurrences within the area that had been deglaciated since 1898 were associated with two life-history traits: life form and the preference for soil moisture. Chamaephytes and species preferring well-drained and drier conditions were more frequent at the youngest terrain ().
Table 1. The final best-fitting generalized linear model (lowest AIC) for the relationship between plants occurring on the recently established terrain or only outside (in the species pool) and the traits abundance, seed weight, and taxonomic family. For differences between each family, see Figure S6: df = 252, N = 264, R2 = 0.45; AIC = 204.5.
Table 2. Results from the best-fitting model analyzing the plants that only occur inside the recently deglaciated terrain and whether traits determine the ability to occupy younger terrain. Soil moisture and life form were linked to the ability to occupy younger terrain: df = 74, N = 78, R2 = 0.12; AIC = 201.1.
Discussion
Of the 381 plant species occurring in the surrounding region, 123 were present in the recently deglaciated terrain. The glacier foreland has rapidly been colonized by species with certain characteristics at a recent rate of more than two species per year. In our analysis, the occurrence patterns of plants in the glacier foreland were associated with several species characteristics. Important variables in determining occupancy patterns were species local abundance, seed weight, and taxonomic family, indicating the importance of dispersal-related factors to reach new terrain. Within the former glacier area, life form and habitat preference were linked to species’ ability to establish on young terrains, indicating that characteristics related to plant establishment are important when determining persistence in a new environment following arrival (see also Rydgren et al. Citation2014).
Dispersal-related factors and regional abundance: Key traits for successful establishment in the glacier foreland
We found evidence for a strong selection toward dispersal-related characteristics, and large impact of the abundance on the species occurring in glacier forelands. Establishment success was high among the species from the surrounding species pool that had high local abundance, low seed weight, and were members of certain taxonomic families, demonstrating the importance of propagule pressure (seed availability) in the successful colonization of new terrains (Chapin et al. Citation1994; Ehrlén and Eriksson Citation2000; Moles and Westoby Citation2002; Martin and Wilsey Citation2006). Abundance was correlated with range size and the distance to the nearest population from the glacier edge and we conclude that each of these traits represents a different measure of rarity—measures that are often very strongly correlated (Figure S2; Gaston Citation1993; Violle et al. Citation2017). Rare, range-restricted species, or species with small population sizes, are more often absent from new terrain because of a reduced ability to colonize otherwise suitable areas (Gardner and Engelhardt Citation2008). Thus, the number of diaspores arriving can be more important in shaping the glacier foreland species composition than specialized adaptations for tolerating stressful environmental conditions. Propagules of more abundant species and of those occurring closer to the glacier foreland have a higher probability of reaching newly available sites (Brown and Kodric-Brown Citation1977). The significance of propagule pressure in determining the species composition of glacier forelands has previously been emphasized in other studies (Stöcklin and Bäumler Citation1996; Erschbamer, Niederfriniger Schlag, and Winkler Citation2008; Erschbamer and Mayer Citation2011). The importance of propagule availability and dispersal-related factors were likewise manifested in the results found for species life-history traits. We found that heavier seeded species are less likely to occur in the glacier foreland compared to their presence in the surrounding species pool (). Although larger seed weight would enable species to establish more easily (because they have more resources available; Moles and Westoby Citation2002), their dispersal ability is reduced and thus they are less likely to reach new habitats than species with smaller seeds (Campbell, Rochefort, and Lavoie Citation2003; Moles and Westoby Citation2006). There might also be a trade-off between seed weight and species survival ability—species with small seeds are more likely to colonize new terrain, but can fail to establish and persist because of low tolerance of harsher environmental conditions (Wood and Del Moral Citation1987; Moles and Westoby Citation2004). We found no strong indication that different trait states are closely correlated, even if some variables are linked, such as Saxifragaceae having a relatively higher local abundance compared to other families (Figure S3).
Predicted probabilities of colonizing the glacier foreland differed between families and were highest for species within Saxifragaceae, followed by Salicaceae and Asteraceae (Figure S6). Species within these families are characterized by good dispersal ability, mostly having wind-dispersed, light seeds that allow rapid colonization of recently deglaciated terrain. Species within Poaceae had a low probability of occurrence in the glacier forelands even if the most abundant species in the glacier foreland were Poa alpina, followed by Salix herbacea and Saxifraga oppositifolia. These represent species that are very common in arctic communities, with strong adaptations to cold environmental conditions and an ability to occupy recently deglaciated terrain (Alsos et al. Citation2007; Robbins and Matthews Citation2009; Muller et al. Citation2012). For example, the prostrate forms of S. oppositifolia have a high capacity for rhizogenesis and can spread vegetatively by shoot fragments—a characteristic that, in addition to good dispersal ability, can be very helpful in harsh environments, facilitating an increase in cover following initial establishment (Kume et al. Citation1999).
Some plant families, such as Rosacea and Orchidaceae, however, were underrepresented or not present at all in the glacier foreland, despite being present in the surrounding landscape. For Rosaceae, this is probably because of dispersal limitations (e.g., often having large and fleshy fruits), because only the species with high local abundance (Alchemilla wichurae, Dryas octopetala, Potentilla crantzii, and Sibbaldia procumbens) were present in the glacier foreland, whereas all other species were found at very low abundances or were absent from deglaciated terrain (see Table S5). For Orchidaceae, establishment limitation is likely, because even orchid species that were locally abundant (such as Chamorchis alpina, Dactylorhiza viridis, and Pseudorchis albida) did not occur on the glacier foreland. Orchid seeds are very small, contain almost no resources, and have to rely on external sources via mycorrhizal fungi for resource acquisition (Eriksson and Kainulainen Citation2011). The development of a mycorrhizal community requires many years and depends on vegetative history to build up sufficient soil organic matter (Cazares, Trappe, and Jumpponen Citation2005; McCormick et al. Citation2012).
While dispersal limitation was shown to be an important factor to reach the recently deglaciated terrain, we detected possible establishment limitation within the terrain that has been exposed since 1898. Species that prefer moister conditions were less successful in their establishment within the glacier foreland than species that prefer drier conditions. This indicates that early successional species may act as nursing plants, facilitating the colonization of later-successional species by adding organic matter to the soil, which increases the availability of both soil moisture and nitrogen (Erschbamer, Niederfriniger Schlag, and Winkler Citation2008; Anthelme, Cavieres, and Dangles Citation2014). Chamaephytes were more successful compared with hemicryptophytic forms in colonizing the youngest terrain of the glacier foreland that had been exposed since 1898 (). Chamaephytes are woody or semi-woody plants (dwarf shrubs) that have overwintering buds close to the ground (Raunkiaer Citation1934). With adaptations to arctic and alpine conditions, chamaephytes can tolerate various stresses (Illa, Carrillo, and Ninot Citation2006). In the study area plants might be particularly stressed from the cold winds from the glacier and dramatic shifts in temperature and precipitation. Previously, while observing colonization patterns in younger glacier forelands, a number of studies reported considerable establishment limitation in addition to dispersal limitation (Matthews Citation1992; Jones and Del Moral Citation2009). Extreme environmental conditions associated with young terrains, especially drought and soil infertility, have been shown to be unsuitable for species establishment, even when propagules have reached a site (Jumpponen et al. Citation1999).
Some studies have recognized that abiotic and biotic factors do not have separable effects on species and their interactions (Kraft et al. Citation2015; Cadotte and Tucker Citation2017). While experiments can distinguish mechanisms, observational patterns might be especially problematic. We found abundance, seed weight, and plant family to be associated with establishment success, which may hint that these traits are important drivers of establishing species in new terrain. These traits are also associated with early successional species. When the analyses were limited to the terrain that became available since 1898, the trait indicating soil moisture preferences and life forms was associated with colonization patterns, and this might suggest that biotic factors such as competition might also be important. Highly competitive species might even outcompete other species in new terrain (Mori et al. Citation2008), but our vegetation plots were not totally covered by plants in any case (Figure S7). Possibly other factors such as disturbances and interspecific competition might covary with temperature. We think, however, that competition is not a crucial factor in the study areas, because plant cover is very low in most parts of the former glaciated area (Figure S7). Additionally, all of the plant species that were present in the youngest terrain were also found in the oldest terrain, indicating that competition is not a dominant driver of succession in the studied glacier forelands. Abiotic and biotic drivers often covary, and this became even more evident in studies that used a chronosequence approach (Johnson and Miyanishi Citation2008). Indeed, the validity of successional patterns along chronosequences has been criticized (Johnson and Miyanishi Citation2008; Buma et al. Citation2017). However, the approach provides an opportunity to study the development of communities on new terrain without relying on the very few rare long-term studies that are available (Buma et al. Citation2017). Data gathered along a chronosequence should be interpreted with care, but they contribute important new information about how emerging terrain and communities develop. To disentangle the relative importance of biotic and abiotic factors on colonization processes a combination of methods is desired (Crocker and Dickson Citation1957; Lawrence et al. Citation1967).
Plant occurrences in relation to temperature increases
We found that species richness increased with more than two species per year in the youngest terrain. Similar increases have been found in other glacier forelands (Kaufmann Citation2002; Buma et al. Citation2017). Our results indicate that the successful colonization rates might differ between periods. Selander visited the recently deglaciated terrain surrounding Ålmajallojekna in July 1946 and found only one vascular plant species. The slow colonization rate from 1898 to 1946, according to field observations, is probably because of the limited temperature increase during the period 1898–1946 (only 0.0012°C yearly increase), which could potentially have prevented plants from colonizing the young terrain. In recent decades, temperatures have considerably increased in our study area, potentially benefitting plant colonizations by influencing the length of the growing season (). Most of the plant colonizations in the glacier studied have occurred since 1946, and cold periods before 1946 likely hampered earlier plant colonizations. Additionally, the cooling effect of the remaining ice would have been stronger in 1946 compared to 2011–2012. Precipitation might also be an important factor but we could not see any clear pattern in changes of precipitation, including changes in the proportion of rain and snow over time in the study area. However, it is also important to stress that we did not carry out repeated observations between 1946 and the present; thus, our analysis might miss the species that had colonized the area but went extinct before the survey for this study was carried out in 2012.
During the entire study period of 1898–2012 the temperature increased by 0.01°C per year according to the yearly interpolated temperature grid data, and was surprisingly similar to the temperature differences recorded by the temperature loggers at the location of the glacier edge in 1898 and the glacier edge in 2011, which revealed a difference of 0.96°C (0.008°C per year). Indeed, temperature loggers support the usefulness of the grid data even in topographically highly variable terrains because the temperature difference measured between the loggers was very similar to the temperature change measured over time based on the yearly temperature grid data (0.008°C vs. 0.01°C). We are aware that these results might only be a coincidence and deserve further studies.
Conclusions
Our results show that even after a century of succession, dispersal limitation and, to a lesser extent, establishment limitation still determine the composition of the glacier foreland community. We found that many plant species occupy recently exposed ground. This is probably an effect of rising temperatures in the study area together with developing soils and species-rich vegetation in the surrounding area. Clearly, certain species-specific traits determine whether a plant species will occur on recently exposed terrain. First, dispersal-related characteristics, such as abundance, seed weight, and also taxonomic family, determine whether a species will reach the glacier foreland. Second, characters related to establishment, such as preference for soil moisture and life form, determine where a plant will establish or grow depending on the age of the terrain. Because the decline of the Ålmajallojekna glacier and the observed occurrences of plant species might be representative of numerous glaciers in the Arctic, we assume that under ongoing warming climate conditions, the alpine belt will currently expand its range and the Arctic will subsequently become greener. Therefore, it is important to monitor and study changes in remote areas that traditionally receive little attention.
Supplemental Material
Download Zip (995 KB)Acknowledgments
We thank Formas (2018-02846), Olle Engkvist Byggmästare, and Birgit och Hellmuth Hertz Foundations for economic support; the provincial government in Norrbotten for permits and Robert Franzén for help with the fieldwork. Anna Knöppel and Johannes Wahl helped in the field and gave valuable comments on previous versions of the manuscript. AH was supported by the Estonian Ministry of Education and Research (IUT20-29), and by the European Union through the European Regional Development Fund (Centre of Excellence EcolChange).
Disclosure statement
No potential conflict of interest was reported by the authors.
Supplemental material
Supplemental data for this article can be accessed on the publisher’s website.
Additional information
Funding
Related Research Data
References
- Aiken, S. G., M. J. Dallwitz, L. L. Consaul, C. L. McJannet, R. L. Boles, G. W. Argus, J. M. Gillett, P. J. Scott, R. Elven, M. C. LeBlanc, et al. 2007. Flora of the Canadian Arctic Archipelago: Descriptions, illustrations, identification, and information retrieval. Ottawa: NRC Research Press, National Research Council of Canada. Accessed 1 September 2016. http://nature.ca/aaflora/data.
- Alsos, I. G., P. B. Eidesen, D. Ehrich, I. Skrede, K. Westergaard, G. H. Jacobsen, J. Y. Landvik, P. Taberlet, and C. Brochmann. 2007. Frequent long-distance plant colonization in the changing Arctic. Science 316 (5831):1606–09. doi:10.1126/science.1139178.
- Anthelme, F., L. A. Cavieres, and O. Dangles. 2014. Facilitation among plants in alpine environments in the face of climate change. Frontiers in Plant Science 5:387. doi:10.3389/fpls.2014.00387.
- Begon, M. 2005. Ecology: From Individuals to Ecosystems. Oxford: Blackwell Science.
- Brown, J. H. 1984. On the relationship between abundance and distribution of species. American Naturalist 124 (2):255–79.
- Brown, J. H., and A. Kodric-Brown. 1977. Turnover rates in insular biogeography: Effect of immigration on extinction. Ecology 58 (2):445–49.
- Buma, B., S. Bisbing, J. Krapek, and G. Wright. 2017. A foundation of ecology rediscovered: 100 years of succession on the William S. Cooper plots in Glacier Bay, Alaska. Ecology 98 (6):1513–23. doi:10.1002/ecy.1848.
- Burnham, K. P., and D. R. Anderson. 2002. Model selection and multimodel inference: A practical information-theoreticapproach, 1–488. New York: Springer.
- Cadotte, M. W., and C. M. Tucker. 2017. Should environmental filtering be abandoned? Trends in Ecology & Evolution 32 (6):429–37. doi:10.1016/j.tree.2017.03.004.
- Callaghan, T. V., C. Jonasson, T. Thierfelder, Z. Yang, H. Hedenås, M. Johansson, U. Molau, R. Van Bogaert, A. Michelsen, J. Olofsson, et al. 2013. Ecosystem change and stability over multiple decades in the Swedish subarctic: Complex processes and multiple drivers. Philosophical Transactions of the Royal Society B: Biological Sciences 368:1624. doi:10.1098/rstb.2012.0488.
- Campbell, D. R., L. Rochefort, and C. Lavoie. 2003. Determining the immigration potential of plants colonizing disturbed environments: The case of milled peatlands in Quebec. Journal of Applied Ecology 40 (1):78–91. doi:10.1046/j.1365-2664.2003.00782.x.
- Cazares, E., J. M. Trappe, and A. Jumpponen. 2005. Mycorrhiza-plant colonization patterns on a subalpine glacier forefront as a model system of primary succession. Mycorrhiza 15 (6):405–16. doi:10.1007/s00572-004-0342-1.
- Chapin, F. S. I., K. Autumn, and F. Pugnaire. 1993. Evolution of suites of traits in response to environmental stress. American Naturalist 142 (SUPPL.):S78–S92. doi:10.1086/285524.
- Chapin, F. S. I., L. R. Walker, C. L. Fastie, and L. C. Sharman. 1994. Mechanisms of primary succession following deglaciation at Glacier Bay, Alaska. Ecological Monographs 64 (2):149–75. doi:10.2307/2937039.
- Cooper, W. S. 1939. A fourth expedition to Glacier Bay, Alaska. Ecology 20 (2):130–55. doi:10.2307/1930735.
- Crocker, R. L., and B. A. Dickson. 1957. Soil development on the recessional moraines of the Herbert and Mendenhall Glaciers, south-eastern Alaska. Journal of Ecology 45 (1):169–85. doi:10.2307/2257083.
- de Vernal, A., and C. Hillaire-Marcel. 2008. Natural variability of Greenland climate, vegetation, and ice volume during the past million years. Science 320 (5883):1622–25. doi:10.1126/science.1153929.
- Dormann, C. F., J. Elith, S. Bacher, C. Buchmann, G. Carl, G. Carré, J. R. G. Marquéz, B. Gruber, B. Lafourcade, P. J. Leitão, et al. 2012. Collinearity: A review of methods to deal with it and a simulation study evaluating their performance. Ecography 36 (1):27–46. doi:10.1111/j.1600-0587.2012.07348.x.
- Egerton, F. N. 2015. History of ecological sciences, part 54: Succession, community, and continuum. The Bulletin of the Ecological Society of America 96 (3):426–74. doi:10.1890/0012-9623-96.3.426.
- Ehrlén, J., and O. Eriksson. 2000. Dispersal limitations and patch occupancy in forest herbs. Ecology 81 (6):1667–74. doi:10.1890/0012-9658(2000)081[1667:DLAPOI]2.0.CO;2.
- Ellenberg, H., and D. Müller-Dombois. 1967. A key to Raunkiaer plant life forms with revised subdivisions. Berichte des geobotanischen Institutes der ETH, Stiftung Rübel 37:56–73.
- Ellenberg, H., H. E. Weber, R.Düll, V. Wirth, W. Werner, and D. Paulißen. 1992. Zeigerwerte von pflanzen in Mitteleuropa. Scripta Geobotanica 18:3–258.
- Elven, R. 1980. The Omnsbreen glacier nunataks—a case study of plant immigration. Norwegian Journal of Botany 27 (1):1–16.
- Eriksson, O., and K. Kainulainen. 2011. The evolutionary ecology of dust seeds. Perspectives in Plant Ecology, Evolution and Systematics 13 (2):73–87. doi:10.1016/j.ppees.2011.02.002.
- Erschbamer, B., and R. Mayer. 2011. Can successional species groups be discriminated based on their life history traits? A study from a glacier foreland in the Central Alps. Plant Ecology & Diversity 4 (4):341–51. doi:10.1080/17550874.2012.664573.
- Erschbamer, B., R. Niederfriniger Schlag, and E. Winkler. 2008. Colonization processes on a central Alpine glacier foreland. Journal of Vegetation Science 19 (6):855–62. doi:10.3170/2008-8-18464.
- Franzén, M., and P. Dieker. 2014. The influence of terrain age and altitude on the arthropod communities found on recently deglaciated terrain. Current Zoology 60 (2):203–20. doi: 10.1093/czoolo/60.2.203.
- Gardner, R. H., and K. A. M. Engelhardt. 2008. Spatial processes that maintain biodiversity in plant communities. Perspectives in Plant Ecology, Evolution and Systematics 9 (3–4):211–28. doi:10.1016/j.ppees.2007.08.003.
- Gaston, K. J. 1993. Rarity. London: Hall.
- GISTEMP-Team. 2016. GISS surface temperature analysis (GISTEMP). Dataset. NASA Goddard Institute for Space Studies. Accessed January 07, 2016. http://data.giss.nasa.gov/gistemp/.
- Grime, J. P. 1974. Vegetation classification by reference to strategies. Nature 250 (5461):26–31. doi:10.1038/250026a0.
- Grime, J. P., J. G. Hodgson, and R. Hunt. 1988. Comparative Plant Ecology. Amsterdam: Springer Netherlands.
- Hedwall, P.-O., J. Brunet, and M. Diekmann. 2019. With Ellenberg indicator values towards the north: Does the indicative power decrease with distance from Central Europe? Journal of Biogeography 46 (5): 041–53. doi:10.1111/jbi.13565.
- Hill, M.O., J. O. Mountford, D. B. Roy, and R. G. H. Bunce. 1999. Ellenberg's indicator values for British plants. In ECOFACT Volume 2 Technical Annex. Institute of Terrestrial Ecology. Norwich, G.B.: Department of the Environment, Transport and the Regions.
- Hobbie, E. A., S. A. Macko, and H. H. Shugart. 1998. Patterns in N dynamics and N isotopes during primary succession in Glacier Bay, Alaska. Chemical Geology 152 (1):3–11. doi:10.1016/S0009-2541(98)00092-8.
- Hodkinson, I. D., N. R. Webb, J. S. Bale, W. Block, S. J. Coulson, and A. T. Strathdee. 1998. Global change and Arctic ecosystems: Conclusions and predictions from experiments with terrestrial invertebrates on Spitsbergen. Arctic and Alpine Research 30 (3):306–13. doi:10.2307/1551978.
- Illa, E., E. Carrillo, and J. M. Ninot. 2006. Patterns of plant traits in Pyrenean alpine vegetation. Flora - Morphology, Distribution, Functional Ecology of Plants 201 (7):528–46. doi:10.1016/j.flora.2005.10.007.
- Johnson, E. A., and K. Miyanishi. 2008. Testing the assumptions of chronosequences in succession. Ecology Letters 11 (5):419–31. doi:10.1111/j.1461-0248.2008.01173.x.
- Jones, C. C., and R. Del Moral. 2009. Dispersal and establishment both limit colonization during primary succession on a glacier foreland. Plant Ecology 204 (2):217–30. doi:10.1007/s11258-009-9586-3.
- Jones, G. A., and G. H. R. Henry. 2003. Primary plant succession on recently deglaciated terrain in the Canadian High Arctic. Journal of Biogeography 30 (2):277–96. doi:10.1046/j.1365-2699.2003.00818.x.
- Jumpponen, A., H. Väre, K. G. Mattson, R. Ohtonen, and J. M. Trappe. 1999. Characterization of ‘safe sites’ for pioneers in primary succession on recently deglaciated terrain. Journal of Ecology 87 (1):98–105. doi:10.1046/j.1365-2745.1999.00328.x.
- Kaufmann, R. 2002. Glacier foreland colonisation: Distinguishing between short-term and long-term effects of climate change. Oecologia 130 (3):470–75. doi:10.1007/s00442-001-0815-2.
- Klaar, M. J., C. Kidd, E. Malone, R. Bartlett, G. Pinay, F. S. Chapin, and A. Milner. 2015. Vegetation succession in deglaciated landscapes: Implications for sediment and landscape stability. Earth Surface Processes and Landforms 40 (8):1088–100. doi:10.1002/esp.3691.
- Kleyer, M., R. M. Bekker, I. C. Knevel, J. P. Bakker, K. Thompson, M. Sonnenschein, P. Poschlod, J. M. van Groenendael, L. Klimes, J. Klimesova, et al. 2008. The LEDA Traitbase: A database of life-history traits of the Northwest European flora. Journal of Ecology 96 (6):1266–74. doi:10.1111/j.1365-2745.2008.01430.x.
- Klotz, S., I. Kühn, and W. Durka. 2002. BIOFLOR - Eine Datenbak mit biologisch-ökologischen Merkmalen zur Flora von Deutschland. Bonn - Bad Godesberg: Bundesamt für Naturschutz.
- Kraft, N. J. B., P. B. Adler, O. Godoy, E. C. James, S. Fuller, and J. M. Levine. 2015. Community assembly, coexistence and the environmental filtering metaphor. Functional Ecology 29 (5):592–99. doi:10.1111/1365-2435.12345.
- Kullman, L. 2004. Long-term geobotanical observations of climate change impacts in the Scandes of West-Central Sweden. Nordic Journal of Botany 24 (4):445–67. doi:10.1111/j.1756-1051.2004.tb02209.x.
- Kullman, L. 2010. Alpine flora dynamics a critical review of responses to climate change in the Swedish Scandes since the early 1950s. Nordic Journal of Botany 28 (4):398–408. doi:10.1111/j.1756-1051.2010.00812.x.
- Kullman, L., and L. Öberg. 2009. Post-Little Ice Age tree line rise and climate warming in the Swedish Scandes: A landscape ecological perspective. Journal of Ecology 97 (3):415–29. doi:10.1111/jec.2009.97.issue-3.
- Kume, A., T. Nakatsubo, Y. Bekku, and T. Masuzawa. 1999. Ecological significance of different growth forms of purple saxifrage, Saxifraga oppositifolia L., in the High Arctic, Ny-Ålesund, Svalbard. Arctic, Antarctic, and Alpine Research 31 (1):27–33. doi:10.1080/15230430.1999.12003278.
- Lawesson, J. E., A. M. Fosaa, and E. Olsen. 2003. Calibration of Ellenberg indicator values for the Faroe Islands. Applied Vegetation Science 6 (1):53–62. doi:10.1111/avsc.2003.6.issue-1.
- Lawrence, D. B., R. E. Schoenike, A. Quispel, and G. Bond. 1967. The role of Dryas drummondii in vegetation development following ice recession at Glacier Bay, Alaska, with special reference to its nitrogen fixation by root nodules. Journal of Ecology 55 (3):793–813. doi:10.2307/2258426.
- Martin, L. M., and B. J. Wilsey. 2006. Assessing grassland restoration success: Relative roles of seed additions and native ungulate activities. Journal of Applied Ecology 43 (6):1098–109. doi:10.1111/jpe.2006.43.issue-6.
- Matthews, J. A. 1992. The ecology of recently deglaciated terrain: A geoecological approach to glacier forelands and primary succession. Cambridge: Cambridge University Press.
- McCormick, M. K., D. Lee Taylor, K. Juhaszova, R. K. Burnett, D. F. Whigham, and J. P. O’Neill. 2012. Limitations on orchid recruitment: Not a simple picture. Molecular Ecology 21 (6):1511–23. doi:10.1111/j.1365-294X.2012.05468.x.
- McIntyre, S., S. Lavorel, and R. M. Tremont. 1995. Plant life-history attributes: Their relationship to disturbance response in herbaceous vegetation. Journal of Ecology 83 (1):31–44. doi:10.2307/2261148.
- Meiners, S. J., M. W. Cadotte, J. D. Fridley, S. T. A. Pickett, and L. R. Walker. 2015. Is successional research nearing its climax? New approaches for understanding dynamic communities. Functional Ecology 29 (2):154–64. doi:10.1111/1365-2435.12391.
- Mitchell, T., T. R. Carter, P. Jones, and M. Hulme. 2004. A comprehensive set of high-resolution grids of monthly climate for Europe and the globe: The observed record (1901–2000) and 16 scenarios (2001–2100). Tyndall Centre for Climate Change Research Working Paper 55, Norwich, UK.
- Molau, U., U. Nordenhall, and B. Eriksen. 2005. Onset of flowering and climate variability in an alpine landscape: A 10-year study from Swedish Lapland. American Journal of Botany 92 (3):422–31. doi:10.3732/ajb.92.3.422.
- Moles, A. T., and M. Westoby. 2002. Seed addition experiments are more likely to increase recruitment in larger-seeded species. Oikos 99 (2):241–48. doi:10.1034/j.1600-0706.2002.990204.x.
- Moles, A. T., and M. Westoby. 2004. Seed mass and seedling establishment after fire in Ku-ring-gai Chase National Park, Sydney, Australia. Austral Ecology 29 (4):383–90. doi:10.1111/aec.2004.29.issue-4.
- Moles, A. T., and M. Westoby. 2006. Seed size and plant strategy across the whole life cycle. Oikos 113 (1):91–105. doi:10.1111/oik.2006.113.issue-1.
- Mori, A. S., T. Osono, M. Uchida, and H. Kanda. 2008. Changes in the structure and heterogeneity of vegetation and microsite environments with the chronosequence of primary succession on a glacier foreland in Ellesmere Island, high arctic Canada. Ecological Research 23 (2):363–70.
- Muller, E., P. B. Eidesen, D. Ehrich, and I. G. Alsos. 2012. Frequency of local, regional, and long-distance dispersal of diploid and tetraploid Saxifraga oppositifolia (Saxifragaceae) to Arctic glacier forelands. American Journal of Botany 99 (3):459–71. doi:10.3732/ajb.1100363.
- Pachauri, R. K., and L. A. Meyer. 2014. IPCC 2014. Climate change 2014: Synthesis report. Contribution of Working Groups I, II and III to the Fifth Assessment Report of the Intergovernmental Panel on Climate Change. Geneva: IPCC.
- Post, E., M. C. Forchhammer, M. S. Bret-Harte, T. V. Callaghan, T. R. Christensen, B. Elberling, A. D. Fox, O. Gilg, D. S. Hik, T. T. Høye, et al. 2009. Ecological dynamics across the Arctic associated with recent climate change. Science 325 (5946):1355–58. doi:10.1126/science.1173113.
- Pywell, R. F., J. M. Bullock, D. B. Roy, L. Warman, K. J. Walker, and P. Rothery. 2003. Plant traits as predictors of performance in ecological restoration. Journal of Applied Ecology 40 (1):65–77. doi:10.1046/j.1365-2664.2003.00762.x.
- R Core Team. 2016. R: A language and environment for statistical computing. R Foundation for Statistical Computing, Vienna, Austria. Available: https://www.R-project.org/
- Raunkiaer, C. 1934. Life forms of plants and statistical plant geography/being the collected papers of C. Raunkiaer. Oxford, UK: Clarendon Press.
- Robbins, J. A., and J. A. Matthews. 2009. Pioneer vegetation on glacier forelands in southern Norway: Emerging communities? Journal of Vegetation Science 20 (5):889–902. doi:10.1111/jvs.2009.20.issue-5.
- Royal Botanic Gardens Kew. 2019. Seed Information Database (SID). Version 7.1. Available from: http://data.kew.org/sid/ (August 2019).
- Rydgren, K., R. Halvorsen, J. P. Töpper, and J. M. Njøs. 2014. Glacier foreland succession and the fading effect of terrain age. Journal of Vegetation Science 25 (6):1367–80. doi:10.1111/jvs.12184.
- Selander, S. 1950. Floristic phytogeography of South-Western Lule Lappmark (Swedish Lapland). Acta Phytogeographica Suecica, 27, 28.
- Stöcklin, J., and E. Bäumler. 1996. Seed rain, seedling establishment and clonal growth strategies on a glacier foreland. Journal of Vegetation Science 7 (1): 45–56.
- Thomson, F. J., A. T. Moles, T. D. Auld, and R. T. Kingsford. 2011. Seed dispersal distance is more strongly correlated with plant height than with seed mass. Journal of Ecology 99 (6):1299–307. doi:10.1111/jec.2011.99.issue-6.
- Violle, C., W. Thuiller, N. Mouquet, F. Munoz, N. J. B. Kraft, M. W. Cadotte, S. W. Livingstone, and D. Mouillot. 2017. Functional rarity: The ecology of outliers. Trends in Ecology & Evolution 32 (5):356–67. doi:10.1016/j.tree.2017.02.002.
- von Sydow, U. 1983. Vegetationskarta över de svenska fjällen. Kartblad nr 6. Stockholm: LiberKartor.
- Welling, P., A. Tolvanen, and K. Laine. 2005. Plant traits: Their role in the regeneration of alpine plant communities in sub-arctic Finland. Journal of Vegetation Science 16 (2):183–90. doi:10.1111/jvs.2005.16.issue-2.
- Westman, J. 1899. Beobachtungen über Gletscher von Sulitelma und Ålmajalos. In. H. Sjögren (ed.), Bulletin of the Geological Institution of the University of Uppsala, no. 7, vol. IV, Part 1, 1898. Uppsala, Sweden: University of Uppsala.
- Wood, D. M., and R. Del Moral. 1987. Mechanisms of early primary succession in subalpine habitats on Mount St. Helens. Ecology 68 (4):780–90.