
 ?Mathematical formulae have been encoded as MathML and are displayed in this HTML version using MathJax in order to improve their display. Uncheck the box to turn MathJax off. This feature requires Javascript. Click on a formula to zoom.
ABSTRACT
Weathering caused by interaction between glacial sediments and water in exposed moraines needs to be studied to evaluate their possible effects on the global carbon cycle. In this study, moraine ponds, moraine porewaters, and till samples were collected at a moraine adjacent to the Greenland Ice Sheet at Kangerlussuaq. Scanning electron microscopy (SEM) studies of the till show limited evidence of silicate chemical weathering, but the moraine waters have substantial solute concentrations. δ34SSO4 and δ18OSO4 data indicate that the origin of dissolved sulfate is the oxidation of sulfides, in agreement with the SEM observations. The dissolved HCO3−/SO42− molar ratios indicate an uneven balance between sulfuric and carbonic acid weathering; C-isotope data indicate that some of the CO2 originates from organic carbon mineralization. Ion–ion plots provide evidence of carbonate weathering and of the formation of secondary gypsum and calcite through evaporation and (or) cryoconcentration. The 87Sr/86Sr ratios in the waters correlate with the corresponding till samples, supporting the local origin of the dissolved strontium, which is higher in the waters than in the till due to the selective weathering of biotite. The data evidence a large degree of chemical weathering in moraines promoted by large rock–water ratios and by the hydraulic isolation created by the frozen till. The high PCO2 in the studied moraine waters indicates that they may represent a previously underestimated CO2 source.
Introduction
Weathering processes in glacial and periglacial conditions are of interest because, among other reasons, they play an important role in the regulation of CO2 in the atmosphere (Torres et al. Citation2017; Zolkos, Tank, and Kokelj Citation2018). A proper consideration of weathering under glacial conditions in the carbon mass balance models requires a good understanding of the main water–rock interaction processes under the ice sheets and in periglacial environments. Subglacial deposits are difficult to access and, therefore, there are only a few studies on weathering processes in subglacial environments (e.g., Tranter et al. Citation2002; Graly et al. Citation2014; Graly, Humphrey, and Harper Citation2016). Moraines are more suitable systems to study weathering processes in glacial sediments for three main reasons: (1) they are more accessible, (2) the water stored in them has longer residence times compared with streams and rivers, and (3) the mineral reactive surface areas are larger. Furthermore, the large volumes of exposed (uncovered) glacial sediments present at the ice front make these moraine ridges important contributors to carbon cycling. Therefore, a geochemical understanding of the processes affecting moraine waters complements and supports the knowledge about the chemical weathering conditions on other glacial and periglacial systems.
Data on weathering of glacial sediments are, at present, limited to a few laboratory experiments (Brown, Tranter, and Sharp Citation1996; Hodgkins, Tranter, and Dowdeswell Citation1998) and several field studies: (1) two of them in Svalbard (Cooper et al. Citation2002; Wadham et al. Citation2007; Szynkiewicz et al. Citation2013), (2) one in Iceland (Robinson, Fairchild, and Spiro Citation2009), (3) one from Antarctica (Skidmore et al. Citation2010), (4) one study in southeast Greenland (Kristiansen et al. Citation2013), and, finally, (5) a recent study from a sandur in west Greenland (Deuerling et al. Citation2018). In any case, more data are needed to evaluate the effects of the different factors, such as till mineralogy, climate, hydrological factors, etc., affecting the geochemistry of the porewaters in glacial sediments.
Here we present a geochemical data set to study the weathering processes in a historical moraine in a land-terminating region of the Greenland Ice Sheet (GrIS). The study site, near Kangerlussuaq, was selected due to logistic considerations and because previous geochemical studies are available on a nearby sandur (Deuerling et al. Citation2018) as well as for the ice sheet and some river systems and lakes of the area (Scholz and Baumann Citation1997; Anderson et al. Citation2001; Wimpenny et al. Citation2010, Citation2011; Ryu and Jacobson Citation2012; Graly et al. Citation2014; Hawkings et al. Citation2014, Citation2015; Hindshaw et al. Citation2014; Aciego, Stevenson, and Arendt Citation2015; Graly, Humphrey, and Harper Citation2016; Lindborg et al. Citation2016; Rydberg et al. Citation2016; Stevenson et al. Citation2017; Andrews and Jacobson Citation2018; Andrews et al. Citation2018; Henkemans et al. Citation2018; Deuerling et al. Citation2019). In the period between 2008 and 2013, a collaborative field and modeling study, the Greenland Analogue Project (GAP), was conducted in the Kangerlussuaq area (Claesson Liljedahl et al. Citation2016) by the national nuclear waste management organizations in Sweden (Swedish Nuclear Fuel and Waste Management Company), Finland (Posiva), and Canada (Nuclear Waste Management Organization). Among other activities, several boreholes were drilled through the ice sheet, and three deep boreholes were drilled into the bedrock; some of the data obtained from these boreholes (Harper et al. Citation2016; Henkemans Citation2016; Drake et al. Citation2017) are used to complement this study.
The present study concentrates on chemical weathering processes in the ponds and porewaters of the moraine. The ponds constitute relatively small dynamic systems of semiclosed character, where the water is a mixture of meltwater and present precipitation. This water reacts with the exposed mineral surfaces under the influence of dissolved gases (like CO2 and O2) and interacts with the organic system. Additionally, the results of some leaching experiments have helped to understand and support the main conclusions.
Study site
The study site is located about 33 km northeast of the Kangerlussuaq settlement in western Greenland (). The area is at the southern limit of the Nagssugtoqidian belt, a tectonic zone constituted of metamorphosed granodioritic to quartz dioritic gneisses with small amounts of amphibolite at the study site (Van Gool et al. Citation2002; Henriksen et al. Citation2009). Mineralogically they contain quartz, potassium feldspar, and plagioclases as major components and minor and variable amounts of biotite, muscovite, sphene, garnet, epidote, magnetite, amphibole, apatite, zircon, pyrite, chlorite, and calcite (Ryu and Jacobson Citation2012; Hindshaw et al. Citation2014; Deuerling et al. Citation2018). The Kangerlussuaq area is cold and arid, with a mean annual air temperature of −5.1°C at the Kangerlussuaq International Airport (as reported by Lindborg et al. [Citation2016], using data from Cappelen [Citation2016]) and 173 mm of precipitation (rain and snow, as evaluated by Johansson et al. [Citation2015] from data in Cappelen [Citation2014]).
The study area is located between the Isunnguata Sermia and Russell Glaciers (see ) directly at the margin of the GrIS. The coordinates for the sampling locations are plotted in and listed in Tables S1 and S2 in the supplemental material. The position of the ice margin during the Mid-Holocene (6000 to 5000 B.P.) is not known but it is believed to have been tens of kilometers to the east of the study site (Ruskeeniemi et al. Citation2018). Neoglacial advance started at about 4800 to 3200 B.P. The study area, and an unknown area now under the ice sheet, was thus covered by abundant vegetation during maybe as long as several thousand years (Van Tatenhove, van der Meer, and Koster Citation1996). The moraines at this site have been dated to the Little Ice Age; that is, approximately 1450 to 1850 A.D. (Forman et al. Citation2007; Young and Briner Citation2015; Carrivick et al. Citation2018; Levy et al. Citation2018).
Figure 1. Map of the study area and sampling points. The map on the left shows the location of the study area in Greenland. The map in the middle is a general view of the study area including the location of the samples studied here and the location of a deep borehole, GAP04, drilled within the GAP project (Harper et al. Citation2016). The map on the right is an enlargement of the area with the position of the sampling points. The samples taken at each sampling point are listed in Tables S1 and S2 (supplemental material).
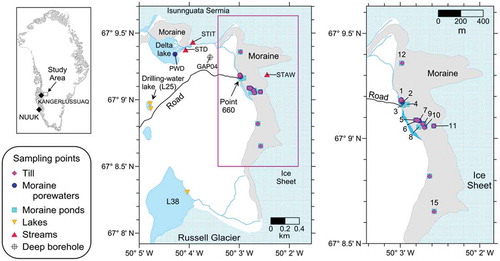
More in detail, the site is located at the end of the road leading to the Kangerlussuaq settlement, at the so-called Point 660 (), at an altitude of ~500 m a.s.l. The area is characterized by moderate relief (about 200 m) with glacial meltwater streams and lakes, marshes, and small lakes on frozen ground. The moraines in this area have been described previously (Levy et al. Citation2018) as being “steep-sided and ice-cored,” consisting of “unweathered boulders,” of “hosting little to no vegetation,” and of being “characterized by having from two to three crests, indicating that they were created by multiple stillstands or readvances,” a description that we endorse.
The landform that we have studied (right side of and photographs in the supplemental material) has an irregular relief (several tens of meters) that changes slowly over the years, as the ice inside slowly melts. This landform consists of glacial sediments (till) that have been transported from the glacier bed to the surface, and it is denoted in this article as “moraine” even if it is attached to the ice margin. The till layer is very thin at the eastern limit of the moraine, on top of the ice sheet, which in turn is probably tens of meters thick. Thus, the eastern area may be described as debris-rich glacier ice covered by supraglacial sediment, and in some of the western areas it is difficult to differentiate between frozen till (due to permafrost) and the debris-rich glacier located under the till in the eastern part of the site. The till becomes gradually thicker westwards and amounts up to tens of meters in its western limit, where it seems to rest on solid rock. It is also noticeable that small tiny arctic plants are relatively frequent in the western, older part of the moraine but almost absent in the eastern, more recent parts. Thus, it is likely that the thin till layer at the east has been deposited more recently than the thick layers toward the west. Finally, many small meltwater ponds are scattered on its surface, at depressions in the frozen till. Most of these ponds are perennial and persist until the ice contained in the underlying till eventually melts.
Methodology
Till sampling and analysis
Till samples were collected in August 2016 from the top layer (the upper 30 cm) of the moraine. The sampling locations are shown in and they are listed in Table S1 (supplemental material) together with the sampling dates. Sample names start with “TS” (for “till sample”), followed by two digits indicating the location shown in the map on the right in , and the name ends with two digits to indicate the sampling year. The samples were allowed to drain and air dry for a few days in Kangerlussuaq, transported by air to Sweden, and further air dried at the University of Gothenburg. They were then dry sieved for 15 minutes and separated into the following fractions: <0.04 mm, 0.04–0.125 mm, 0.125–0.25 mm, 0.25–0.5 mm, and >0.5 mm. The percentage of each fraction (in each sample) is shown in Table S3.
Thin sections and epoxy mounts were prepared for scanning electron microscopy (SEM) with back-scattered electron (BSE) imagery and equipped with energy-dispersive spectroscopy for determination of chemical composition in mineral grains. The analyses were carried out at the Department of Earth Sciences, Gothenburg University, Sweden. A few samples of the <0.04 mm fractions were analyzed by X-ray diffraction (XRD) for mineral identification (especially identification of clay minerals if present). Analyses and interpretation of the results were carried out by Professor E. Jonsson at the Swedish Geological Survey (Uppsala, Sweden). The chemical composition of the till was analyzed by either inductively coupled plasma (ICP)–atomic emission spectroscopy or ICP–mass spectroscopy (MS) on all size fractions using standard accredited methods by a commercial laboratory (ALS Scandinavia AB, Luleå, Sweden), and 87Sr/86Sr ratios on some fractions were analyzed after HNO3+ hydrofluoric acid digestion by an MC-ICP-MS NEPTUNE Plus ThermoScientific instrument at ALS Scandinavia AB.
Leaching experiments were performed on four till samples: 20 g of till, excluding the >5 mm fraction, was inserted into 50-mL conical centrifuge tubes with twist lids, and 35 mL of air-saturated Milli-Q deionized water was added to each tube, which were shaken and then stored upright in a refrigerator at a temperature of 5.5°C to interact for 1, 7, and 305 days. The 305-day samples were shaken approximately every 30 days. After interaction, the tubes were centrifuged and 30 mL of the leachate was acidified and analyzed with an Agilent 8800 triple quadrupole ICP-MS instrument at the University of Gothenburg, using N2O as the reaction gas. Additional leaching experiments were performed according to the same procedure described above but with 1 L of water and the same solid–solution ratio, interacted for 7 days, and analyzed for δ34SSO4 and δ18OSO4 at the University of Waterloo (Canada). The water used for the leaching experiment was also sent for δ18O analysis at the Institute for Energy Technology, Kjeller, Norway. This was done to be able to distinguish the sulfate originally present in the samples (and produced by glacial meltwater) from the one produced by oxidation of sulfide during the leaching experiment.
Water sampling and analysis
The water sampling program was carried out during three periods: at the beginning of September 2014, at the end of September through the beginning of October 2015, and in August 2016. The samples were taken from moraine porewaters and from meltwater ponds in the moraine, ranging from the east limit of the studied moraine to its western margin (), where a meltwater stream flows toward the north. To assess the spatial variability in the chemical weathering processes, additional samples were taken northwards and southwards, where a small stream flows toward the ice-dammed lake (L38 in ). Field measurements of electrical conductivity were used to select the more concentrated ponds reflecting a larger degree of chemical weathering. The sampling locations, which are shown in , are also listed in Tables S1 and S2, together with the sampling dates. Samples are named following the same procedure as for the till samples, except that the starting letter combination is either ST, L, PW, or MP (for stream, lake, moraine porewater, or pond, respectively).
The samples from the moraine ponds, streams, and lakes were taken in polyethylene bottles. Samples for cation analysis were filtered through 0.45-μm pore size filters and acidified with HNO3, and samples were unfiltered and unacidified for the analysis of anions, stable isotopes, dissolved inorganic carbon (DIC), and total and dissolved organic carbon (TOC and DOC). Samples for carbon isotopes were collected, unfiltered, in dark glass bottles. The moraine porewaters were sampled by inserting high-density polyethylene screen tubes in holes, previously made with an iron rod, in fine-grained sand moraine to a depth that varied from about 0.1 m where the moraine is very thin (on top of the ice sheet at its eastern margin) to approximately 1 m in the western margin of the moraine where the moraine is thick, with ridges that are up to tens of meters high. Samples were lifted after approximately 1 day using a polyamide tube by closing the upper end.
Field measurements were made using a Hach HQ portable pH/conductivity meter. All water samples were kept refrigerated at the site for a few days and then transported by air to Sweden before being sent for analysis within a few days. Cation analyses were performed by ICP instruments by ALS Scandinavia AB, and alkalinity (titration) and major anions (ion chromatography) were analyzed at the Äspö HRL laboratory. Stable isotope analyses were performed either at the University of Waterloo Environmental Isotope Laboratory, Waterloo, Canada (δ34S, δ18OSO4, 87Sr/86Sr), or at the Institute for Energy Technology (δ18O and δ2H). δ34S data are reported relative to the Vienna Canyon Diablo Troilite standard, and δ18O and δ2H are relative to the Vienna Standard Mean Ocean Water (VSMOW). Carbon isotopes were analyzed at Ångströmlaboratory, Uppsala University (Uppsala, Sweden). Additional details and uncertainties are provided in the supplemental material.
Mean charge balance errors were calculated with PHREEQC (Parkhurst and Appelo Citation2013). The meltwaters collected directly from the ice sheet (samples STD14, STIT16, and STAW16) with the lowest salt contents showed charge imbalances between 45 percent and 76 percent, and these samples are not considered in the discussion of solute contents. For the rest of the moraine waters the charge imbalance was below 10 percent except for seven samples that showed charge balance errors between 10 percent and 20 percent. These results are considered acceptable taking into account the low ionic contents in these waters, approaching the detection limits of the analytical techniques. Two standard deviations (2σ) are used when reporting uncertainties in averages of our sample values.
Results
Moraine mineralogy
The grain sizes within the samples ranged from the centimeter to the micrometer scale, although the real clay fraction was relatively small. The composition of the till samples is provided in the supplemental material (Tables S3 and S4). The mineralogical composition of the till is dominated by Na-rich plagioclase and quartz. Less frequent are K-feldspar, amphibole, magnetite, biotite, pyrite, chalcopyrite, garnet, epidote, apatite, and monazite. Plagioclase composition falls within the oligoclase range (An20–An30) and the average amphibole composition corresponds to Fe-dominated hornblende with Ca and Mg in slightly smaller amounts than the Fe (see Table S5). Biotite shows variable proportions of Fe and Mg, although the iron content is usually higher (Table S6).
XRD of the fine fraction (<0.04 mm) confirmed that it is dominated by quartz and feldspars, although chlorite and mixed-layer chlorite/illite were present as well. The mineralogical composition of the till samples is in agreement with the composition previously reported on subglacial sediments and on the sediments from the Isunnguata Sermia outwash (Graly, Humphrey, and Harper Citation2016), near the moraine studied here, or on debris-containing samples in the basal ice profile studied by Yde et al. (Citation2010) at the margin of the GrIS (north of the Russell Glacier).
Texturally the till grains were angular to slightly rounded. In general, no alteration rims were visible with SEM, although increased microfracturing was observed in some of the plagioclase grains with small dissolution pits along the crystal borders. In contrast, biotite commonly showed a significant decrease in K due to interlayer dissolution (and also Mg in some samples), although unaltered biotites were occasionally present (–).
Pyrite and chalcopyrite grains showed oxidative breakdown and precipitation of Fe(III) oxides/oxyhydroxides, although the oxidation was usually incomplete and cores of sulfide remained. The degree of oxidation seems to depend on microfracturing of the silicate mineral hosting the sulfide in such a way that intact minor pyrite crystals can be preserved if hosted in less fractured amphibole or feldspar grains (–).
Figure 2. (a), (b) SEM images of biotite with different weathering stages and (c), (d) pyrite with outer rims of iron oxyhydroxides in a different degree of alteration visible in the pyrite grains with exposed surfaces. (a) TS1016: nonweathered biotite grain with a potassium content of 4.24 atom-%. (b) TS1016: biotite grain affected by weathering with a mean potassium content of 0.69 atom-% (maximum 2.29 atom-%). Bt = biotite, Pl = plagioclase, Am = amphibole. (c) TS1016: pyrite, FeS2 (Py), with an oxidized outer rim that contains 4.49 atom-% S, 0.33 atom-% Ca, 28.41 atom-% Fe, 2.42 atom-% Si, 0.36 atom-% Al, and 64.00 atom-% O, denoted FeOOH in the figure. (d) TS0516: pyrite crystal with a thin alteration rim with oxidized iron (FeOOH).
Neither calcite nor gypsum have been confirmed in the fieldwork or in the XRD and SEM analyses of the till samples. However, chemical analysis indicated correspondingly increased values of C, loss on ignition (LOI), and Ca/Sr molar ratio in the finest fraction (not possible to examine by SEM), which would be coherent with the presence of some calcite in that fraction.
Laboratory till leaching experiments
The results of the leaching experiments performed in four of the till samples are listed in Tables S7 and S8. The leaching experiments showed the release of cations (Na, Ca, K, and Mg) and sulfate in all samples as well as a clear trend of increased concentrations with time (at 1, 7, and 305 days). The pH of the leachates also increased with time from the original leaching solution value (5.51) to values between 6 and 6.7 as a result of the active weathering reactions during the experiments.
At the end of the longest leaching experiments, the composition of the leachates mimics that of the moraine porewaters and ponds and the concentrations of cations and sulfate in the leachates of the four moraine samples were clearly in the range (and, frequently, near the average values) observed in the field samples.
Field water samples: Chemical and isotopic data
Data corresponding to the samples collected in this study (moraine porewaters, ponds, streams, and lakes) are provided in Tables S9 and S10.
The field measurements for electrical conductivity range from 10 to 340 μS/cm, with an average of 148 μS/cm, and those for pH ranged from 6.0 to 9.5, with an average of 7.1. Calcium and magnesium are the main cations and the approximate equivalent percentages of calcium, magnesium, sodium, and potassium are 66, 19, 10, and 7 percent of the total cationic charge, respectively. Sulfate and bicarbonate are the main anions, and the approximate equivalent percentages of sulfate, alkalinity, and chloride are 58, 39, and 3.5 percent, respectively, of the total anionic charge, although with a large variability.
With these chemical characteristics, and except for two samples, the moraine porewaters and ponds are distributed in a narrow and elongated area from the Ca-HCO3 field to the Ca-SO4 field in the Piper diagram (Figure 3). The streams sampled in our study are also included in this narrow area, whereas the lake samples define the more extreme Ca-HCO3 character of the band.
Other waters analyzed in the Kangerlussuaq area are also plotted in for comparison purposes, including porewaters from the sandurs and some samples from the Watson River studied by Deuerling et al. (Citation2018), the basal and the subglacial meltwaters in the Isunnguata Sermia outlet sampled by Graly et al. (Citation2014), and the groundwaters sampled in the GAP boreholes (Henkemans Citation2016). The porewaters from the sandurs are practically in the same position in the Piper diagram as the moraine porewaters and ponds studied in this article, and the molar ratio [Mg+Ca]/[Na+K] is also similar. The rest of the waters included in are richer in alkali metals.
Figure 3. Piper diagram in the moraine porewaters and ponds, stream ST01, and lakes L25 and L38 sampled in this study. Also included for comparison: sandur porewaters and samples from the Watson River (Deuerling et al. Citation2018); basal (subglacial) meltwaters sampled through boreholes and Isunnguata Sermia outlet samples (Graly et al. Citation2014); and deep borehole groundwaters (Henkemans Citation2016).
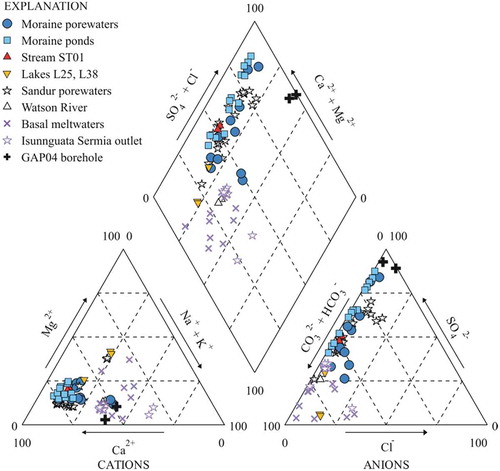
Figure 4. Plot of δ2HVSMOW vs. δ18OVSMOW for the water samples collected in this work. For comparison, the figure also includes basal ice samples from Yde et al. (Citation2010). The local meteoric water line (LMWL) is that proposed by Linhoff (Citation2016) from rain and snow data at the Leverett base camp.
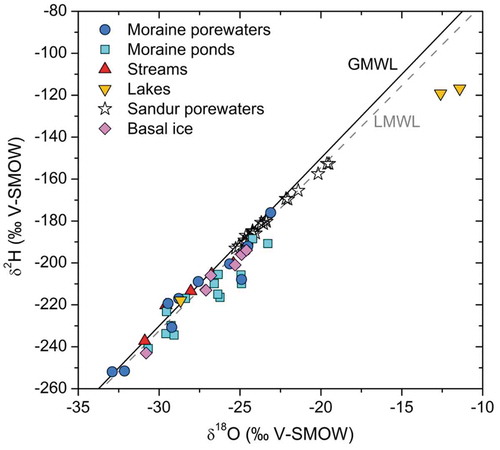
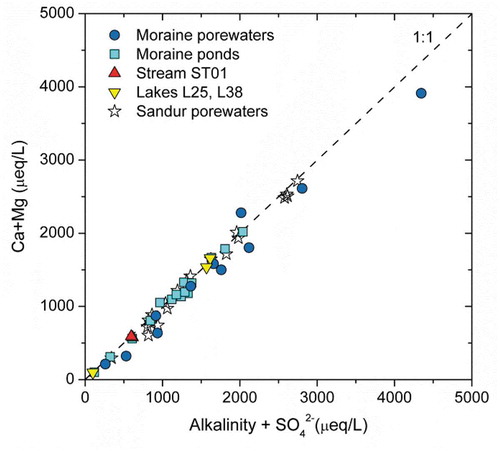
Figure 5. Scatterplot of Ca+Mg (μeq/L) vs. HCO3− +SO42− (μeq/L) for the waters analyzed in this study and for the sandur porewaters reported in Deuerling et al. (Citation2018).
Dissolved silica concentrations show a wide range in the moraine porewaters (233 ± 205 μmol/L) and in the moraine ponds (172 ± 139 μmol/L), and they are clearly higher than those found in the streams and lakes sampled in this study (20 ± 9 μmol/L).
Carbon contents were only analyzed in two moraine porewaters and in about half of the sampled moraine ponds. DOC and TOC contents range from 17 to 1,374 μM and from 58 to 2,023 μM, respectively. As expected, TOC contents are only slightly higher than DOC concentrations, except in the case of the porewater sample PW0116. Without considering this sample, the correlation between DOC and TOC is fairly good (R = 0.99).
The available isotopic data include values for δ18O, δ2H, and δ3H in water, as well as values for the 87Sr/86Sr isotopic ratio and for δ13C and δ14C in dissolved organic and inorganic carbon.
The stable isotopes of water are shown in . A slight evaporation signature is discerned in the moraine pond waters, and this signature is very clear for the L25 lake, the drilling water source for the GAP04 deep borehole (Claesson Liljedahl et al. Citation2016; Harper et al. Citation2016; Henkemans Citation2016). A similar evaporation trend exists for other lakes in the Kangerlussuaq area (Henkemans et al. Citation2018). A comparison with the isotope signatures of basal ice from the area reported by Yde et al. (Citation2010) confirms that the moraine waters are essentially glacial meltwaters.
The moraine ponds are either free of tritium (MP1016 and MP0216; Table S9) or they have values lower than 3.2 tritium units (TU). The only available data for the porewaters shows a value of 3.2 TU (PW0116; Table S9), whereas the waters in the studied lakes are free of tritium (Lake L38, the ice-dammed lake) or show the highest measured tritium values (lake L25, the drilling water pond, from 6.7 to 8.6 TU; Table S9).
The mean values for the 87Sr/86Sr isotopic ratio (Table S9) in the moraine porewaters (0.742 ± 0.015), moraine ponds (0.741 ± 0.016), and lakes (0.739 ± 0.017) show a more radiogenic signature than the range of values for the till (0.711 ± 0.005; Table S4).
Samples for δ13C and δ14C analysis, for both dissolved organic and inorganic carbon, were taken from two moraine ponds, MP15 and MP09, from the nearby nonglacial lake, L25, and from two “pristine” meltwaters, the STIT (collected from a subglacial stream directly as it emerged; the ice tunnel stream) and L38, to be used as references. Overall, the range of values for δ13Cinorg is quite wide, from −3.7 per mill to −14 per mill, whereas the values for δ13Corg range from −23.2 per mill to −28 per mill (see Table S9).
With respect to the 14C in the TOC, samples STIT and L38 show the lower values (older TOC), 70.5 and 70.3 pMC (percent of modern carbon), respectively, whereas the highest values (more modern TOC) were found in the nonglacial lake L25 (123.1 and 123.7 pMC; Table S9). 14C values for the moraine ponds are 78.3 and 82.4 pMC. The 14C data in the DIC show the lowest values in the analyzed moraine pond waters (83 and 89.4 pMC) and the highest ones in lake L25 (148.9 and 154.0 pMC). 14C values in sample STIT and lake L38 are 91.2 and 93.7 pMC, respectively.
Discussion
The study of the till material shows that physical erosion has produced particles of variable size with fresh reactive mineral surfaces, whereas the imprints of chemical weathering reactions are not equally obvious in the observed mineralogy. Exceptions are the clear signs of biotite weathering and sulfide mineral oxidation, the latter suggesting participation of sulfuric acid in weathering reactions. In order to assess the main weathering reactions in the moraine, the contents and ratios of the main chemical components (weathering agents and major cations) were evaluated in the studied moraine porewaters and ponds. The possible sources and sinks were assessed, considering the mineralogical description of the till, and the possible chemical weathering reactions are provided in . The data obtained in our study are compared, whenever possible, with the recent study on sandur porewaters (Deuerling et al. Citation2018), because that system may be comparable to the deposits in the moraine studied here in terms of solid–solution ratio and timescales for chemical reactions.
Table 1. Chemical weathering reactions.
Dissolved Ca and Mg may have multiple mineral sources in the studied waters (e.g., oligoclase, amphibole, epidote, carbonates, and sulfates), and the same is valid for Sr. However, Na, K, and Si sources are restricted to the silicate minerals and therefore their contents can be used as tracers of silicate weathering (). Additionally, the molar [Mg+Ca]/[Na+K] ratios may provide an indication of the relative importance of silicate vs. carbonate weathering reactions. The moraine porewaters and ponds show a wide variability in this ratio (from 0.77 to 4.25), wider than the values found in the sandur porewaters (from 1.7 to 3.9), suggesting that the relative intensity of silicate and carbonate (and/or sulfate; see below) weathering is highly variable.
Thus, both groups of dissolved components (Ca, Mg, and Sr, and Na, K, and Si) are discussed in separate subsections. Further, tritium and carbon and its isotopes may provide some information on the age and origin of the waters and on the sources and processes contributing to dissolved organic and inorganic carbon.
Calcium, magnesium, and strontium
shows a plot of Ca+Mg vs. HCO3+SO4 for the moraine waters studied here and the data from the sandurs (Deuerling et al. Citation2018). There is a very good correlation (R = 0.99) and the samples fall in the 1:1 equiline. Two main indications can be extracted from the figure:
Pyrite oxidation processes (and consequent precipitation of Fe(III) oxides/oxyhydroxides), clearly seen in the SEM observations of the studied tills (), have to be coupled to the weathering of carbonates or silicates (sulfuric acid carbonate weathering [SACW] and sulfuric acid silicate weathering [SASW] reactions in ), under either oxic or anoxic conditions (reactions (1) and (2)); otherwise, there would be an excess of dissolved sulfate that would set the samples to the right of the 1:1 line.
(1)
Carbonate weathering reactions are faster than silicate weathering (see e.g., Arvidson et al. Citation2003; Palandri and Kharaka Citation2004; Marty et al. Citation2015; Rickli et al. Citation2017), and therefore, sulfide oxidation is more easily coupled to the carbonate weathering reactions if calcite is present.
HCO3− and SO42− concentrations correspond to the weathering of Ca and Mg-bearing minerals (carbonates, sulfates and silicates), otherwise the points would fall further below the 1:1 line, indicating that part of the HCO3−+SO42− contents should be balanced with weathering reactions involving Na and K cations from silicates (their only possible source).
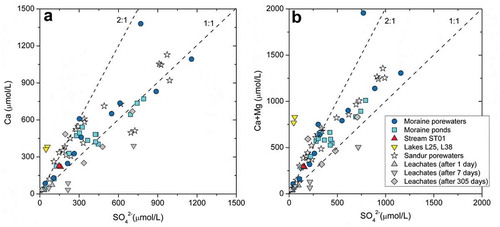
shows that dissolved Ca2+ vs. SO42− and (Ca2++Mg2+) vs. SO42− are also strongly correlated: for the moraine waters, R = 0.89 and 0.80, respectively; for the laboratory leaching experiments, R = 0.82 and 0.83; and for the sandurs data reported by Deuerling et al. (Citation2018), R = 0.91 and 0.97. Two trends can be seen:
a group of waters plot clearly along the 2:1 trend, which is consistent with SACW () and it is an argument for the presence of calcite.
The largest number of waters are close to the 1:1 trend, which is consistent with either SASW () or with the dissolution of sulfate salts (SSD; ).
Similar trends have been inferred in other studies of periglacial areas (Bhatia et al. Citation2013; Ansari Citation2016; Deuerling et al. Citation2018).
Overall, the HCO3−/SO42− molar ratios are widely variable (from 0.27 to 4.36), suggesting a variable prevalence of sulfuric acid weathering and/or secondary gypsum dissolution (low values) vs. CO2 weathering processes (high values).
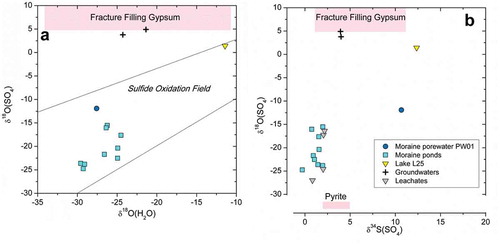
The stable isotopes of sulfate, δ34SSO4 and δ18OSO4, provide information on its origin. Figure 7 shows a plot of δ18OSO4 vs. δ18OH2O, where the moraine porewaters and ponds are positioned in the sulfide oxidation field (Van Stempvoort and Krouse Citation1993), indicating that the sulfur source in these waters is the oxidation of pyrite, in agreement with the SEM observations in the till (–) and also with the δ34S values for pyrite given by Henkemans et al. (Citation2018) of +2.3 per mill to +3.7 per mill. In addition, the sulfate isotope data () indicate that the dissolved sulfate does not originate from the gypsum found abundantly as fracture filling mineral in the deep bedrock of the area (Harper et al. Citation2016; Henkemans Citation2016), although this fracture filling mineral was found to be the main origin for the dissolved sulfate in the deep groundwaters from the GAP04 borehole.
With the aim of determining whether the oxidation of pyrite occurs under oxic or anoxic conditions, several papers have discussed the possibility of using δ18OSO4 to determine the proportion of O atoms from water and from atmospheric oxygen (e.g., Bottrell and Tranter Citation2002; Wynn, Hodson, and Heaton Citation2006; Wynn et al. Citation2015). These papers suggest that anoxic conditions prevail if less than 25 percent of the O atoms in sulfate originate from O2. However, as concluded by Hindshaw et al. (Citation2016) based on their results and laboratory experiments (Usher et al. Citation2004, Citation2005; Chandra and Gerson Citation2011), the δ18OSO4 values cannot be used to determine whether anoxic conditions are present or not during the oxidation of sulfide.
The δ34SSO4 and δ18OSO4 values measured in the till leachates (Table S8) confirm that the source of sulfate is pyrite oxidation. The δ34SSO4 values around −0.5 per mill to +3 per mill are in agreement with oxidation of pyrite as the original sulfur source, but the low values of δ18OSO4 (much lower than the leaching water used in the experiment, −10 per mill SMOW) clearly indicate dissolution of a pre-existing sulfate (secondary salts); if, instead, the oxidation had occurred during the leaching experiment, much higher δ18OSO4 values should have been obtained. Therefore, secondary salts must have been present in the field prior to the till sampling, although some calcite and gypsum may have formed through evaporation of the porewater during the air drying of the till samples before the leaching experiments.
Formation of secondary salts (e.g., gypsum) is common in permafrost and glacial environments as a result of evaporation and cryoconcentration (Cooper et al. Citation2002; Tranter and Wadham Citation2014; Bisson et al. Citation2015; Lehn et al. Citation2017; Deuerling et al. Citation2018). Near the land surface, evaporative concentration may drive the waters toward the surface by capillary suction, eventually becoming so concentrated that efflorescent salts may precipitate. During the fall and winter, freezing of waters below the ground surface also results in the progressive concentration of the residual solution (cryoconcentration), which may lead to the precipitation of secondary salts. Subsequent dissolution by meltwaters during the summer could result in the observed 1:1 trends of Ca+Mg vs. SO42− contents in . The thermodynamic feasibility of this process was confirmed by simulations of the evaporation of moraine waters with PHREEQC (Parkhurst and Appelo Citation2013), showing that calcite and gypsum (in some cases even celestite) precipitate at the end of the evaporative path. Secondary gypsum dissolution (SSD in ) would also be consistent with the observed trend in the Piper diagram () from Ca-HCO3 to Ca-SO4 water types for the moraine porewaters and ponds and also for the sandur porewaters studied by Deuerling et al. (Citation2018).
Calcite and gypsum were also found as major fracture filling in the gneisses sampled at depth through borehole GAP04 (Eichinger and Waber Citation2013; Claesson Liljedahl et al. Citation2016; Harper et al. Citation2016; Henkemans Citation2016). Calcite has also been found in the bedload, in the suspended sediments, and in the moraine sediments of the area (Scribner et al. Citation2015; Linhoff Citation2016; Deuerling et al. Citation2018), with carbonate mineral contents ranging between 0.25 and 0.73 g CaCO3/kg (Scribner et al. Citation2015; Deuerling et al. Citation2018). Therefore, the presence of trace amounts of calcite in the till is to be expected. This is important because the presence of calcite and/or gypsum, even at trace levels, may have major implications on the chemical characteristics of the waters because the dissolution rates of these two minerals are orders of magnitude faster than those of the identified primary silicate minerals (Palandri and Kharaka Citation2004; Colombani Citation2008; Rickli et al. Citation2017).
The leaching experiments showed that the composition of the leachates mimics that of the moraine porewaters and ponds and the concentrations of cations and sulfate in the leachates of the four moraine samples were clearly in the range observed in the field samples. An especially “fast source” of solutes is suggested by the fact that most of the contents of cations and sulfate for one of the leached samples (TS1016; Table S7) was in the range of the field values after 7 days of leaching. In fact, a linear trend for the Ca+Mg vs. SO42− contents of all of the leachates (R = 0.83) was observed after 7 days of leaching (). Dissolution rates of the till minerals may span almost ten orders of magnitude (see, e.g., Palandri and Kharaka Citation2004; Marty et al. Citation2015; Rickli et al. Citation2017), but the leaching experiments evidence that concentrations similar to those measured in the moraine porewaters and ponds can be reached in less than a year. These fast chemical weathering rates suggest the presence of secondary salts (such as calcite and gypsum) at the beginning of the experiments, because they have the fastest dissolution rates.
Figure 6. Scatterplots of (left) Ca vs. SO42− and (right) Ca+Mg vs. SO42− for the waters in this study and the sandur porewaters reported in Deuerling et al. (Citation2018). The results obtained from the leaching experiments over time are also shown for comparison.
Two main conclusions are drawn: (1) the primary source of the dissolved sulfate is the in situ oxidation of sulfide minerals, which is supported by the isotopic relations displayed in , the results of the leaching experiments, and the mineralogical studies indicating that the oxidation of sulfides is an ongoing process producing dissolved sulfate (), and (2) evaporation or cryoconcentration promotes the precipitation of secondary calcium salts (carbonates and sulfates) that eventually are redissolved, transferring the contents that initially originated from the primary till minerals to the water again.
Figure 7. (Left) δ18OSO4 vs. δ18OH2O for the moraine waters. (Right) δ18OSO4 vs. δ34SSO4 for the moraine waters (Table S9 in the supplemental material) and for the laboratory leachates from the till after 7 days (see Table S8 in the supplemental material). Both diagrams also show data for the deep groundwaters sampled in the GAP04 borehole (Harper et al. Citation2016; Henkemans Citation2016), as well as the range of values for the pyrite and gypsum found abundantly as fracture filling minerals in the bedrock of the area (Henkemans et al. Citation2018).
Considering the Ca+Mg vs. alkalinity trends (), some samples plot close to the 1:2 line, which is consistent with the carbonic acid weathering of either carbonates or silicates (CACW or CASW, respectively, ). The CACW process would be prevalent because (1) calcite dissolves orders of magnitude faster than silicate minerals (Arvidson et al. Citation2003; Palandri and Kharaka Citation2004; Marty et al. Citation2015), (2) the waters are clearly undersaturated with respect to calcite (Table S9), and (3) calcite is probably present in the fine fraction of the till, as indicated by its increased Ca/Sr molar ratio (see Moraine Mineralogy in the Results section).
Apart from the small number of waters having a 1:2 ratio in , most of the moraine porewaters and ponds and the sandur porewaters from Deuerling et al. (Citation2018) show an excess of Ca+Mg concentrations (), indicating that there must be another source for these cations, in addition to the CACW reactions of . Such a source may be SASW () and SSD (); note that gypsum is undersaturated in all of the waters (Table S9). To evaluate the effect of such contributions on the content of the divalent cations, the dissolved sulfate concentration was subtracted from the Ca+Mg content in the waters, and these values were plotted against the alkalinity (), resulting in a clear 1:2 trend. This suggests that, excluding the effect of the SASW and SSD reactions (), the carbonic acid weathering of carbonates and silicates () explains the observed Ca+Mg vs. alkalinity trend.
Figure 8. (a) Ca+Mg vs. alkalinity and (b) “corrected” contents of Ca+Mg vs. alkalinity. The plots show data for the water samples collected in this study as well as data for the sandur porewaters reported in Deuerling et al. (Citation2018).
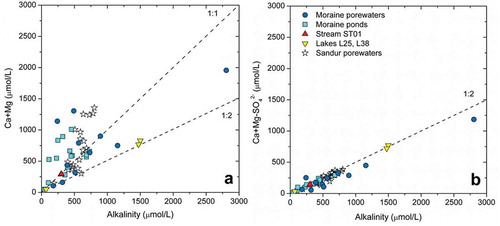
Figure 9. Concentrations of Ca vs. Sr for the waters in this study and the sandur porewaters from Deuerling et al. (Citation2018). Regional silicate end-member (green dashed line, Ca/Sr = 0.18) and carbonate end-member (blue dash-dotted line, Ca/Sr = 0.88) are also included Deuerling et al. (Citation2018).
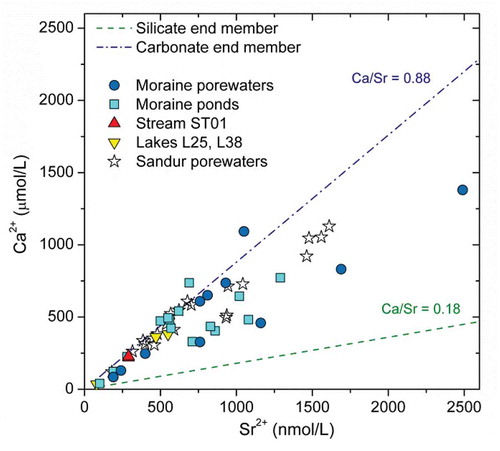
A common way to assess the relative importance of carbonate vs. silicate minerals weathering is the evaluation of the Ca/Sr ratio measured in the waters, because it is different for these two mineral groups (Jacobson et al. Citation2002; Scribner et al. Citation2015; Deuerling et al. Citation2018). Deuerling et al. (Citation2018) proposed as the Ca/Sr regional end-members for silicate and carbonate mineral weathering the values of 0.18 and 0.88 μmol/nmol, respectively, from analyses of rock minerals from the area and from a weak acid leachate of the bedload material from the Watson River. These end-member values agree with the Ca/Sr ratios reported by other authors (Jacobson et al. Citation2002; Scribner et al. Citation2015).
The calculated average Ca/Sr for the till samples studied here (Tables S3 and S4) is 0.21 ± 0.09 μmol/nmol, which is in agreement with the Ca/Sr values for silicate minerals reported by Deuerling et al. (Citation2018), confirming that the fraction of carbonates is quite small in the till studied here. The average Ca/Sr ratio for the moraine water samples (; Table S9) is 0.67 ± 0.41 μmol/nmol, showing a clear enrichment during the weathering processes of Ca compared to Sr, which is interpreted as preferential carbonate dissolution (reactions CACW and SACW vs. CASW and SASW in ). Furthermore, almost none of the water samples have the low Ca/Sr ratios expected for the pure silicate end-member, so a carbonate weathering contribution in the moraine waters appears to be always present. The relative intensity of silicate and carbonate weathering, as inferred from the variability in Ca/Sr ratios of the moraine waters, most probably depends on the heterogeneous distribution of the calcite, because there is a clear correlation (R = 0.82) between the Ca/(1000 Sr) molar ratios of the till with those of the corresponding moraine waters (Figure S2).
87Sr/86Sr values
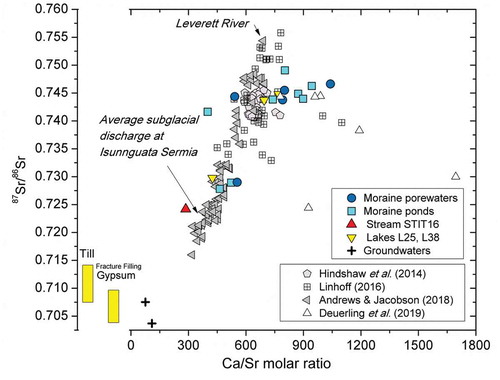
The 87Sr/86Sr isotopic ratios for the moraine porewaters, moraine ponds, and lakes (Table S9) show a more radiogenic signature than the range of values for the till (0.711 ± 0.005) or for the gypsum found as fracture fillings in the bedrock (0.714 to 0.702; Henkemans Citation2016; see Figure 10). This result supports the conclusion, drawn from the data plotted in ; that is, that the gypsum found as fracture fillings in the deep bedrock in this area has not contributed to the composition of the studied moraine waters. Instead, the high 87Sr/86Sr values in the moraine porewaters and ponds are in line with those found by Henkemans et al. (Citation2018) in the ice-marginal lakes of the Kangerlussuaq area (between 0.73 and 0.76) and also in line with those in the Leverett proglacial river, approximately 11 km southwest of the moraine deposits studied here (Hindshaw et al. Citation2014; Linhoff Citation2016; Andrews and Jacobson Citation2018).
The higher 87Sr/86Sr values in waters (Table S9) compared to those in the till are usually interpreted as being caused by biotite weathering (e.g., Anderson et al. [Citation2000]; Henkemans et al. [Citation2018] and references therein), which is also in agreement with the SEM observations of the till samples (). In contrast, subglacial discharge near the moraines studied here showed a much less radiogenic character: sample STIT16 has 87Sr/86Sr = 0.7242 (see Table S9), similar to the results from the study by Andrews and Jacobson (Citation2018) in the same area (87Sr/86Sr mean values of 0.722 ± 0.002 and 0.721 ± 0.002 in 2014 and 2015, respectively), suggesting a different Sr source for the subglacial meltwaters.
There is a correlation (R = 0.79) between the 87Sr/86Sr values and the Ca/Sr molar ratio of the waters studied here (see ). As discussed above, high Ca/Sr ratios are indicative of carbonate (calcite) weathering and therefore the data in suggest that carbonates are contributing to high 87Sr/86Sr, in addition to biotite. Because the strontium radiogenic signatures are low in calcites (Faure Citation1991; McNutt Citation2000) and the data in require a carbonate mineral with a high 87Sr/86Sr ratio, a calcite of secondary origin is required. This could be calcite precipitated subglacially as described in Refsnider et al. (Citation2014) or recent calcite formed locally through evaporation and cryoconcentration processes, which can be expected to have high 87Sr/86Sr ratios from biotite weathering (the calcites would have 87Sr/86Sr equal to that of the water from which it precipitated). Note that there is a strong correspondence between the 87Sr/86Sr values for the moraine waters and the corresponding composition of the till sampled at the same location (see Figure S3 in the supplemental material).
Figure 10. Strontium isotope data vs. Ca/Sr molar ratio for the water samples of this study compared with the range of strontium isotopes values for the till (this study) and for the gypsum found as fracture fillings in the underlying deep bedrock (Henkemans Citation2016). The figure also shows the data from Deuerling et al. (Citation2019) for the Watson River and the rivers discharging the Russell and Leverett Glaciers (Hindshaw et al. Citation2014; Linhoff Citation2016; Andrews and Jacobson Citation2018) at distances ranging from 2 km to about 30 km southwest of our study site.
Sodium, potassium, and silica
In a crystalline environment like this, sources of Na, K, and Si are restricted to the silicate minerals and therefore their contents can be used as tracers of silicate weathering reactions (Wadham et al. Citation2010; Bhatia et al. Citation2013). In the studied waters, Na+K concentrations are positively correlated with alkalinity (R = 0.88) suggesting a possible CASW () control. In contrast, Na+K contents are poorly correlated with dissolved sulfate (R = 0.37), suggesting a minor importance of SASW reactions (). From the analyzed mineralogy, sodium may be derived from Na- and K-feldspar and, most probably, from Na-rich plagioclase weathering () because plagioclase is the most abundant and most easily alterable Na-bearing mineral in the till (Palandri and Kharaka Citation2004; Marty et al. Citation2015).
The proportion of K (~6 percent) in the dissolved cationic content of the moraine waters is the lowest but still significant and it might be derived from Na- and K-feldspar but especially from biotite (). The surface reactivity of biotite is highly anisotropic, with edge surfaces between 30 and 300 times more reactive than basal surfaces (see, e.g., Bray et al. [Citation2015] and references therein), and it is probable that this has favored the observed weathering and preferential release of K from the interlayer sites in the biotite grains as shown by SEM–energy-dispersive spectroscopy (). Such preferential weathering has also been observed in other glacially derived materials (Föllmi et al. Citation2009; Wimpenny et al. Citation2010, Citation2011; Bray et al. Citation2015).
Dissolved silica concentrations in the moraine porewaters and moraine ponds (mean values of 233 ± 205 and 172 ± 139 μmol/L, respectively) are also much higher than those found in the Watson River and nearby lakes (Ryu and Jacobson Citation2012; Yde et al. Citation2014; Andrews and Jacobson Citation2018), the subglacial waters draining the Isunnguata Sermia (Graly et al. Citation2014; Andrews and Jacobson Citation2018), the Leverett Glacier (Lawson et al. Citation2014; Hawkings et al. Citation2017; Andrews and Jacobson Citation2018), and the Russell Glacier (Aciego, Stevenson, and Arendt Citation2015) and higher than the subglacial waters draining other glaciers in Greenland (Hagedorn and Hasholt Citation2004; Kristiansen et al. Citation2013; Aciego, Stevenson, and Arendt Citation2015). The only waters approaching the dissolved silica contents in the moraine porewaters and ponds are the sandur porewaters studied by Deuerling et al. (Citation2018), which show maximum dissolved silica contents (226 μmol/L) similar to the average values in the moraine porewaters. The high dissolved silica content in the moraine and sandur porewaters and in the moraine pond waters suggests enhanced chemical weathering of silicates in these systems with respect to the subglacial waters listed above, most probably promoted by the longer residence times and high mineral–water ratio. The high dissolved silica content of the moraine waters is in agreement with their also relatively high Na and K contents, which indicates effective silicate weathering processes in the moraine porewaters and ponds, even though it is frequently surpassed by the carbonate weathering processes.
PHREEQC (Parkhurst and Appelo Citation2013) calculations (with the WATEQ4F thermodynamic database distributed with the code) show that most of the moraine porewaters and ponds are oversaturated with respect to quartz and chalcedony and therefore aluminosilicate incongruent dissolution should be the main source of dissolved silica with only minor contribution from quartz dissolution in most of the waters.
No secondary clays (recently formed), as clear weathering aluminosilicate by-products, have been detected at our study site or in the subglacial and outwash sediments from the adjacent Isunnguata Sermia Glacier (which only contained trace levels of smectite; Graly, Humphrey, and Harper Citation2016; Andrews and Jacobson Citation2018). They have also not been found in the suspended loads of glacial rivers in the Kangerlussuaq area studied by Wimpenny et al. (Citation2010). Instead, the low contents of clay minerals in the till samples are dominated by chlorite and mixed-layer chlorite/illite, which are most probably of metamorphic origin (Hindshaw et al. Citation2014; Graly, Humphrey, and Harper Citation2016). An assessment of the silicate weathering process and the alteration products likely to be participating in the control of dissolved cations has been made through the use of stability diagrams (Langmuir Citation1997) considering key aluminosilicate minerals (Figure S1 in the supplemental material). The stability diagrams show that the moraine porewaters and ponds fall in the kaolinite field. This mineral is usually the first and most common alteration product of the incongruent dissolution of aluminosilicates (Garrels and MacKenzie Citation1967; Drever Citation1997; Langmuir Citation1997), and the stability diagrams support the writing of CASW and SASW reactions in terms of kaolinite in .
These diagrams also indicate that smectitic clay compositions are not stable for the moraine porewaters and ponds or for the majority of the sandur porewaters reported by Deuerling et al. (Citation2018). Therefore, secondary clay mineral formation, removing base cations from the waters, is not expected to occur and the analyzed cation contents represent the effect of the weathering reactions summarized in .
DOC and TOC contents
DOC contents in the moraine pond waters are similar to the range found in supraglacial streams and glacially fed lakes near the study area (Andrews et al. Citation2018; Burpee, Anderson, and Saros Citation2018) and in other ice lakes in the Kangerslussuaq area (Anderson and Stedmon Citation2007; Saros et al. Citation2015; Northington and Saros Citation2016; Osburn et al. Citation2017; Fowler, Saros, and Osburn Citation2018). Apparently, they are high enough to sustain aerobic microbiological (heterotrophic) activities (Andrews et al. Citation2018). DOC concentrations in the moraine porewaters are higher than those in the moraine ponds and they are at the levels found in the aforementioned lakes. However, they are clearly higher than the DOC contents in the subglacial waters from Isunnguata and Leverett Glaciers close to our study area (Lawson et al. Citation2014; Andrews et al. Citation2018) or those from N and M glaciers (~100 km north of the Kangerslussuaq area) reported in Bhatia et al. (Citation2010, Citation2013).
DOC and TOC contents are also apparently correlated with the ionic strength of the moraine porewaters and ponds (R = 0.94 and 0.96, respectively). This suggests a control by evaporative concentration affecting these waters, in agreement with the results by Anderson and Stedmon (Citation2007) in the lakes from the Kangerlussuaq area where evapoconcentration is one on the main controls of DOC levels. The ultimate origin of TOC and DOC is discussed below in connection with the carbon isotope data.
Tritium and carbon isotopes
Tritium is produced in the atmosphere by cosmic ray spallation of nitrogen and decays with a half-life of ~12.3 years. Because of this, tritium values may be used to estimate the age or origin of water samples. The samples from the small nonglacial lake L25 contain 7 to 9 TU, and these values may be used as the reference for contemporary waters. The moraine ponds are either free of tritium or they have values lower than 3.2 TU (Table S9), indicating a mixed contribution from less than about 30 percent of modern precipitation, with the remainder meltwater (free of tritium). The only available porewater value (PW0116 with 3.2 TU) would suggest a similar situation.
Carbon isotopes provide information on the possible origins of inorganic and organic carbon. 14C is produced in the atmosphere by a cosmic ray reaction with nitrogen, and it decays with a half-life of ~5,730 years. The two moraine ponds sampled for carbon isotope analyses were quite different; MP15 was small and shallow (about 1 m in diameter) in an elevated part of the moraine with no signs of terrestrial plant growth, whereas MP09 was larger (of irregular shape, about 20 m in its longest shore-to-shore distance) with many quite small shrubs (up to about 10 cm high) growing on its shores (see photographs in the supplemental material). The setting of the ponds suggests that MP09 is older than MP15.
Organic carbon
The values for δ13Corg measured in the moraine ponds and lakes (from −23.2 per mill to −28 per mill; Table S9) are inside the range reported by Osburn et al. (Citation2017) for lakes near the ice sheet in the Kangerlussuaq area and for the supraglacial waters studied by Andrews et al. (Citation2018) near our study area. These values are consistent with a derivation from terrestrial (e.g., C3 plants) dissolved organic matter, with typical δ13Corg values between −25 per mill and −29 per mill (Osburn et al. [Citation2017] and references therein). This is not surprising for L25 because it is a lake about 100 m long with plenty of aquatic plants and vegetation covering the shores (see photographs in the supplemental material).
With respect to the 14C in the TOC, sample STIT (collected from a subglacial stream directly as it emerged) has a value of 70.5 pMC, indicating a substantial modern contribution that can be explained in two different ways. One possibility is that the TOC is recent and originates from the growth of microbial algae and cyanobacteria on the glacier surface (Uetake et al. Citation2010; Anesio et al. Citation2017). Then, the generated organic carbon finds its way from the surface to the subglacial aquifer through moulins and is mixed with material contained in the ice during a long time (free of 14C). The second possibility is that the TOC comes from the time when the area was ice free and covered by vegetation from approximately 6000 B.P. until the readvance of the ice sheet that culminated during the Little Ice Age (approximately 1450 to 1850 A.D.; see Ruskeeniemi et al. [Citation2018] and references therein). The δ13C and δ14C data for the L38 samples indicate a similar source of TOC, although this lake also receives input from groundwater seepages and from a small side stream.
The 14C data for the small MP15 pond show slightly older TOC (78.3 pMC) and DIC (83.0 pMC) compared to the larger MP09 pond (82.4 and 89.4 pMC, respectively). The origin of the TOC in both cases appears to be C3 plants, because the δ13Corg values are close to those found for L25. The clear evidence of a large contribution of Holocene C3 plants to the TOC of both ponds is somewhat unexpected, especially when considering the abiotic appearance of MP15 (see photograph in the supplemental material). This may be explained by a TOC contribution from the till assumed to contain reworked material from the vegetated ground included during the readvance of the ice. Some contribution from recent microbial activity is also possible.
Inorganic carbon
Overall, the range of values for δ13Cinorg is quite wide (−3.7 per mill to −14 per mill; see Table S9), although similar variations were found by Leng and Anderson (Citation2003) in lakes near the glaciers Isunnguata Sermia, Russell, and Leverett at about 25 km from the moraine studied here. Several processes are involved in the control of δ13Cinorg (see Campeau et al. [Citation2017] and references therein). If the origin of the DIC is the CO2 embedded in the ice, then the expected δ13Cinorg is about −6.5 per mill. However, if the origin is the CO2 in equilibrium with the air at temperatures about 0°C to 10°C (δ13C about −8.5 per mill), its δ13Cinorg should be around +0.5 per mill at pH 7 and around +3 per mill at pH 8 to 8.5. Because organic carbon from C3 plant has a lower δ13Corg, around −27 per mill, DIC from such TOC mineralization will have δ13Cinorg between −27 per mill and −14 per mill depending on many site-specific factors (Gillon et al. Citation2012; Polsenaere and Abril Citation2012). Dissolution of calcite may also participate in the control of the δ13Cinorg values.
The δ13Cinorg values for the lake L25 are around −4 per mill, indicating exchange with air and some contribution from TOC mineralization. The pMC of the DIC for those samples is higher than that of the TOC, indicating that the equilibrium with air is faster than the turnover of organic matter.
For the ice tunnel stream (STIT) the alkalinity was too low for a δ13Cinorg determination, and the L38 waters have so low alkalinity that contamination by air during sampling is a strong possibility. Nevertheless, the δ13Cinorg value for L38, around −11 per mill, could be interpreted as a mixture of (1) DIC sources, including ice meltwater with “dead” CO2; (2) modern air CO2; and (3) a large contribution from TOC degradation of unknown age.
The origin of the DIC in the two moraine ponds seems to be different, considering their δ13Cinorg values (Table S9). The larger and older MP09 has δ13Cinorg of around −5 per mill, close to the value for L25—that is, between equilibrium with air and TOC degradation—and the pMC indicates that about half of the DIC is of modern origin, suggesting a complex mixture of sources. For the small, and presumably more recent, MP15, the δ13Cinorg is much lower, −14 per mill, indicating a larger contribution from TOC degradation, which is in agreement with the 14C data of TOC and DIC for this pond. The correspondence between the pMC in inorganic and organic carbon in the two moraine ponds underlines the close connection between the organic and inorganic system and suggests that a nonnegligible proportion of the inorganic carbon in the moraine pond waters may originate in heterotrophic microbial activity, representing an additional source of CO2 for weathering reactions.
Partial pressure of CO2
Average values of CO2 partial pressure (calculated with PHREEQC as log pCO2) in the moraine porewaters and ponds are −2.36 ± 0.51 and −2.97 ± 0.30, respectively, whereas in the studied streams and lakes this value is lower (−3.33 ± 0.52).
Some of the moraine porewaters show very high log pCO2 compared with the values found in the subglacial waters at the Isunnguata Sermia, Leverett, and Russell Glaciers (calculated from the data provided in Graly et al. Citation2014; Hindshaw et al. Citation2014; Aciego, Stevenson, and Arendt Citation2015; Andrews and Jacobson Citation2018) and at other glaciers in Greenland (Aciego, Stevenson, and Arendt Citation2015). They are also higher than the values found in the sandur porewaters studied by Deuerling et al. (Citation2018) and in the Watson River and some lakes in the Kangerlussuaq area (data from Ryu and Jacobson Citation2012; Hindshaw et al. Citation2014; Deuerling et al. Citation2018; Henkemans et al. Citation2018).
These high pCO2 values in the moraine porewaters clearly exceed the atmospheric partial pressure. That indicates an ongoing CO2 production able to compensate for the consumption associated with the active weathering reactions (involving carbonate and silicate minerals, CACW and CASW reactions; ) and maintain the disequilibrium with the atmospheric pCO2.
These high pCO2 values may originate from either sulfuric acid carbonate weathering or from microbial mineralization of organic matter (Ryu and Jacobson Citation2012; Graly, Drever, and Humphrey Citation2017; Deuerling et al. Citation2018). Evidence for ongoing SACW reactions () has been discussed above in connection with (scatterplots of Ca vs. SO42−), and it is also supported by the SEM observations () and the sulfate isotope data (; δ18OSO4 vs. δ18OH2O). On the other hand, the available δ13C and δ14C analyses of the DIC for two moraine ponds (Tritium and Carbon Isotopes section) also provide strong support for the mineralization of organic matter as a source of CO2. Although quantitative proportions for the two possible mechanisms for CO2 production may not be concluded from this study, it is clear that moraine waters may represent a CO2 source that has so far remained underestimated.
Conclusions
This study presents an analysis of the chemical weathering processes in a debris-rich ice-marginal environment, which is denoted as “moraine” throughout the article, and how they link with the chemistry of glacial rivers and proglacial lakes. The following conclusions were reached:
Solute concentrations in the moraine waters studied here have been found to be higher than those in the subglacial waters sampled in Greenland and higher than those found in the Watson River and in other glacial lakes and rivers draining the Kangerlussuaq area. This is due to (1) the presence of fresh mineral surfaces in the till, (2) large rock–water ratios, (3) the arid conditions of the site, and (4) a semiclosed system due to permafrost, with long residence times for the waters, allowing the recycling of secondary salts.
Chemical weathering in the studied moraine porewaters and ponds has been found to be controlled by an uneven balance between sulfuric acid (produced by pyrite oxidation) and carbonic acid weathering. The HCO3−/SO42− molar ratios are widely variable (from 0.27 to 4.36). The low values suggest a dominance of sulfuric acid weathering, although they could be influenced by secondary gypsum dissolution. The high values would clearly indicate a local prevalence of CO2 weathering processes.
The effects of carbonate and silicate mineral weathering have been found to have uneven intensities in the studied moraine. Carbonate (calcite) weathering, either with carbonic or sulfuric acids, is found to be important. However, there are other samples whose values suggest that silicate weathering is also important, which is not surprising considering that the till consists of silicates to around 100 percent.
Carbon isotope data (δ13C, δ14C) indicate a C3 plant origin for the organic carbon in the moraine waters, and the data also suggest a contribution of organic matter mineralization to the dissolved inorganic carbon. It is possible that the organic carbon originates from the warm period when the area was uncovered by the ice (from around 6000 B.P.) and that it was incorporated into the moraine during the readvance of the ice sheet that culminated during the Little Ice Age.
The moraine porewaters studied here have pCO2 values higher than the atmosphere, and they are higher than all of the other glacial waters in the Kangerlussuaq area. These high pCO2 values may originate from both sulfuric acid carbonate weathering and microbial oxidation of organic matter, and they are not fully counterbalanced by weathering reactions able to fix CO2, namely, carbonic acid carbonate and silicate weathering reactions. Therefore, this type of waters may represent a previously underestimated CO2 source.
Supplemental Material
Download Zip (7.6 MB)Acknowledgments
The authors thank the Greenland Analogue Project (GAP), cofinanced by Posiva, SKB, and the Nuclear Waste Management Organization, and the project leaders Lillemor Claesson Liljedahl (SKB) and Anne Kontula (Posiva). The authors are thankful to the Kangerlussuaq International Science Support (KISS) for providing logistical support and to Ann-Sofie Karlsson and her colleagues at the Äspö Hard Rock Laboratory for support with handling of samples and chemical analyses. The following persons are thanked for their assistance in the field: Lillemor Claesson Liljedahl, Jens-Ove Näslund, and Lars Andersson (all at SKB); Jan Sundberg (Geosigma AB, Sweden); and Anne Kontula and Tiina Lamminmäki (both at Posiva). Cecilia Berg, Emma Johansson, Tobias Lindborg (all at SKB), and David Engdahl (Geosigma AB, Sweden) are thanked for assistance with the field equipment.
Disclosure statement
This research was sponsored by the Swedish Nuclear Fuel and Waste Management Co. (SKB), a company in charge of the safe disposal of the Swedish spent nuclear fuel in deep repositories and of the analysis of the long-term safety (more than 100,000 years) of such disposal concepts. It is in SKB’s interest to prove that their deep repository concept will remain safe under the conditions imposed by an ice sheet advancement and retreat.
Supplementary material
Supplemental data for this article can be accessed publisher’s website.
Additional information
Funding
Related Research Data
References
- Aciego, S. M., E. I. Stevenson, and C. A. Arendt. 2015. Climate versus geological controls on glacial meltwater micronutrient production in southern Greenland. Earth and Planetary Science Letters 424:51–58. doi:10.1016/j.epsl.2015.05.017.
- Anderson, N. J., R. Harriman, D. B. Ryves, and S. T. Patrick. 2001. Dominant factors controlling variability in the ionic composition of west Greenland lakes. Arctic, Antarctic, and Alpine Research 33:418–25. doi:10.2307/1552551.
- Anderson, N. J., and C. A. Stedmon. 2007. The effect of evapoconcentration on dissolved organic carbon concentration and quality in lakes of SW Greenland. Freshwater Biology 52:280–89. doi:10.1111/j.1365-2427.2006.01688.x.
- Anderson, S. P., J. I. Drever, C. D. Frost, and P. Holden. 2000. Chemical weathering in the foreland of a retreating glacier. Geochimica et Cosmochimica Acta 64:1173–89. doi:10.1016/S0016-7037(99)00358-0.
- Andrews, M. G., and A. D. Jacobson. 2018. Controls on the solute geochemistry of subglacial discharge from the Russell Glacier, Greenland Ice Sheet determined by radiogenic and stable Sr isotope ratios. Geochimica et Cosmochimica Acta 239:312–29. doi:10.1016/j.gca.2018.08.004.
- Andrews, M. G., A. D. Jacobson, M. R. Osburn, and T. M. Flynn. 2018. Dissolved carbon dynamics in meltwaters from the Russell Glacier, Greenland Ice Sheet. Journal of Geophysical Research: Biogeosciences. doi:10.1029/2018JG004458.
- Anesio, A. M., S. Lutz, N. A. M. Chrismas, and L. G. Benning. 2017. The microbiome of glaciers and ice sheets. NPJ Biofilms and Microbiomes 3:10. doi:10.1038/s41522-017-0019-0.
- Ansari, A. H. 2016. Stable isotopic evidence for anaerobic maintained sulphate discharge in a polythermal glacier. Polar Science 10:24–35. doi:10.1016/j.polar.2016.01.001.
- Arvidson, R. S., I. E. Ertan, J. E. Amonette, and A. Luttge. 2003. Variation in calcite dissolution rates: A fundamental problem? Geochimica et Cosmochimica Acta 67:1623–34. doi:10.1016/S0016-7037(02)01177-8.
- Bhatia, M. P., S. B. Das, K. Longnecker, M. A. Charette, and E. B. Kujawinski. 2010. Molecular characterization of dissolved organic matter associated with the Greenland Ice Sheet. Geochimica et Cosmochimica Acta 74:3768–84. doi:10.1016/j.gca.2010.03.035.
- Bhatia, M. P., S. B. Das, L. Xu, M. A. Charette, J. L. Wadham, and E. B. Kujawinski. 2013. Organic carbon export from the Greenland Ice Sheet. Geochimica et Cosmochimica Acta 109:329–44. doi:10.1016/j.gca.2013.02.006.
- Bisson, K. M., K. A. Welch, S. A. Welch, J. M. Sheets, W. B. Lyons, J. S. Levy, and A. G. Fountain. 2015. Patterns and processes of salt efflorescences in the McMurdo Region, Antarctica. Arctic, Antarctic, and Alpine Research 47:407–25. doi:10.1657/AAAR0014-024.
- Bottrell, S. H., and M. Tranter. 2002. Sulphide oxidation under partially anoxic conditions at the bed of the Haut Glacier d’Arolla, Switzerland. Hydrological Processes 16:2363–68. doi:10.1002/(ISSN)1099-1085.
- Bray, A. W., E. H. Oelkers, S. Bonneville, D. Wolff-Boenisch, N. J. Potts, G. Fones, and L. G. Benning. 2015. The effect of pH, grain size, and organic ligands on biotite weathering rates. Geochimica et Cosmochimica Acta 164:127–45. doi:10.1016/j.gca.2015.04.048.
- Brown, G. H., M. Tranter, and M. J. Sharp. 1996. Experimental investigations of the weathering of suspended sediment by alpine glacial meltwater. Hydrological Processes 10:579–97. doi:10.1002/(ISSN)1099-1085.
- Burpee, B. T., D. Anderson, and J. E. Saros. 2018. Assessing ecological effects of glacial meltwater on lakes fed by the Greenland Ice Sheet: The role of nutrient subsidies and turbidity. Arctic, Antarctic, and Alpine Research 50 (1):S100019. doi:10.1080/15230430.2017.1420953.
- Campeau, A., M. B. Wallin, R. Giesler, S. Löfgren, C.-M. Mörth, S. Schiff, J. J. Venkiteswaran, and K. Bishop. 2017. Multiple sources and sinks of dissolved inorganic carbon across Swedish streams, refocusing the lens of stable C isotopes. Scientific Reports 7:9158. doi:10.1038/s41598-017-09049-9.
- Cappelen, J. (Ed.). 2014. Weather observations from Greenland 1958-2013 - observation data with description. DMI Technical Report 14-08, Danish Metereological Institute, Copenhagen, Denmark. https://www.dmi.dk/publikationer/.
- Cappelen, J. (Ed.). 2016. Weather observations from Greenland 1958-2015 - observation data with description. DMI Report 16-08, Danish Metereological Institute, Copenhagen, Denmark. https://www.dmi.dk/publikationer/.
- Carrivick, J. L., J. C. Yde, N. T. Knudsen, and C. Kronborg. 2018. Ice-dammed lake and ice-margin evolution during the Holocene in the Kangerlussuaq Area of West Greenland. Arctic, Antarctic, and Alpine Research 50:S100005. doi:10.1080/15230430.2017.1420854.
- Chandra, A. P., and A. R. Gerson. 2011. Pyrite (FeS2) oxidation: A sub-micron synchrotron investigation of the initial steps. Geochimica et Cosmochimica Acta 75 (20):6239–54. doi:10.1016/j.gca.2011.08.005.
- Claesson Liljedahl, L., A. Kontula, J. Harper, J.-O. Näslund, J.-O. Selroos, P. Pitkänen, I. Puigdomenech, Hobbs, M. Follin, S. Hirschorn, et al. 2016. The Greenland analogue project: Final report. SKB-TR-14-13, Swedish Nuclear Fuel and Waste Management Co, Stockholm, Sweden. www.skb.com/publications/.
- Colombani, J. 2008. Measurement of the pure dissolution rate constant of a mineral in water. Geochimica et Cosmochimica Acta 72:5634–40. doi:10.1016/j.gca.2008.09.007.
- Cooper, R. J., J. L. Wadham, M. Tranter, R. Hodgkins, and N. E. Peters. 2002. Groundwater hydrochemistry in the active layer of the proglacial zone, Finsterwalderbreen, Svalbard. Journal of Hydrology 269:208–23. doi:10.1016/S0022-1694(02)00279-2.
- Deuerling, K. M., J. B. Martin, E. E. Martin, J. Abermann, S. M. Myreng, D. Petersen, and Å. K. Rennermalm. 2019. Chemical weathering across the western foreland of the Greenland Ice Sheet. Geochimica et Cosmochimica Acta 245:426–40. doi:10.1016/j.gca.2018.11.025.
- Deuerling, K. M., J. B. Martin, E. E. Martin, and C. A. Scribner. 2018. Hydrologic exchange and chemical weathering in a proglacial watershed near Kangerlussuaq, West Greenland. Journal of Hydrology 556:220–32. doi:10.1016/j.jhydrol.2017.11.002.
- Drake, H., J. Suksi, E.-L. Tullborg, and Y. Lahaye. 2017. Quaternary redox transitions in deep crystalline rock fractures at the western margin of the Greenland Ice Sheet. Applied Geochemistry 76:196–209. doi:10.1016/j.apgeochem.2016.12.001.
- Drever, J. I. 1997. The geochemistry of natural waters. 3rd ed. Upper Saddle River, NJ: Prentice Hall, Inc.
- Eichinger, F., and H. N. Waber. 2013. Matrix porewater in crystalline rocks: Extraction and analysis. NWMO TR-2013-23, Nuclear Waste Management Organization, Toronto, Ontario.
- Faure, G. 1991. Principles and applications of inorganic geochemistry: A comprehensive textbook for geology students. New Jersey: Prentice-Hall, Inc.
- Föllmi, K. B., K. Arn, R. Hosein, T. Adatte, and P. Steinmann. 2009. Biogeochemical weathering in sedimentary chronosequences of the Rhône and Oberaar Glaciers (Swiss Alps): Rates and mechanisms of biotite weathering. Geoderma 151:270–81. doi:10.1016/j.geoderma.2009.04.012.
- Forman, S. L., L. Marín, C. Van Der Veen, C. Tremper, and B. Csatho. 2007. Little Ice Age and neoglacial landforms at the Inland Ice margin, Isunguata Sermia, Kangerlussuaq, west Greenland. Boreas 36:341–51. doi:10.1080/00173130601173301.
- Fowler, R. A., J. E. Saros, and C. L. Osburn. 2018. Shifting DOC concentration and quality in the freshwater lakes of the Kangerlussuaq region: An experimental assessment of possible mechanisms. Arctic, Antarctic, and Alpine Research 50 (1):S100013. doi:10.1080/15230430.2018.1436815.
- Garrels, R. M., and F. T. MacKenzie. 1967. Origin of the chemical compositions of some springs and lakes. In Equilibrium concepts in natural water systems, ed. W. Stumm, Vol. 67, 222–42. Advances in chemistry series. Washington, D.C.: American Chemical Society. doi:10.1021/ba-1967-0067.ch010.
- Gillon, M., F. Barbecot, E. Gibert, C. Plain, J.-A. Corcho-Alvarado, and M. Massault. 2012. Controls on 13C and 14C variability in soil CO2. Geoderma 189–190:431–41. doi:10.1016/j.geoderma.2012.06.004.
- Graly, J. A., J. I. Drever, and N. F. Humphrey. 2017. Calculating the balance between atmospheric CO2 drawdown and organic carbon oxidation in subglacial hydrochemical systems: Carbon balance in subglacial systems. Global Biogeochemical Cycles 31:709–27. doi:10.1002/2016GB005425.
- Graly, J. A., N. F. Humphrey, and J. T. Harper. 2016. Chemical depletion of sediment under the Greenland Ice Sheet. Earth Surface Processes and Landforms 41:1922–36. doi:10.1002/esp.3960.
- Graly, J. A., N. F. Humphrey, C. M. Landowski, and J. T. Harper. 2014. Chemical weathering under the Greenland Ice sheet. Geology 42:551–54. doi:10.1130/G35370.1.
- Hagedorn, B., and B. Hasholt. 2004. Hydrology, geochemistry and Sr Isotopes in solids and solutes of the meltwater from Mittivakkat Gletscher, SE Greenland. Hydrology Research 35:369–80. doi:10.2166/nh.2004.0028.
- Harper, J., A. Hubbard, T. Ruskeeniemi, L. Claesson Liljedahl, A. Kontula, M. Hobbs, J. Brown, A. Dirkson, C. Dow, S. Doyle, et al. 2016. The Greenland Analogue Project: Data and processes. SKB R-14-13, Swedish Nuclear Fuel and Waste Management Co., Stockholm, Sweden. www.skb.com/publications/.
- Hawkings, J. R., J. L. Wadham, L. G. Benning, K. R. Hendry, M. Tranter, A. Tedstone, P. Nienow, and R. Raiswell. 2017. Ice sheets as a missing source of silica to the polar oceans. Nature Communications 8:14198. doi:10.1038/ncomms14198.
- Hawkings, J. R., J. L. Wadham, M. Tranter, E. Lawson, A. Sole, T. Cowton, A. J. Tedstone, I. Bartholomew, P. Nienow, D. Chandler, et al. 2015. The effect of warming climate on nutrient and solute export from the Greenland Ice Sheet. Geochemical Perspectives Letters 1:94–104. doi:10.7185/geochemlet.1510.
- Hawkings, J. R., J. L. Wadham, M. Tranter, R. Raiswell, L. G. Benning, P. J. Statham, A. Tedstone, P. Nienow, K. Lee, and J. Telling. 2014. Ice sheets as a significant source of highly reactive nanoparticulate iron to the oceans. Nature Communications 5 (1–8):3929. doi:10.1038/ncomms4929.
- Henkemans, E. 2016. Geochemical characterization of groundwaters, surface waters and water-rock interaction in an area of continuous permafrost adjacent to the Greenland Ice Sheet, Kangerlussuaq, Southwest Greenland. Waterloo, Ontario: University of Waterloo. https://uwspace.uwaterloo.ca/handle/10012/10193.
- Henkemans, E., S. K. Frape, T. Ruskeeniemi, N. J. Anderson, and M. Hobbs. 2018. A landscape isotopic approach to the geochemical characterization of lakes in the Kangerlussuaq Region, West Greenland. Arctic, Antarctic, and Alpine Research 50 (1):S100018. doi:10.1080/15230430.2017.1420863.
- Henriksen, N., A. K. Higgins, F. Kalsbeek, and T. C. R. Pulvertaft. 2009. Greenland from Archaean to Quaternary. Descriptive text to the 1995 geological map of Greenland 1:2 500 000. 2nd ed. Copenhagen, Denmark: Geological Survey of Denmark and Greenland Bulletin 18.
- Hindshaw, R. S., T. H. E. Heaton, E. S. Boyd, M. R. Lindsay, and E. T. Tipper. 2016. Influence of glaciation on mechanisms of mineral weathering in two high Arctic catchments. Chemical Geology 420:37–50. doi:10.1016/j.chemgeo.2015.11.004.
- Hindshaw, R. S., J. Rickli, J. Leuthold, J. Wadham, and B. Bourdon. 2014. Identifying weathering sources and processes in an outlet glacier of the Greenland Ice Sheet using Ca and Sr isotope ratios. Geochimica et Cosmochimica Acta 145:50–71. doi:10.1016/j.gca.2014.09.016.
- Hodgkins, R., M. Tranter, and J. A. Dowdeswell. 1998. The hydrochemistry of runoff from a 'cold-based' glacier in the high arctic (Scott Turnerbreen, Svalbard). Hydrological Processes 12:87–103. doi:10.1002/(SICI)1099-1085(199801)12:1<87::AID-HYP565>3.0.CO;2-C.
- Jacobson, A. D., J. D. Blum, P. Chamberlain, M. A. Poage, and V. F. Sloan. 2002. Ca/Sr and Sr isotope systematics of a Himalayan glacial chronosequence: Carbonate versus silicate weathering rates as a function of landscape surface age. Geochimica et Cosmochimica Acta 66:13–27. doi:10.1016/S0016-7037(01)00755-4.
- Johansson, E., S. Berglund, T. Lindborg, J. Petrone, D. van As, L.-G. Gustafsson, J.-O. Näslund, and H. Laudon. 2015. Hydrological and meteorological investigations in a periglacial lake catchment near Kangerlussuaq, West Greenland - presentation of a new multi-parameter data set. Earth System Science Data 7:93–108. doi:10.5194/essd-7-93-2015.
- Kristiansen, S. M., J. C. Yde, T. Gómez Bárcena, B. H. Jakobsen, J. Olsen, and N. T. Knudsen. 2013. Geochemistry of groundwater in front of a warm-based glacier in southeast Greenland. Geografiska Annaler: Series A, Physical Geography 95:97–108. doi:10.1111/geoa.12003.
- Langmuir, D. 1997. Aqueous environmental geochemistry. Upper Saddle River, New Jersey: Prentice-Hall, Inc.
- Lawson, E. C., J. L. Wadham, M. Tranter, M. Stibal, G. P. Lis, C. E. H. Butler, J. Laybourn-Parry, P. Nienow, D. Chandler, and P. Dewsbury. 2014. Greenland Ice Sheet exports labile organic carbon to the Arctic oceans. Biogeosciences 11:4015–28. doi:10.5194/bg-11-4015-2014.
- Lehn, G. O., A. D. Jacobson, T. A. Douglas, J. W. McClelland, A. J. Barker, and M. S. Khosh. 2017. Constraining seasonal active layer dynamics and chemical weathering reactions occurring in North Slope Alaskan watersheds with major ion and isotope (δ34SSO4, δ13CDIC, 87Sr/86Sr, δ44/40Ca, and δ44/42Ca) measurements. Geochimica et Cosmochimica Acta 217:399–420. doi:10.1016/j.gca.2017.07.042.
- Leng, M. J., and N. J. Anderson. 2003. Isotopic variation in modern lake waters from western Greenland. The Holocene 13:605–11. doi:10.1191/0959683603hl620rr.
- Levy, L. B., M. A. Kelly, P. A. Applegate, J. A. Howley, and R. A. Virginia. 2018. Middle to late Holocene chronology of the western margin of the Greenland Ice Sheet: A comparison with Holocene temperature and precipitation records. Arctic, Antarctic, and Alpine Research 50:S100004. doi:10.1080/15230430.2017.1414477.
- Lindborg, T., J. Rydberg, M. Tröjbom, S. Berglund, E. Johansson, A. Löfgren, P. Saetre, S. Nordén, G. Sohlenius, E. Andersson, et al. 2016. Biogeochemical data from terrestrial and aquatic ecosystems in a periglacial catchment, West Greenland. Earth System Science Data 8:439–59. doi:10.5194/essd-8-439-2016.
- Linhoff, B. S. 2016. Seasonal and interannual variability in the hydrology and geochemistry of an outlet glacier of the Greenland Ice Sheet. Cambridge: Massachusetts Institute of Technology. http://hdl.handle.net/1721.1/103256.
- Marty, N. C. M., F. Claret, A. Lassin, J. Tremosa, P. Blanc, B. Madé, E. Giffaut, B. Cochepin, and C. Tournassat. 2015. A database of dissolution and precipitation rates for clay-rocks minerals. Applied Geochemistry 55:108–18. doi:10.1016/j.apgeochem.2014.10.012.
- McNutt, R. H. 2000. Strontium Isotopes. In Environmental tracers in subsurface hydrology, ed. P. G. Cook and A. L. Herczeg, 233–260. Boston: Kluwer Academic Publishers.
- Northington, R. M., and J. E. Saros. 2016. Factors controlling methane in Arctic lakes of southwest Greenland. PLoS One 11 (7):e0159642. doi:10.1371/journal.pone.0159642.
- Osburn, C. L., N. J. Anderson, C. A. Stedmon, M. E. Giles, E. J. Whiteford, T. J. McGenity, A. J. Dumbrell, and G. J. C. Underwood. 2017. Shifts in the source and composition of dissolved organic matter in Southwest Greenland lakes along a regional hydro-climatic gradient. Journal of Geophysical Research: Biogeosciences 122:3431–45. doi:10.1002/2017JG003999.
- Palandri, J. L., and Y. K. Kharaka. 2004. A compilation of rate parameters of water-mineral interaction kinetics for application to geochemical modeling. USGS Open File Report 2004-1068, U.S. Geological Survey, Menlo Park, California.
- Parkhurst, D. L., and C. A. J. Appelo. 2013. Description of input and examples for PHREEQC version 3 - A computer program for speciation, batch-reaction, one-dimensional transport, and inverse geochemical calculations. U.S. Geological Survey Techniques and Methods, Book 6, Chap. A43, 497, U.S. Geological Survey, Denver, Colorado. http://pubs.usgs.gov/tm/06/a43.
- Polsenaere, P., and G. Abril. 2012. Modelling CO2 degassing from small acidic rivers using water PCO2, DIC and δ13C-DIC data. Geochimica et Cosmochimica Acta 91:220–39. doi:10.1016/j.gca.2012.05.030.
- Refsnider, K. A., G. H. Miller, M. L. Fogel, B. Fréchette, R. Bowden, J. T. Andrews, and G. L. Farmer. 2014. Subglacially precipitated carbonates record geochemical interactions and pollen preservation at the base of the Laurentide Ice Sheet on central Baffin Island, Eastern Canadian Arctic. Quaternary Research 81:94–105. doi:10.1016/j.yqres.2013.10.014.
- Rickli, J., R. S. Hindshaw, J. Leuthold, J. L. Wadham, K. W. Burton, and D. Vance. 2017. Impact of glacial activity on the weathering of Hf Isotopes - observations from Southwest Greenland. Geochimica et Cosmochimica Acta 215:295–316. doi:10.1016/j.gca.2017.08.005.
- Robinson, Z. P., I. J. Fairchild, and B. Spiro. 2009. The sulphur isotope and hydrochemical characteristics of Skeiðarársandur, Iceland: Identification of solute sources and implications for weathering processes. Hydrological Processes 23:2212–24. doi:10.1002/hyp.7368.
- Ruskeeniemi, T., J. Engström, J. Lehtimäki, H. Vanhala, K. Korhonen, A. Kontula, L. Claesson Liljedahl, J.-O. Näslund, and R. Pettersson. 2018. Subglacial permafrost evidencing re-advance of the Greenland Ice Sheet over frozen ground. Quaternary Science Reviews 199:174–87. doi:10.1016/j.quascirev.2018.09.002.
- Rydberg, J., T. Lindborg, G. Sohlenius, N. Reuss, J. Olsen, and H. Laudon. 2016. The importance of eolian input on lake-sediment geochemical composition in the dry proglacial landscape of western Greenland. Arctic, Antarctic, and Alpine Research 48:93–109. doi:10.1657/AAAR0015-009.
- Ryu, J.-S., and A. D. Jacobson. 2012. CO2 evasion from the Greenland Ice Sheet: A new carbon-climate feedback. Chemical Geology 320–321:80–95. doi:10.1016/j.chemgeo.2012.05.024.
- Saros, J. E., C. L. Osburn, R. M. Northington, S. D. Birkel, J. D. Auger, C. A. Stedmon, and N. J. Anderson. 2015. Recent decrease in DOC concentrations in Arctic lakes of southwest Greenland. Geophysical Research Letters 42:6703–09. doi:10.1002/2015GL065075.
- Scholz, H., and M. Baumann. 1997. An ‘open system pingo’ near Kangerlussuaq (Søndre Strømfjord), West Greenland. Geology of Greenland Survey Bull 176:104–08.
- Scribner, C. A., E. E. Martin, J. B. Martin, K. M. Deuerling, D. F. Collazo, and A. T. Marshall. 2015. Exposure age and climate controls on weathering in deglaciated watersheds of western Greenland. Geochimica et Cosmochimica Acta 170:157–72. doi:10.1016/j.gca.2015.08.008.
- Skidmore, M., M. Tranter, S. Tulaczyk, and B. Lanoil. 2010. Hydrochemistry of ice stream beds - Evaporitic or microbial effects? Hydrological Processes 24:517–23.
- Stevenson, E. I., M. S. Fantle, S. B. Das, H. M. Williams, and S. M. Aciego. 2017. The iron isotopic composition of subglacial streams draining the Greenland Ice Sheet. Geochimica et Cosmochimica Acta 213:237–54. doi:10.1016/j.gca.2017.06.002.
- Szynkiewicz, A., M. Modelska, S. Buczyński, D. M. Borrok, and J. P. Merrison. 2013. The polar sulfur cycle in the Werenskioldbreen, Spitsbergen: Possible implications for understanding the deposition of sulfate minerals in the North Polar Region of Mars. Geochimica et Cosmochimica Acta 106:326–43. doi:10.1016/j.gca.2012.12.041.
- Torres, M. A., N. Moosdorf, J. Hartmann, J. F. Adkins, and A. J. West. 2017. Glacial weathering, sulfide oxidation, and global carbon cycle feedbacks. Proceedings of the National Academy of Sciences 114:8716–21. doi:10.1073/pnas.1702953114.
- Tranter, M., M. J. Sharp, H. R. Lamb, G. H. Brown, B. P. Hubbard, and I. C. Willis. 2002. Geochemical weathering at the bed of Haut Glacier d’Arolla, Switzerland - a new model. Hydrological Processes 16:959–93. doi:10.1002/hyp.309.
- Tranter, M., and J. L. Wadham. 2014. Geochemical weathering in glacial and proglacial environments. In Treatise on geochemistry, Vol. 7, 2nd ed., 157–73. Oxford, UK: Elsevier. doi:10.1016/B978-0-08-095975-7.00505-2.
- Uetake, J., T. Naganuma, M. B. Hebsgaard, H. Kanda, and S. Kohshima. 2010. Communities of algae and cyanobacteria on glaciers in West Greenland. Polar Science 4:71–80. doi:10.1016/j.polar.2010.03.002.
- Usher, C. R., C. A. Cleveland, D. R. Strongin, and M. A. Schoonen. 2004. Origin of oxygen in sulfate during pyrite oxidation with water and dissolved oxygen: An in situ horizontal attenuated total reflectance infrared spectroscopy isotope study. Environmental Science & Technology 38:5604–06. doi:10.1021/es0494003.
- Usher, C. R., K. W. Paul, J. Narayansamy, J. D. Kubicki, D. L. Sparks, M. A. A. Schoonen, and D. R. Strongin. 2005. Mechanistic aspects of pyrite oxidation in an oxidizing gaseous environment: An in situ HATR−IR isotope study. Environmental Science & Technology 39:7576–84. doi:10.1021/es0506657.
- Van Gool, J. A. M., J. N. Connelly, M. Marker, and F. C. Mengel. 2002. The Nagssugtoqidian Orogen of West Greenland: Tectonic evolution and regional correlations from a West Greenland perspective. Canadian Journal of Earth Sciences 39:665–86. doi:10.1139/e02-027.
- Van Stempvoort, D. R., and H. R. Krouse. 1993. Controls of δ18O in sulfate. Review of experimental data and application to specific environments. In Environmental geochemistry of sulfide oxidation, ed. C. N. Alpers and D. W. Blowes, Vol. 550, 446–80. Washington, DC: American Chemical Society, ACS Symposium Series.
- Van Tatenhove, F. G. M., J. J. M. van der Meer, and E. A. Koster. 1996. Implications for deglaciation chronology from new AMS age determinations in central West Greenland. Quaternary Research 45:245–53. doi:10.1006/qres.1996.0025.
- Wadham, J. L., R. J. Cooper, M. Tranter, and S. Bottrell. 2007. Evidence for widespread anoxia in the proglacial zone of an Arctic glacier. Chemical Geology 243:1–15. doi:10.1016/j.chemgeo.2007.04.010.
- Wadham, J. L., M. Tranter, A. J. Hodson, R. Hodgkins, S. Bottrell, R. Cooper, and R. Raiswell. 2010. Hydro-biogeochemical coupling beneath a large polythermal Arctic glacier: Implications for subice sheet biogeochemistry. Journal of Geophysical Research 115 (F04017):1–16. doi:10.1029/2009JF001602.
- Wimpenny, J., K. W. Burton, R. H. James, A. Gannoun, F. Mokadem, and S. R. Gíslason. 2011. The behaviour of magnesium and its isotopes during glacial weathering in an ancient shield terrain in West Greenland. Earth and Planetary Science Letters 304:260–69. doi:10.1016/j.epsl.2011.02.008.
- Wimpenny, J., R. H. James, K. W. Burton, A. Gannoun, F. Mokadem, and S. R. Gíslason. 2010. Glacial effects on weathering processes: New insights from the elemental and lithium isotopic composition of West Greenland Rivers. Earth and Planetary Science Letters 290:427–37. doi:10.1016/j.epsl.2009.12.042.
- Wynn, P. M., A. Hodson, and T. Heaton. 2006. Chemical and isotopic switching within the subglacial environment of a high Arctic glacier. Biogeochemistry 78:173–93. doi:10.1007/s10533-005-3832-0.
- Wynn, P. M., D. J. Morrell, H. Tuffen, P. Barker, F. S. Tweed, and R. Burns. 2015. Seasonal release of anoxic geothermal meltwater from the Katla volcanic system at Sólheimajökull, Iceland. Chemical Geology 396:228–38. doi:10.1016/j.chemgeo.2014.12.026.
- Yde, J. C., K. W. Finster, R. Raiswell, J. P. Steffensen, J. Heinemeier, J. Olsen, H. P. Gunnlaugsson, and O. B. Nielsen. 2010. Basal ice microbiology at the margin of the Greenland Ice Sheet. Annals of Glaciology 51 (56):71–79. doi:10.3189/172756411795931976.
- Yde, J. C., N. T. Knudsen, B. Hasholt, and A. B. Mikkelsen. 2014. Meltwater chemistry and solute export from a Greenland Ice Sheet catchment, Watson River, West Greenland. Journal of Hydrology 519:2165–79. doi:10.1016/j.jhydrol.2014.10.018.
- Young, N. E., and J. P. Briner. 2015. Holocene evolution of the Western Greenland Ice Sheet: Assessing geophysical ice-sheet models with geological reconstructions of ice-margin change. Quaternary Science Reviews 114:1–17. doi:10.1016/j.quascirev.2015.01.018.
- Zolkos, S., S. E. Tank, and S. V. Kokelj. 2018. Mineral weathering and the permafrost carbon-climate feedback. Geophysical Research Letters 45:9623–32. doi:10.1029/2018GL078748.