
 ?Mathematical formulae have been encoded as MathML and are displayed in this HTML version using MathJax in order to improve their display. Uncheck the box to turn MathJax off. This feature requires Javascript. Click on a formula to zoom.
ABSTRACT
Snowmelt in alpine regions supports hydroelectric power generation, water supply, and agricultural production. These regions are warming, and the impact on streamflow of changes in precipitation and the proportion falling as snow is of interest. We investigate the seasonality and interannual variability of streamflow in the Australian Alps, a key location due to the marginal snowpack with winter air temperatures close to 0°C, and focus on a small subalpine catchment with properties representative of an important part of the broader snow-affected region. Streamflow was highly responsive to precipitation inputs with little autocorrelation observed. Water years were divided into four hydrological seasons based on the mean properties of normalized cumulative inflows. The spring snowmelt season accounted for the greatest proportion of annual inflows (mean = 39 percent). However, correlations between seasonal and annual inflows were only significant in the other three seasons, and winter inflows were the most important contributor to annual variability. The present snowpack is highly variable and sensitive to synoptic-scale influences. Although significant future reductions in snow-covered area have been predicted, we find that water resources are more susceptible to observed declines in total precipitation and likely increases in evapotranspiration than to a shift to proportionally less snowfall.
Introduction
Streamflow variability exerts a fundamental control on the availability of water resources. Annual streamflow volumes and their seasonality are largely determined by the amount and timing of precipitation and evapotranspiration, as well as the size of the catchment and the influence of snowpack storage and melt (Dettinger and Diaz Citation2000). Long-term runoff efficiency, the ratio of runoff to spatially integrated precipitation, varies greatly from region to region, and at an event scale, runoff efficiency in a given catchment increases with the amount of precipitation during the event and antecedent soil moisture (Merz, Blöschl, and Parajka Citation2006). Understanding the dominant drivers of streamflow variability in particular catchments of interest allows for the more efficient management of water resources.
Snow-covered areas are an important source of water for much of society (Viviroli et al. Citation2007) yet are highly vulnerable to change in a warming climate (Adam, Hamlet, and Lettenmaier Citation2009). Earlier research into the impact of climate change on water resources was commonly based on the assumption that higher temperatures and a proportional reduction in snowfall would affect the timing of runoff but not change the overall volumes (Foster et al. Citation2016). More recently, studies have shown that total runoff may be reduced as the proportion of precipitation falling as snow decreases (Berghuijs, Woods, and Hrachowitz Citation2014), potentially due to earlier and more gradual melting of the snowpack (Barnhart et al. Citation2016; Musselman et al. Citation2017). Barnett, Adam, and Lettenmaier (Citation2005) suggested that any changes to evapotranspiration could have limited significance in snow-dominated catchments due to the fact that more snowmelt would be occurring at times of relatively low potential evapotranspiration (PET), although Foster et al. (Citation2016) found that increases in summer evapotranspiration impacted the total annual runoff in the U.S. Rocky Mountains more than changes to the precipitation phase.
The response of runoff in snow-dominated catchments to variability and change is highly likely to vary across the globe and be dependent on local climate and snowpack characteristics (Stewart Citation2009). In the Northern Hemisphere, Brown and Mote (Citation2009) found that regions with maritime snow and mild winter temperatures were more sensitive to warming than were colder continental regions. An increased prevalence of rainfall during winter and spring may make flooding more common in regions such as the Alps (Bavay et al. Citation2009; Beniston and Stoffel Citation2016), although Wang, Kumar, and Link (Citation2016) noted a tendency for decreasing seasonal streamflow maxima in locations more likely to experience snow-to-rain transitions. Similarly, Petersky and Harpold (Citation2018) reported a much weaker response of deep soil moisture beneath shallow ephemeral snow to the date of snow disappearance, compared to that beneath deeper seasonal snow, with runoff generation likely to be reduced as a result. Responses may also differ across relatively modest distances and elevation ranges, as a result of differences in catchment characteristics as well in projections of precipitation, temperature, and evapotranspiration (Capell, Tetzlaff, and Soulsby Citation2013; Jepsen et al. Citation2018).
The Murray–Darling Basin (MDB) encompasses approximately 1 million km2 (14 percent of the Australian landmass) and is a major agricultural region with areas of high environmental significance (Leblanc et al. Citation2012). Cai and Cowan (Citation2008) showed that declining inflows since 1950 have been the result of both reductions in precipitation and increases in temperature. Fiddes and Timbal (Citation2016) found that decreases in streamflow in the state of Victoria, including at a number of sites in the MDB, were greatest in the west and least near the Australian Alps, indicating the importance of the Alps as a reliable contributor of inflows to the largely semi-arid MDB. Nevertheless, inflows to catchments in the Australian Alps during the Millennium Drought of 2001–2009 were the lowest in the past 500 years (McGowan et al. Citation2009). Chubb, Siems, and Manton (Citation2011) reported a decline in cool-season (May–September) precipitation over the Snowy Mountains region of the Australian Alps between 1990 and 2009, as a result of the passage of fewer frontal systems. Theobald, McGowan, and Speirs (Citation2016) found a decreasing trend in inflow-generating precipitation (that is, precipitation on days with ≥10 mm) in the shoulder months of May and October between 1958 and 2012. Further reductions in precipitation have the potential to significantly reduce total catchment inflows in the Australian Alps, with impacts on the management of water resources in the wider MDB.
Though significant reductions in snow-covered area have been projected for the Australian Alps over coming decades (Di Luca, Evans, and Ji Citation2018), the role of the warm and highly marginal seasonal snowpack in the changing hydrology of the region, and similar regions globally, is not well understood. Marginal snow environments feature wintertime air temperatures close to 0°C and are characterized by relatively short snow seasons, high bulk densities, and high variability within and between years (Sanecki et al. Citation2006). These snowpacks occur in many areas of the world (e.g., López‐Moreno Citation2005; Nolin and Daly Citation2006; Bormann, Evans, and McCabe Citation2014; Fayad et al. Citation2017) and can be considered a hybrid of the maritime and ephemeral snow cover categories in the classification system of Sturm et al. (Citation1995). This combination of deeper, more persistent snow and shallower, ephemeral snow in close proximity leads to marginal snowpacks having distinct dynamical characteristics, with a reduced ability to scale point measurements to the catchment (Bilish et al. Citation2019). It is likely that the quantitative impacts of a reduction in snow cover on snowpack water storage and conversion to runoff are also influenced by the marginal nature of the snowpack in these settings and may differ from those reported for other snow-affected areas.
A key constraint on research into catchment water balances is the availability of high-quality data records of sufficient duration. Streamflow measurements have been made in the Australian Alps for many decades (Reinfelds et al. Citation2014); precipitation records at the highest elevations are fewer, generally shorter in length, and often subject to considerable uncertainty where a moderate proportion of the precipitation falls as snow (Chubb et al. Citation2015). Similarly, the Australian Water Availability Project gridded precipitation data set (Jones, Wang, and Fawcett Citation2009) provides a useful resource for investigations over extended periods of time, although the large systematic biases over the higher elevations documented by Chubb et al. (Citation2016) may significantly impact the suitability of this data set for studies in the Australian Alps. Here, in an effort to limit the influence of input uncertainty, we investigate processes in a small headwater catchment using a shorter (twelve-year), high-quality precipitation and streamflow record supported by a range of ancillary measurements.
The purpose of this study is to investigate the contribution of the snowpack to streamflow variability in the Australian Alps, with specific reference to the implications of the marginal state of the snowpack. The article first derives the components of the water balance for the upper Pipers Creek catchment and documents the inter- and intra-annual variability in each. It then seeks to quantify the seasonal influences on the magnitude and efficiency of runoff, particularly those related to cool season processes. It concludes by relating this small catchment to the wider Australian Alps region and examining the mechanisms by which streamflow in this marginal snow environment may change in a warming climate.
Methods
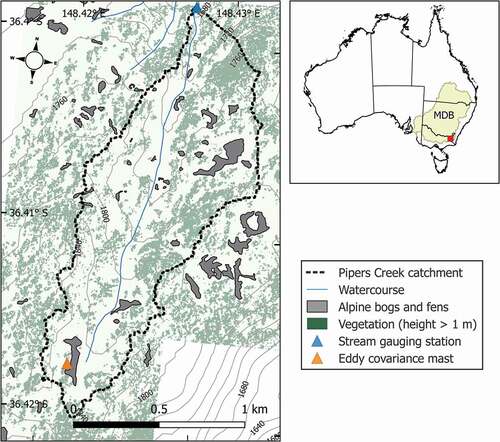
The upper Pipers Creek catchment is located within the subalpine zone of Kosciuszko National Park, New South Wales, Australia (), and was previously described by Bilish, McGowan, and Callow (Citation2018). It covers 1.4 km2 between the elevations of 1,668 and 1,853 m a.s.l. and during the cooler months experiences a marginal seasonal snowpack. This elevation range represents an important part of the region subject to snow in the Australian Alps, where the maximum elevation is 2,228 m a.s.l. The two dominant vegetation types are grasslands and eucalypt woodlands, although sphagnum bogs and fens are also present. These, together with the surrounding organic-rich soils (Stromsoe et al. Citation2016), potentially play an important role in the hydrology of the catchment. Pipers Creek lies within the catchment of the Snowy Mountains Hydro-electric Scheme, which provides electricity to the National Electricity Market and diverts water to the MDB. Each water year runs from 1 May until 30 April of the following year, and the study period here includes the twelve water years from 2006–2007 to 2017–2018.
Figure 1. Features of the Pipers Creek catchment and location relative to the MDB
The water balance of the catchment was defined as
where Q is time-integrated streamflow (also referred to as catchment inflows), P is precipitation, ET is evapotranspiration, and ∆S is the change in catchment storage. The first three terms are measured or estimated as described below. The latter term is calculated as the residual of the water balance, includes the contribution of the snowpack and alpine bogs and accounts for measurement error and any losses to groundwater.
Stream height was measured using an ESS Earth Sciences LevelPro 6100 pressure sensor upstream of a concrete V-notch weir and logged every 30 minutes. Flow was within the notch 97 percent of the time, accounting for approximately 94 percent of total inflows.
A 6-hour precipitation record for Pipers Creek was derived from data from the Perisher and Guthega Power Station precipitation gauges operated by Snowy Hydro Ltd. The Perisher gauge, located 1 km to the west of the catchment at an elevation of 1,761 m a.s.l., was the preferred measurement site, although it was only operated seasonally (typically May–October). Wind-induced undercatch of precipitation can be a large source of error when that precipitation falls as snow (Rasmussen et al. Citation2012; Chubb et al. Citation2015), and this ETI Instrument Systems NOAH II weighing gauge was located within a double wind fence in order to minimize measurement error. Outside of the cool season, precipitation was recorded by a heated tipping bucket gauge at Guthega Power Station, located approximately 5 km to the north of Pipers Creek at an elevation of 1,341 m a.s.l. and scaled based on the observed relationship between the Perisher and Guthega Power Station gauges. There was a strong temperature-dependent variation in this relationship at temperatures in the vicinity of 0°C, so regression equations were developed and applied for six different temperature classes to ensure an optimal fit under varying conditions. The proportion of precipitation falling as snow at the area-weighted mean elevation of the catchment (1,783 m a.s.l.), hereafter referred to as psnow, was estimated from the measured dry bulb air temperature using the method described by Bilish et al. (Citation2019).
Actual evapotranspiration (AET) was measured at a site in the upper catchment over a twenty-month period using the eddy covariance method (Bilish, McGowan, and Callow Citation2018). Reinfelds et al. (Citation2014) and McGowan et al. (Citation2018) have previously identified catchments above ~1,000 m a.s.l. in this region to be energy-limited systems. We therefore estimated AET for the catchment over the entire study period by deriving seasonal ratios of measured AET to modeled PET for the shorter period and using these to scale a PET record from the Australian Water Resources Assessment Landscape (v6.0) model (Frost, Ramchurn, and Smith Citation2018).
Snow water equivalent (SWE) measurements from the Spencers Creek snow course were included as an ancillary variable. Spencers Creek is located 7 km west of Pipers Creek at an elevation of 1,830 m a.s.l. and has been surveyed weekly throughout each snow season since 1954. Many previous studies of the Australian snowpack have used the Spencers Creek record as a primary input, although Bilish et al. (Citation2019) showed that using this site alone did not adequately represent the high degree of variability in the local area. It is therefore recognized that these SWE measurements may not be directly related to the total volume of water stored in the snowpack at Pipers Creek. However, because the snow course site has properties similar to those parts of the Pipers Creek catchment that retain snow the longest (Bilish et al. Citation2019), it is expected that this record provides a reasonable estimate of the period over which there was any snow on the ground at Pipers Creek. Consequently, the rain-on-snow accumulation in each water year is defined here as the sum of the rainfall recorded while there was snow on the ground at the Spencers Creek snow course.
Results
Mean water year precipitation across the study period was 1,821 mm (range = 1,169–2,545 mm) and mean water year inflows were 1,579 ML (range = 945–2,150 ML), giving an average runoff efficiency of 63 percent. Precipitation was highest in the winter months of July and August, and streamflow peaked in September as the seasonal snowpack melted ().
Figure 2. (a) Mean monthly precipitation, with ranges measured over the study period. (b) Mean daily air temperature at the area-weighted mean catchment elevation (1,783 m a.s.l.), with the seven-day moving mean (black). (c) Mean monthly inflows, with ranges measured over the study period. (d) Normalized cumulative inflows for water years in the study period (2006–2007 to 2017–2018), with the mean (black). Identified hydrological seasons based on streamflow are moderate flow winter season (1), high-flow snowmelt season (2), drying season (3), and low-flow season (4)
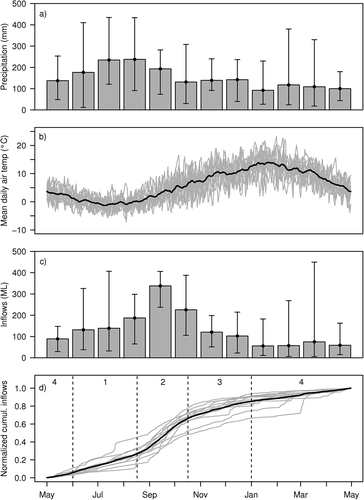
Four hydrological seasons were defined based on the mean properties of normalized cumulative inflows (). A period of moderate flows (“winter season”/season 1) was present over much of winter (June to mid-August), during which time a seasonal snowpack existed in the catchment. Melting of the bulk of the snowpack produced a period of higher flows, typically between mid-August and mid-October (“snowmelt season”/season 2). Inflows decreased between mid-October and the end of December as the last remaining snow drifts melted and the catchment started to dry out (“drying season”/season 3). A “low-flow season” (season 4) extended over the summer and autumn months of January to May. These seasons are similar to those identified in a semi-arid catchment in Idaho by McNamara et al. (Citation2005) using soil moisture, although we have not included a transitional wetting period (between seasons 4 and 1) here because these seasons are based only on measured flows, which appear to respond relatively quickly to inputs following the low-flow season. Seasons 1 to 3 are together labeled the “snow-affected period,” in order to provide a consistent basis for distinguishing between inflows originating from cool-season precipitation and snowmelt and those received over the entire water year.
Variability in water balance components
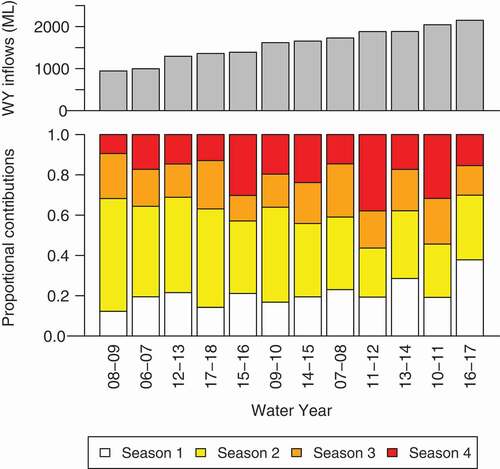
Season 2 featured the highest mean daily flows and made the greatest contribution to total inflows in nine out of twelve water years (). The mean volumes in each of the other seasons were approximately half of those in season 2, and the coefficients of variation in seasons 1 and 4 were both somewhat higher. Inflows over the water year had the strongest correlation with those in seasons 1 and 3, although the correlation with season 4 inflows was still significant at the 5 percent level (). Notably, there was no correlation between water year inflows and those in season 2. There was, however, a moderate negative correlation with the proportion of the total inflows occurring during season 2. Thus, in the driest years, spring snowmelt provides a large proportion of catchment inflows, with lower inflows recorded at other times of the year ().
Table 1. Seasonal variations in catchment inflows and contributions to total water year inflows
Table 2. Regression coefficients for water year inflows against seasonal metrics
Figure 3. Proportional contributions to inflows by season, as a function of total water year (WY) inflows
The mean water year value of psnow was 0.36, and this varied from 0.25 to 0.45 over the years in the study period. The mean value of psnow in the snow-affected period was 0.47, varying between 0.37 and 0.58. Most of the snowfall generally occurred during seasons 1 and 2, and the mean value of psnow in this period was 0.62, ranging from 0.50 to 0.76. No relationship was identified between mean air temperature and psnow in either of these three periods.
The mean estimated AET over the water year was 453 mm or 26 percent of precipitation, and this proportion varied from 18 to 39 percent across the study period. There was a strong seasonal variation in estimated AET () as a result of the variations in modeled PET and the AET/PET ratio being in phase. Estimated AET was lowest in season 1 (0.3 mm day−1) and highest in season 3 (2.2 mm day−1). The presence of snow on the ground was a major inhibitor to AET, with estimated AET being almost three times greater in season 4 than in season 2, despite mean PET being 10 percent lower.
Figure 4. Time series of seasonal water balance terms
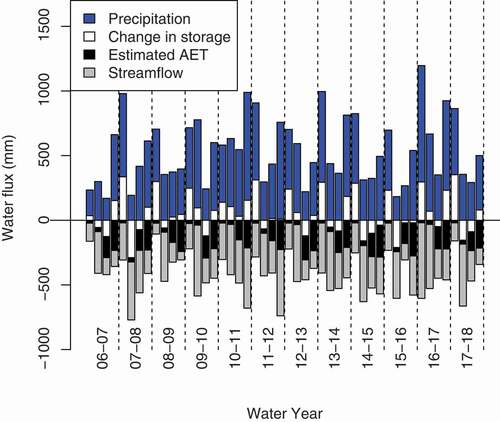
The change in storage includes fluxes to and from the subsurface and snowpack as well as the unknown error term. This term was positive in each season 1, indicating both the accumulation of a seasonal snowpack and the replenishment of subsurface storage following the dry season. Season 2 fluxes were negative in eight out of twelve years and season 3 fluxes were negative in nine out of twelve years, representing the melting of the snowpack and the release of water stored in the catchment.
Annual runoff efficiency was relatively consistent (), with a mean of 0.63 and a standard deviation of 0.07. The lowest runoff coefficient (0.47) was observed in 2008–2009 near the end of the Millennium Drought, and the highest was in 2014–2015 (0.71). As with inflows, water year runoff efficiency was inversely related to the proportion of the total inflows occurring during season 2 (), with greater efficiency observed when moderate inflows were not restricted to the snowmelt season.
Table 3. Regression coefficients for water year runoff efficiency against seasonal metrics
Figure 5. Relationship between observed water year inflows and precipitation. The dashed line shows the mean annual water year runoff efficiency of 63 percent. Adjusted R2 = 0.848, p < .01

The snow-affected period
Total precipitation was the strongest predictor of inflows during the snow-affected period (adjusted R2 = 0.781, p < .01). Limiting the focus to total rainfall or rain-on-snow resulted in weaker, though still significant, relationships. In order to determine whether inflows were related more to the occurrence of a number of moderate rain-on-snow events than to simply the total accumulation over the season, the number of rain-on-snow events of greater than 5, 10, 20, and 50 mm in each snow-affected period was examined, as well as the total accumulation from such events. In each case, the strongest relationship was associated with 10 mm events and the correlation became weaker as the size of the event increased further, potentially due to fewer of these larger events occurring each year, meaning that the statistics were less robust. The number of events of 10 mm or greater (adj. R2 = 0.748, p < .01) was a somewhat better predictor of inflows than the total rain-on-snow accumulation (adj. R2 = 0.492, p < .01), yet including this metric in a linear model with total precipitation gave a negligible improvement in model skill compared to using just total precipitation.
In eleven out of twelve years, runoff was more efficient during winter–spring than during the summer–autumn low-flow period. The most pronounced case was the dry 2006–2007 water year, when the runoff coefficient was 0.61 over the full year but 0.89 over the snow-affected period, despite peak SWE at Spencers Creek being the lowest on record and psnow in the snow-affected period being the second lowest in this data set. In only one water year (2011–2012) was the efficiency over the whole year (0.66) greater than that over the snow-affected period (0.64). This particular year featured the highest proportional contribution from season 4 inflows due to extreme rainfall in February–March 2012. No direct relationship was observed between the runoff coefficient over the snow-affected period and total inflows, precipitation, psnow, PET, estimated AET, or seasonal maximum SWE at the nearby Spencers Creek snow course ().
Figure 6. Catchment runoff coefficients for the snow-affected period (seasons 1–3) plotted against metrics related to water balance inputs
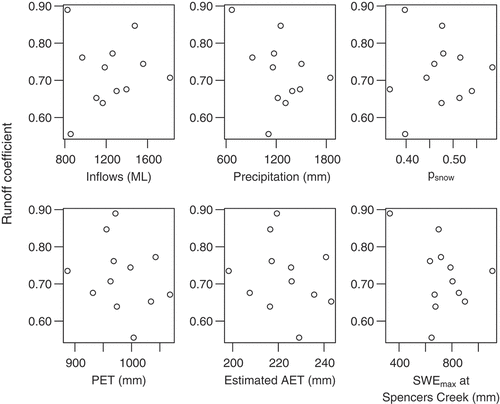
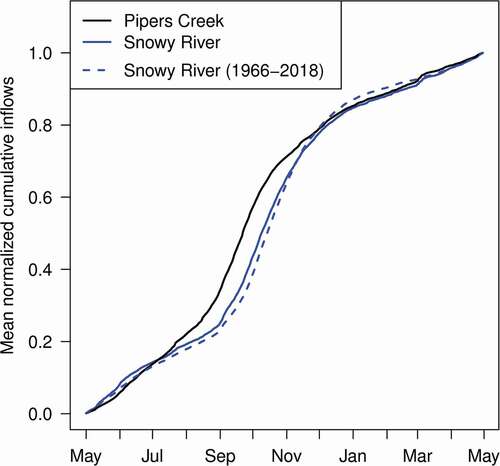
Figure 7. Comparison of normalized cumulative inflows at Pipers Creek and the Snowy River above Guthega for water years in the study period (2006–2017). Also shown is the Snowy River over an extended period of time
Considering the main snowmelt period (season 2) separately, there was a significant correlation between precipitation and inflows (adj. R2 = 0.341, p = .027), although this was much weaker than that over the whole snow-affected period due to the effect of the snowpack on the timing of runoff. In particular, though high precipitation in season 2 tended to produce higher inflows, lower precipitation could still result in moderate inflows provided that a moderate snowpack was present. This was effectively a conversion of season 1 precipitation into season 2 inflows. The regression coefficient for inflows against peak SWE at Spencers Creek was higher than for the entire snow-affected period, though it still failed to achieve significance at the 95 percent level (adj. R2 = 0.203, p = .08).
Notable events within the study period
Though relatively short, the study period included a number of notable precipitation and inflow events at both the dry and wet ends of the spectrum. These provide examples of catchment responsiveness at short timescales and the link between annual inflows and seasonal variability.
End of the Millennium Drought (2006–2007 to 2008–2009)
The Millennium Drought affected southeast Australia between 2001 and 2009, with rainfall over the broader area being below the median in each year throughout this extended period (van Dijk et al. Citation2013). Precipitation during the first water year in the Pipers Creek record (2006–2007) was below the mean in each season, and the maximum seasonal SWE at the Spencers Creek snow course was the lowest on record. Inflows were also low throughout and were 63 percent of the mean for the year as a whole. Inflows increased to above the mean in the following year due to higher precipitation in seasons 1 and 3, although the catchment started to dry out again in the summer. The 2008–2009 water year was the driest for Pipers Creek in the study period, with inflows again falling below the mean in each season. Moderate precipitation was received during seasons 2 and 3 and inflows in these seasons were not as low as in 2006–2007. However, those during seasons 1 and 4 were the lowest in the sequence—33 and 27 percent of the means, respectively ()—and were sufficient to produce an exceptionally dry year.
Table 4. Seasonal inflows as a proportion of the mean during the three wettest and three driest years
Wet La Niña period (2010–2011 to 2011–2012)
The 2010–2011 water year featured the second highest precipitation and inflows in the study period as well as the lowest value of psnow, explained by an increased proportion of the total precipitation falling in seasons 3 and 4. Inflows were closer to the mean throughout the first three seasons of 2011–2012, and then the Australian Alps were affected by the heavy rainfall and flooding experienced across southeast Australia in late February and early March 2012, which included the wettest seven-day period on record for the MDB (Bureau of Meteorology Citation2012). Pipers Creek received 300 mm over the same period, and the intensity of this precipitation resulted in a higher runoff efficiency in season 4 of 2011–2012 than in the same season of the previous year (0.68 compared to 0.56), despite the seasonal precipitation not being as high. This wet period was quickly followed by inflows below the mean in winter 2012, only a few months later.
Mid-winter rain-on-snow (2016–2017)
The highest precipitation and inflows in the study period occurred in the 2016–2017 water year, largely as a result of a wet winter. Although below average inflows were received in the previous year, high precipitation was recorded during winter 2016 and season 1 inflows were 234 percent of the mean, accounting for 38 percent of the water year total (mean = 21 percent). The largest single event occurred on 22 July 2016, when 118 mm of rain-on-snow over a 12-hour period caused complete ablation of the snowpack over a moderate proportion of the catchment and produced the highest 24-hour inflows in the Pipers Creek record. Snowfall restored much of the snowpack over the following days, and precipitation continued to alternate between snow and rain over the rest of the season. Locations that had managed to retain snow through the rain-on-snow event developed a deeper, more persistent snowpack, whereas those that had undergone complete melt remained marginal (Bilish et al. Citation2019). Despite the important contribution from rainfall in winter, psnow was only slightly below average in both the snow-affected period and the water year. Inflows trended back toward the mean over the remainder of the water year.
Discussion
Closure of the water balance
The accumulated residual in the water balance over the study period was 2,651 mm, or 12.2 percent of the total recorded precipitation, assuming no net change in storage. This is comparable to a study of large snow-affected catchments in Canada (Wang et al. Citation2015) and seemingly considerably smaller than in a previous study in the Australian Alps (Reinfelds et al. Citation2014). On a year-by-year basis, the residuals ranged from −0.8 to 21.6 percent of precipitation. The relatively consistent occurrence of positive residuals may be the result of limited subsurface storage capacity in the catchment, with storage depletion and recharge being small relative to the other fluxes.
Considering the components of the water balance individually, very few studies have direct measurements of AET across a catchment, and this was the only flux that was not measured across the entire study period here. The use of PET in the water balance instead would still result in a nonclosure of 8.4 percent, suggesting that the method for estimating seasonal AET from PET was not the dominant source of uncertainty. Precipitation can be highly spatially variable, although this factor is somewhat mitigated in this case by the small size of the catchment and the proximity (in the cool season) of the precipitation gauge. Though additional uncertainty is introduced by the use of a second gauge during the warm season, its distance from the catchment is still modest and is comparable to the resolution of the best available gridded data. The streamflow data were improved by several gaugings undertaken during moderate flow events, yet remain a source of uncertainty particularly in those seasons with higher flow events. In any event, it is considered likely that the variability in each term has been sufficiently represented since reasonable closure of the water balance was achieved.
Streamflow and the snowpack
Though season 2 was the highest inflow season in nine out of twelve years, these inflows were not correlated with total inflows over the water year. Season 2 inflows had the lowest coefficient of variation overall and, during the three wettest and three driest years, exhibited the weakest proportional deviation from the mean of all seasons (). In contrast, a moderate correlation was observed between water year inflows and season 1 inflows, and there was a weaker but still significant correlation between water year inflows and season 1 inflows as a proportion of the total ( and ). Inflows during seasons 3 and 4 also had a moderate correlation with water year inflows. It is therefore evident that though inflows from the snowmelt season are a large component of the annual total, they do not account for the observed interannual variability, which is instead determined much more by inflows in the other three seasons. Nevertheless, the spring snowmelt period is a reliable source of water for the catchment, and snowpack processes become particularly relevant to the management of water resources during dry years.
Inflows during winter were important during both wet and dry years. The relationship between inflows and precipitation was also greatest during winter (season 1): marginally better than during seasons 3 and 4 and somewhat stronger than during season 2. Though precipitation phase did not have a significant effect on inflows over the water year or the snow-affected period as a whole, it was an influencing factor during winter, with a greater incidence of rainfall producing higher inflows. Rain-on-snow occurred relatively frequently because air temperatures were often close to 0°C throughout winter, and the highest daily streamflow in the record followed the rain-on-snow event on 22 July 2016. Bilish et al. (Citation2019) found that melt processes were responsible for the distribution of the Australian snowpack even relatively early in the season, and the streamflow observations here are consistent with that result. Moderate inflows recorded over winter were due to both the partial melting of the snowpack and precipitation falling as rain contributing to quickflow.
There was little persistence observed in catchment inflows, with no significant autocorrelation in water year inflows or in monthly inflows relative to the mean. In addition, no significant correlation was observed between net change in catchment storage at the annual timescale and either streamflow or runoff efficiency, either in the same water year or with a one-year lag. In the nearby Victorian Alps, Cartwright and Morgenstern (Citation2016) showed the transit time of water in catchments with predominantly eucalypt forests to be in the order of years to decades due to high rates of transpiration and slow movement through the soil, with much more rapid passage of water through peatlands. The latter is consistent with the observed lack of persistence at Pipers Creek, and it is likely that retention and storage of water in the catchment is limited in any case by modest soil depth (Hope, Nanson, and Jones Citation2012). In wetter years, high levels of surface and near-surface moisture were observed in parts of the catchment through the summer period, well after final snowmelt, although such areas may be spatially limited and did not occur each year. As a result, the catchment responded relatively quickly to water inputs, and hydrometeorological drivers more generally, even following periods of drought. The three inflow sequences discussed in section “Notable events within the study period” provide further evidence of this. The contribution of antecedent conditions to runoff processes and efficiencies at shorter (e.g., event) timescales is an area for future research.
Previous studies in the Australian alpine region have found relationships between seasonal snow depth and mean daily maximum temperature and a weaker relationship with mean daily minimum temperature (Nicholls Citation2005; Davis Citation2013; Pepler, Trewin, and Ganter Citation2015). Fiddes, Pezza, and Barras (Citation2015) detected a similar dependence on temperature for the number of days with increases in snow depth in the Victorian Alps. However, despite the sensitivity of precipitation phase to temperature, there was no indication of any seasonal or annual relationships between mean, maximum, or minimum daily air temperatures and psnow at Pipers Creek. Similarly, though Safeeq et al. (Citation2016) found statistically significant differences in psnow between the coldest and warmest years in several regions of the United States, no such relationship was detected here. A number of factors may have contributed to these results and the real or apparent differences with previous studies. Firstly, the relationship between temperature and snowfall could be expected to differ from that between temperature and snow on the ground, even at relatively short timescales and particularly at warmer temperatures (Safeeq et al. Citation2016). There is a clear physical basis for the response of snow depth to mean temperature, whereas precipitation phase is more closely linked to instantaneous air temperature, and estimating it based on some knowledge of subdaily temperature variability and its timing with respect to when the precipitation fell is likely to produce a more accurate representation of true snowfall than using daily maxima, minima, or means. At Pipers Creek, mean air temperatures over seasons 1 and 2 varied by only 1.3°C across the study period, yet psnow over the same seasons ranged between 0.50 and 0.76. In marginal snow environments such as this, though precipitation phase is sensitive to small changes in air temperature, it appears that this is expressed more through synoptic and subdaily variability than through changes in mean air temperature. It is, for example, not uncommon to have both rain and snow fall on a particular day, though it is likely that these proportions will not be adequately resolved by the aforementioned temperature metrics.
Loss of water directly from the snowpack through evaporation or sublimation was a small component of the water balance. Estimated AET in seasons 1 and 2 was only 9 and 12 percent of PET, respectively, increasing to 39 percent in season 3. In a winter–spring season with high precipitation and runoff, Bilish, McGowan, and Callow (Citation2018) found the loss from the snowpack to represent only 6.5 percent of the total precipitation over the same period—much less, for example, than the 25 to 39 percent of total accumulated snow lost through sublimation in dry snow regions such as the Andes and the Atlas Mountains (López-Moreno et al. Citation2017). This present work supports the suggestion by Bilish, McGowan, and Callow (Citation2018) that evaporation following melt was likely to represent a much more significant loss to the overall catchment water balance (), because the relatively short snow season means that the snowpack had largely ablated prior to the arrival of warm dry conditions. Although recognized as an energy-limited environment, the Pipers Creek catchment was technically water limited (PET > precipitation) at the annual timescale for four of the five water years with the lowest inflows. Additional periods of within-season water-limited behavior were likely at times during the summer months, although streamflow was perennial despite the limited storage potential in the catchment.
Sensitivity to climate variability and change
Studies elsewhere have shown that precipitation phase can exert a control on runoff efficiency (e.g., Berghuijs, Woods, and Hrachowitz Citation2014; Zhang et al. Citation2015). Reinfelds et al. (Citation2014) observed increasing annual runoff coefficients with elevation in the Australian Alps and attributed these to higher proportions of the precipitation falling as snow, although it is likely that elevation-dependent biases (Chubb et al. Citation2016) in the gridded precipitation product used contributed to these findings, particularly because runoff coefficients well in excess of unity were reported. The data presented here do not lend support to the prospect of decreasing annual streamflow at this location as a result of a shift from snowfall to rainfall. The earlier, more gradual and less efficient melting of a shallower snowpack may be a key physical mechanism for such a relationship in other settings (Musselman et al. Citation2017). However, because the Australian snow season is short and significant snowmelt already occurs during winter, the scope for earlier melt is much lower than in those places where the snowpack is more persistent. The changes to snowpack energetics and runoff efficiency associated with a shift in timing are also likely to be reduced, compared to locations where snowmelt currently peaks in late spring or summer.
Recent research (Bilish, McGowan, and Callow Citation2018; Bilish et al. Citation2019) has shown that individual synoptic events have an important role in the development of the Australian snowpack. We propose that this variability is also a major factor in the sensitivity of streamflow in this environment to warming and that precipitation phase plays a much less significant part. Despite a moderate proportion of the total annual precipitation falling as snow and snowmelt clearly influencing the timing of streamflow, the very high variability in the snowpack combined with its marginal mean state likely mean that large parts of the catchment already exhibit ephemeral snowpack properties and behavior in some years and that further decreases to snow-covered area (with continued dependence on individual accumulation and melt events) do not represent extreme departures from the current position in terms of runoff processes. Hammond, Saavedra, and Kampf (Citation2018) showed that the relationship between snowpack and streamflow variables was considerably weaker in wet/warm catchments than in dry/cold catchments in the western United States, and these weaker relationships are likely to apply in the Australian Alps as well (Bilish et al. Citation2019).
The net effect of changes to evapotranspiration is more difficult to determine because there can be multiple opposing considerations. The presence of snow on the ground acts to limit AET, so decreasing snow cover in a warmer climate will lead to greater AET during winter and spring, independent of any changes to PET, though the scale of this increase at this location relative to current conditions is again tempered by the existing variability in snow cover and the fact that evapotranspiration is lowest at this time of the year. Earlier melt may reduce total AET where increased AET during winter is more than offset by reduced AET in summer due to moisture stresses (Barnett, Adam, and Lettenmaier Citation2005; Jepsen et al. Citation2018). However, as previously discussed, there is limited potential for significantly earlier melt at Pipers Creek and the catchment is not always water limited over summer. With continued warming, it is likely that increases in AET over the warmer months will dominate the contribution of evapotranspiration to changing streamflow yields and exceed any effect arising directly from the shift from snow toward rain, similar to the findings of Foster et al. (Citation2016) in the Rocky Mountains. Given the strong relationship between precipitation and streamflow, more significant to the availability of water resources in the shorter term are the moderate declines observed in cool-season precipitation (Chubb, Siems, and Manton Citation2011; Theobald, McGowan, and Speirs Citation2016).
Application to the wider Australian Alps region
Because catchment properties and behavior vary across the region (Reinfelds et al. Citation2014), it is worth considering how findings based on this small catchment relate to the snow-affected areas of the wider Australian Alps. The highest point is Mt. Kosciuszko at 2,228 m a.s.l., and the lower extent of seasonal snow is generally considered to be around 1,400 m a.s.l. (Sanecki et al. Citation2006). Bilish, McGowan, and Callow (Citation2018) wrote that the Pipers Creek catchment “has features representative of a key part of the Australian Alps region” (3839) in terms of both elevation and vegetation, and Bilish et al. (Citation2019) found that it included a wide range of snowpack conditions, from moderate drifts to areas with high solar and wind exposure. Differences in snowpack behavior are most likely to occur in the true alpine areas and those around the seasonal snowline, although the snowpack in the latter is highly ephemeral and will have a smaller influence on catchment hydrology than at Pipers Creek.
In practice, alpine snowpack properties are likely confined to areas above at least 1,850 m a.s.l., which comprise only 3 percent of the total catchment of the Snowy Mountains Hydro-electric Scheme, and a smaller proportion of the Australian Alps overall. Comparing the distribution of seasonal streamflow for the Pipers Creek catchment to that for the Snowy River above Guthega gauging station, which has 59 percent of its area above 1,850 m a.s.l., the differences observed were relatively modest (). The mean timing of the spring inflow peak was eighteen days earlier at Pipers Creek, and wintertime inflows also contributed a greater proportion of the total there. Normalized cumulative inflows were almost identical in the two catchments in the second half of the water year (December–April), once snow cover was limited to isolated snow patches at the highest elevations (Green and Pickering Citation2009). The Snowy River catchment is the most snow-affected in the Scheme, and though other managed catchments have alpine components, these are proportionally much smaller and contribute less to overall behavior. It is therefore maintained that, though there is some uncertainty regarding the alpine zone, the general features of snowmelt hydrology observed in the Pipers Creek catchment offer considerable insight to the processes occurring over a much greater area of the Australian Alps and are highly relevant to the management of water resources there. The minor differences in the distributions for the Snowy River between the study period for this article and the longer historical record also provide reassurance that the twelve-year period of record is suitably representative of actual hydrological variability in these catchments.
Conclusions
Precipitation is the principal driver of seasonal and interannual streamflow variability in this marginal snow environment. As a result of a wintertime precipitation maximum and mild winter and spring air temperatures, there is a relatively small temporal offset between the peaks of the mean precipitation and streamflow cycles in the Australian Alps. Spring is typically the highest streamflow season and, because snowfall accounted for between one-half and three-quarters of the precipitation in the study catchment during winter and spring, snowmelt makes an important contribution to total streamflow. Nevertheless, it was the variability outside the main snowmelt period that explained the observed interannual variability in streamflow. This study has therefore shown that the snowpack has a somewhat mixed influence on the overall hydrology of the catchment in this marginal snow environment. Snowpack processes are critical to the understanding of catchment behavior, particularly at the shorter timescales, yet play a smaller role in the annual water balance, even when snowfall makes up a reasonable proportion of the total precipitation. Despite the Australian snowpack itself being highly vulnerable to a warming climate, the direct consequences of a reduction in snowfall on streamflow are likely to be less significant than trends in total precipitation.
Acknowledgments
We thank Mic Clayton for his assistance with data collection and verification. Streamflow data were provided by Llyod Smith and potential evapotranspiration data were supplied by the Australian Bureau of Meteorology. We are grateful to the Associate Editor, Nick Pepin, and to three anonymous reviewers for their constructive comments that improved the article. We also acknowledge the support of Snowy Hydro Ltd. and the NSW National Parks and Wildlife Service.
Disclosure statement
No potential conflict of interest was reported by the authors.
Additional information
Funding
References
- Adam, J. C., A. F. Hamlet, and D. P. Lettenmaier. 2009. Implications of global climate change for snowmelt hydrology in the twenty-first century. Hydrological Processes 23 (7):962–72. doi:https://doi.org/10.1002/hyp7201.
- Barnett, T. P., J. C. Adam, and D. P. Lettenmaier. 2005. Potential impacts of a warming climate on water availability in snow-dominated regions. Nature 438 (7066):303–09. doi:https://doi.org/10.1038/nature04141.
- Barnhart, T. B., N. P. Molotch, B. Livneh, A. A. Harpold, J. F. Knowles, and D. Schneider. 2016. Snowmelt rate dictates streamflow. Geophysical Research Letters 43 (15):8006–16. doi:https://doi.org/10.1002/2016GL069690.
- Bavay, M., M. Lehning, T. Jonas, and H. Löwe. 2009. Simulations of future snow cover and discharge in Alpine headwater catchments. Hydrological Processes 23 (1):95–108. doi:https://doi.org/10.1002/hyp.7195.
- Beniston, M., and M. Stoffel. 2016. Rain-on-snow events, floods and climate change in the Alps: Events may increase with warming up to 4 °C and decrease thereafter. Science of the Total Environment 571:228–36. doi:https://doi.org/10.1016/j.scitotenv.2016.07.146.
- Berghuijs, W. R., R. A. Woods, and M. Hrachowitz. 2014. A precipitation shift from snow towards rain leads to a decrease in streamflow. Nature Climate Change 4 (7):583–86. doi:https://doi.org/10.1038/NCLIMATE2246.
- Bilish, S. P., H. A. McGowan, and J. N. Callow. 2018. Energy balance and snowmelt drivers of a marginal subalpine snowpack. Hydrological Processes 32 (26):3837–51. doi:https://doi.org/10.1002/hyp.13293.
- Bilish, S. P., J. N. Callow, G. S. McGrath, and H. A. McGowan. 2019. Spatial controls on the distribution and dynamics of a marginal snowpack in the Australian Alps. Hydrological Processes 33 (12):1739–55. doi:https://doi.org/10.1002/hyp.13435.
- Bormann, K. J., J. P. Evans, and M. F. McCabe. 2014. Constraining snowmelt in a temperature‐index model using simulated snow densities. Journal of Hydrology 517:652–67. doi:https://doi.org/10.1016/j.jhydrol.2014.05.073.
- Brown, R. D., and P. W. Mote. 2009. The response of Northern Hemisphere snow cover to a changing climate. Journal of Climate 22 (8):2124–45. doi:https://doi.org/10.1175/2008JCLI2665.1.
- Bureau of Meteorology. 2012. Exceptional rainfall across southeast Australia (Special Climate Statement 30). http://www.bom.gov.au/climate/current/statements/scs39.pdf.
- Cai, W., and T. Cowan. 2008. Evidence of impacts from rising temperature on inflows to the Murray-Darling Basin. Geophysical Research Letters 35 (7):L07701. doi:https://doi.org/10.1029/2008GL033390.
- Capell, R., D. Tetzlaff, and C. Soulsby. 2013. Will catchment characteristics moderate the projected effects of climate change on flow regimes in the Scottish Highlands? Hydrological Processes 27 (5):687–99. doi:https://doi.org/10.1002/hyp.9626.
- Cartwright, I., and U. Morgenstern. 2016. Contrasting transit times of water from peatlands and eucalypt forests in the Australian Alps determined by tritium: Implications for vulnerability and the source of water in upland catchments. Hydrology and Earth System Sciences 20 (12):4757–73. doi:https://doi.org/10.5194/hess-20-4757-2016.
- Chubb, T. H., M. J. Manton, S. T. Siems, and A. D. Peace. 2016. Evaluation of the AWAP daily precipitation analysis with an independent gauge network in the Snowy Mountains. Journal of Southern Hemisphere Earth Systems Science 66 (1):55–67. doi:https://doi.org/10.22499/3.00000.
- Chubb, T. H., M. J. Manton, S. T. Siems, A. D. Peace, and S. P. Bilish. 2015. Estimation of wind-induced losses from a precipitation gauge network in the Australian Snowy Mountains. Journal of Hydrometeorology 16 (6):2619–38. doi:https://doi.org/10.1175/JHM-D-14-0216.1.
- Chubb, T. H., S. T. Siems, and M. J. Manton. 2011. On the decline of wintertime precipitation in the Snowy Mountains of southeastern Australia. Journal of Hydrometeorology 12 (6):1483–97. doi:https://doi.org/10.1175/JHM-D-10-05021.1.
- Davis, C. J. 2013. Towards the development of long-term winter records for the Snowy Mountains. Australian Meteorological and Oceanographic Journal 63 (2):303–13. doi:https://doi.org/10.22499/2.00000.
- Dettinger, M. D., and H. F. Diaz. 2000. Global characteristics of stream flow seasonality and variability. Journal of Hydrometeorology 1 (4):289–310. doi:https://doi.org/10.1175/1525-7541(2000)001<0289:GCOSFS>2.0.CO;2.
- Di Luca, A., J. P. Evans, and F. Ji. 2018. Australian snowpack in the NARCliM ensemble: Evaluation, bias correction and future projections. Climate Dynamics 51 (1–2):639–66. doi:https://doi.org/10.1007/s00382-017-3946-9.
- Fayad, A., S. Gascoin, G. Faour, J. I. López-Moreno, L. Drapeau, M. Le Page, and R. Escadafal. 2017. Snow hydrology in Mediterranean mountain regions: A review. Journal of Hydrology 551:374–96. doi:https://doi.org/10.1016/j.jhydrol.2017.05.063.
- Fiddes, S. L., A. B. Pezza, and V. Barras. 2015. A new perspective on Australian snow. Atmospheric Science Letters 16 (3):246–52. doi:https://doi.org/10.1002/asl2.549.
- Fiddes, S. L., and B. Timbal. 2016. Assessment and reconstruction of catchment streamflow trends and variability in response to rainfall across Victoria, Australia. Climate Research 67 (1):43–60. doi:https://doi.org/10.3354/cr01355.
- Foster, L. M., L. A. Bearup, N. P. Molotch, P. D. Brooks, and R. M. Maxwell. 2016. Energy budget increases reduce mean streamflow more than snow-rain transitions: Using integrated modeling to isolate climate change impacts on Rocky Mountain hydrology. Environmental Research Letters 11 (4):044015. doi:https://doi.org/10.1088/1748-9326/11/4/044015.
- Frost, A. J., A. Ramchurn, and A. Smith. 2018. The Australian landscape water balance model (AWRA-L v6). Bureau of Meteorology Technical Report, Technical Description of the Australian Water Resources Assessment Landscape model version 6. http://www.bom.gov.au/water/landscape/assets/static/publications/AWRALv6_Model_Description_Report.pdf.
- Green, K., and C. M. Pickering. 2009. The decline of snowpatches in the Snowy Mountains of Australia: Importance of climate warming, variable snow, and wind. Arctic, Antarctic, and Alpine Research 41 (2):212–18. doi:https://doi.org/10.1657/1938‐4246‐41.2.212.
- Hammond, J. C., F. A. Saavedra, and S. K. Kampf. 2018. How does snow persistence relate to annual streamflow in mountain watersheds of the Western U.S. with wet maritime and dry continental climates? Water Resources Research 54 (4):2605–23. doi:https://doi.org/10.1002/2017WR021899.
- Hope, G., R. Nanson, and P. Jones. 2012. Peat-forming bogs and fens of the Snowy Mountains of NSW. Technical Report, Office of Environment and Heritage, Sydney. https://www.environment.nsw.gov.au/-/media/OEH/Corporate-Site/Documents/Parks-reserves-and-protected-areas/Types-of-protected-areas/peat-forming-bogs-and-fens-snowy-mountains-technical-report-120257.pdf.
- Jepsen, S. M., T. C. Harmon, D. L. Ficklin, N. P. Molotch, and B. Guan. 2018. Evapotranspiration sensitivity to air temperature across a snow-influenced watershed: Space-for-time substitution versus integrated watershed modeling. Journal of Hydrology 556:645–59. doi:https://doi.org/10.1016/j.jhydrol.2017.11.042.
- Jones, D. A., W. Wang, and R. Fawcett. 2009. High-quality spatial climate data-sets for Australia. Australian Meteorological and Oceanographic Journal 58:233–48. doi:https://doi.org/10.22499/2.5804.003.
- Leblanc, M., S. Tweed, A. van Dijk, and B. Timbal. 2012. A review of historic and future hydrological changes in the Murray-Darling Basin. Global and Planetary Change 80–81:226–46. doi:https://doi.org/10.1016/j.gloplacha.2011.10.012.
- López‐Moreno, J. I. 2005. Recent variations of snowpack depth in the central Spanish Pyrenees. Arctic, Antarctic, and Alpine Research 37 (2):253–60. doi:https://doi.org/10.1657/1523-0430(2005)037[0253:RVOSDI]2.0.CO;2.
- López-Moreno, J. I., S. Gascoin, J. Herrero, E. A. Sproles, M. Pons, E. Alonso-González, et al. 2017. Different sensitivities of snowpacks to warming in Mediterranean climate mountain areas. Environmental Research Letters 12:074006. doi:https://doi.org/10.1088/1748‐9326/aa70cb.
- McGowan, H. A., J. N. Callow, J. Soderholm, G. McGrath, M. Campbell, and J. Zhao. 2018. Global warming in the context of 2000 years of Australian alpine temperature and snow cover. Scientific Reports 8 (1):4394. doi:https://doi.org/10.1038/s41598-018-22766-z.
- McGowan, H. A., S. K. Marx, J. Denholm, J. Soderholm, and B. S. Kamber. 2009. Reconstructing annual inflows to the headwater catchments of the Murray River, Australia, using the Pacific Decadal Oscillation. Geophysical Research Letters 36 (6):L06707. doi:https://doi.org/10.1029/2008GL037049.
- McNamara, J. P., D. Chandler, M. Seyfried, and S. Achet. 2005. Soil moisture states, lateral flow, and streamflow generation in a semi-arid, snowmelt-driven catchment. Hydrological Processes 19 (20):4023–38. doi:https://doi.org/10.1002/hyp.5869.
- Merz, R., G. Blöschl, and J. Parajka. 2006. Spatio-temporal variability of event runoff coefficients. Journal of Hydrology 331 (3–4):591–604. doi:https://doi.org/10.1016/j.jhydrol.2006.06.008.
- Musselman, K. N., M. P. Clark, C. Liu, K. Ikeda, and R. Rasmussen. 2017. Slower snowmelt in a warmer world. Nature Climate Change 7 (3):214–19. doi:https://doi.org/10.1038/NCLIMATE3225.
- Nicholls, N. 2005. Climate variability, climate change and the Australian snow season. Australian Meteorological Magazine 54:177–85.
- Nolin, A. W., and C. Daly. 2006. Mapping “at risk” snow in the Pacific Northwest. Journal of Hydrometeorology 7 (5):1164–71. doi:https://doi.org/10.1175/JHM543.1.
- Pepler, A. S., B. Trewin, and C. Ganter. 2015. The influences of climate drivers on the Australian snow season. Australian Meteorological and Oceanographic Journal 65:195–205. doi:https://doi.org/10.22499/2.6502.002.
- Petersky, R., and A. Harpold. 2018. Now you see it, now you don’t: A case study of ephemeral snowpacks and soil moisture response in the Great Basin, USA. Hydrology and Earth System Sciences 22 (9):4891–906. doi:https://doi.org/10.5194/hess-22-4891-2018.
- Rasmussen, R., B. Baker, J. Kochendorfer, T. Meyers, S. Landolt, A. P. Fischer, J. Black, J. M. Thériault, P. Kucera, D. Gochis, et al. 2012. How well are we measuring snow: The NOAA/FAA/NCAR winter precipitation test bed. Bulletin of the American Meteorological Society 93 (6):811–29. doi:https://doi.org/10.1175/BAMS‐D‐11‐00052.1.
- Reinfelds, I., E. Swanson, T. Cohen, J. Larsen, and A. Nolan. 2014. Hydrospatial assessment of streamflow yields and effects of climate change: Snowy Mountains, Australia. Journal of Hydrology 512:206–20. doi:https://doi.org/10.1016/j.jhydrol.2014.02.038.
- Safeeq, M., S. Shukla, I. Arismendi, G. E. Grant, S. L. Lewis, and A. Nolin. 2016. Influence of winter season climate variability on snow-precipitation ratio in the western United States. International Journal of Climatology 36 (9):3175–90. doi:https://doi.org/10.1002/joc.4545.
- Sanecki, G. M., K. Green, H. Wood, and D. Lindenmayer. 2006. The characteristics and classification of Australian snow cover: An ecological perspective. Arctic, Antarctic, and Alpine Research 38 (3):429–35. doi:https://doi.org/10.1657/1523-0430(2006)38[429:TCACOA]2.0.CO;2.
- Stewart, I. T. 2009. Changes in snowpack and snowmelt runoff for key mountain regions. Hydrological Processes 23 (1):78–94. doi:https://doi.org/10.1002/hyp.7128.
- Stromsoe, N., S. K. Marx, J. N. Callow, H. A. McGowan, and H. Heijnis. 2016. Estimates of late Holocene soil production and erosion in the Snowy Mountains, Australia. Catena 145:68–82. doi:https://doi.org/10.1016/j.catena.2016.05.013.
- Sturm, M., J. Holmgren, and G. E. Liston. 1995. A seasonal snow cover classification system for local to global applications. Journal of Climate 8:1261–1283. doi:https://doi.org/10.1175/1520-0442(1995)008<261:assccs>2.0.CO;2
- Theobald, A., H. McGowan, and J. Speirs. 2016. Trends in synoptic circulation and precipitation in the Snowy Mountains region, Australia, in the period 1958–2012. Atmospheric Research 169:434–48. doi:https://doi.org/10.1016/j.atmosres.2015.05.007.
- van Dijk, A. I. J. M., H. E. Beck, R. S. Crosbie, R. A. M. de Jeu, Y. Y. Liu, G. M. Podger, B. Timbal, and N. R. Viney. 2013. The Millennium Drought in southeast Australia (2001–2009): Natural and human causes and implications for water resources, ecosystems, economy, and society. Water Resources Research 49 (2):1040–57. doi:https://doi.org/10.1002/wrcr.20123.
- Viviroli, D., H. H. Dürr, B. Messerli, M. Meybeck, and R. Weingartner. 2007. Mountains of the world, water towers for humanity: Typology, mapping, and global significance. Water Resources Research 43 (7):W07447. doi:https://doi.org/10.1029/2006WRR005653.
- Wang, R., M. Kumar, and T. E. Link. 2016. Potential trends in snowmelt-generated peak streamflows in a warming climate. Geophysical Research Letters 43:5052–5059. doi:https://doi.org/10.1002/2016GL068935.
- Wang, S., J. Huang, D. Yang, G. Pavlic, and J. Li. 2015. Long-term water budget imbalances and error sources for cold region drainage basins. Hydrological Processes 29 (9):2125–36. doi:https://doi.org/10.1002/hyp.10343.
- Zhang, D., Z. Cong, G. Ni, D. Yang, and S. Hu. 2015. Effects of snow ratio on annual runoff within the Budyko framework. Hydrology and Earth System Sciences 19 (4):1977–92. doi:https://doi.org/10.5194/hess-19-1977-2015.