
 ?Mathematical formulae have been encoded as MathML and are displayed in this HTML version using MathJax in order to improve their display. Uncheck the box to turn MathJax off. This feature requires Javascript. Click on a formula to zoom.
ABSTRACT
Climate change in the Arctic is predicted to drastically alter carbon and nutrient pools, plant communities, and plant–animal interactions. We examined how four levels of long-term (16 years) nutrient addition in moist acidic tundra affected plant community structure and the abundance of Eriophorum vaginatum, the preferred forage for tundra voles (Microtus oeconomus). We also explored how simulated press and pulse herbivory for four years affected Eriophorum at these different nutrient levels. Shifts in plant community structure, reductions in species diversity and richness, and decreased Eriophorum abundance were pronounced at the highest levels of nutrient addition. Eriophorum abundance was negatively correlated with deciduous shrub abundance, likely caused by light limitation in fertilized plots. Added nutrients generally increased Eriophorum leaf length, but effects varied among years and simulated herbivory treatments. After being clipped once, Eriophorum leaves regrew in fertilized plots to the same length as leaves that had not been clipped, demonstrating recovery. Our results show how interannual variation in plant growth and animal activity might exacerbate or dampen responses over multiple years. Changes to plant community composition and plant–vole interactions associated with increased soil nutrients resulting from warming could have cascading impacts on arctic ecosystems and carbon cycling.
Introduction
Arctic ecosystems are critical regions of the Earth for numerous reasons, including storing substantial amounts of carbon (C) in their soils (Gorham Citation1991; Zimov et al. Citation2006). Climate change threatens this vital C sink as warming is occurring in the Arctic at three to four times the global average rate (Arctic Monitoring and Assessment Programme Citation2021; Rantanen et al. Citation2022), which could have far-reaching consequences for regional and global C cycles. Increased permafrost thaw (Zimov et al. Citation2006) and subsequent deepening of the active layer (Pithan and Mauritsen Citation2014) will support greater microbial activity and increase C loss from arctic soils to the atmosphere as a by-product of respiration (Schuur et al. Citation2009; Natali et al. Citation2011). Additionally, this increased decomposition of organic material will mineralize inorganic nutrients and thus increase soil nutrient availability (Schuur et al. Citation2015).
Woody plant species have historically made up a relatively small fraction of plant abundance in low-stature arctic tundra plant communities. However, rising temperatures and the resulting increased thaw depth and soil nutrient availability promote woody shrub growth (Sturm, Charles, and Tape Citation2001; Stow et al. Citation2004) leading to increased shrub abundance across many areas of the Arctic (Elmendorf et al. Citation2012; Kleinhesselink, Magnoli, and Cushman Citation2014; Myers-Smith et al. Citation2019). Areas with greater shrub abundance have been shown to trap more snow in the winter, leading to increased winter soil temperatures, and conversely, decreased soil temperatures and potential reductions in permafrost thaw in the summer due to greater shading effects (Myers-Smith et al. Citation2011; Heijmans et al. Citation2022). This growth of woody shrubs (C fertilization hypothesis) may increase above- and belowground C storage in the Arctic (Camill et al. Citation2001). Thus, greater shrub abundance can affect multiple ecosystem processes, including carbon cycling.
Over time in nutrient addition experiments in Alaskan moist acidic tundra (MAT), the community shifts to being dominated by erect deciduous shrubs following an initial increase in abundance of most species (Shaver et al. Citation2001). Two species [Betula nana, a deciduous shrub (hereafter, Betula), and Rubus chamaemorus, a forb] dominate, reducing species diversity and richness and resulting in greater aboveground net primary productivity (ANPP; Hobbie, Gough, and Shaver Citation2005; Shaver et al. Citation2014). The species that decrease in abundance include Eriophorum vaginatum (hereafter, Eriophorum), a tussock-forming sedge that is a vital source of food and shelter for voles and plays an important role in regional C cycling (Curasi et al. Citation2022).
Plant–herbivore interactions can be critical in structuring plant communities in northern regions and might affect how vegetation responds to climate change (e.g., Christie et al. Citation2015; Gough and Johnson Citation2018; Roy et al. Citation2020; Mekonnen et al. Citation2021; Koltz, Gough, and McLaren Citation2022). Small herbivores like tundra voles (Microtus oeconomus) or lemmings (Dicrostonyx spp.) can exhibit strong top-down controls on arctic ecosystems by altering plant species composition (Tuomi et al. Citation2018), and their nonconsumptive activities can affect local nutrient availability (e.g., Roy et al. Citation2022). Unlike other herbivores in the Arctic, voles can exert year-round impacts on their local environment, as they do not hibernate in the winter. Voles also have high metabolisms and low digestive efficiencies, meaning they must consume several times their body weight in food per day (Ims and Fuglei Citation2005). These rodents tend to have three to four year boom–bust population cycles (Ims and Fuglei Citation2005; Olofsson, Tommervik, and Callaghan Citation2012) that can stochastically and sometimes dramatically impact plant communities and regional C cycling (Min et al. Citation2021; Rastetter et al. Citation2021). During a boom, rodents can cause a significant amount of damage to plants through herbivory and other activities. Following a boom, plant biomass can be as much as 12 to 24 percent lower than in the previous year, potentially altering C stocks at a regional scale, the effects of which can be observed from space via satellite imagery (Olofsson, Tommervik, and Callaghan Citation2012). This short-term, high-level herbivory pressure, followed by several years of sustained low-level herbivory, can be considered a ‘pulse’ event. By contrast, a ‘press’ event would occur if there were several years of sustained high rodent populations and accompanying herbivory pressure.
Climate change is expected to negatively affect small rodent populations (Batzli and Henttonen Citation1990) and might alter historic boom–bust population cycles as has been seen for some lemming populations (e.g., Schmidt et al. Citation2012). In the winter, voles and lemmings rely on the safety and insulation of the subnivean zone (the area between the top of the snowpack and the surface of the ground) for survival. The subnivean zone allows these small rodents to freely move around and access their food while under a layer of protection against harsh winter weather conditions like frigid temperatures, wind, and rain. For these reasons, they favor areas that accumulate a thicker snowpack in the winter (Fauteux et al. Citation2015; Reid et al. Citation2012); depending on the rodent species, greater shrub abundance may improve winter habitat for the animals by trapping more snow (Steketee et al. Citation2022). As the Arctic continues to warm, winter conditions will become less favorable by becoming warmer and more variable (Ims and Fuglei Citation2005). Warming temperatures contribute to increased rainfall that can reduce snowpack depths by melting existing snow, changing snow density, and decreasing snow accumulation. Reduced snowpack depth increases the risk of small mammals being exposed to extreme winter weather conditions, which could be detrimental to their survival (Aars and Ims Citation2002; Pitelka and Batzli Citation2007).
Tundra plant species vary greatly in their susceptibility to herbivory by small mammals. Eriophorum is a well-studied tussock-forming sedge that accounts for a significant portion of the biomass in MAT (Shaver, Chapin, and Gartner Citation1986) and contributes to regional C stocks (Curasi et al. Citation2022). Tundra voles rely on this species for food and shelter, often selectively foraging for sedges over woody shrubs (Batzli and Lesieutre Citation1991; Christie et al. Citation2015). Eriophorum tolerates herbivory by increasing leaf production after a defoliation event (e.g., Archer and Tieszen Citation1983). However, tolerance to herbivory and recovery after defoliation might be reduced when subjected to fertilization (Johnson and Gough Citation2013), likely because of a shift in competitive interactions with other plant species (although also see Grogan and Zamin Citation2018). While Eriophorum can tolerate both nutrient addition (Heskel et al. Citation2012) and warmer temperatures (Tissue and Oechel Citation1987), this species can be outcompeted by other plants, especially woody shrubs, under those conditions (Heskel et al. Citation2013; Shaver et al. Citation2014), potentially because of reduced light availability (Fetcher Citation1985). Fertilization enriches Eriophorum leaf nitrogen (N) content, making it more palatable, and increases foraging benefit, which can lead to increased herbivory rates (Gough, Ramsey, and Johnson Citation2007; Gough et al. Citation2008; Citation2012; Tuomi et al. Citation2018). This suggests that climate change might lead to compounding negative effects on Eriophorum’s photosynthetic capacity and overall success by increasing interspecific plant competition for light availability and herbivory rates.
The goal of this study was to examine how MAT plant community composition and Eriophorum’s response to simulated rodent herbivory are affected by soil nutrient availability. Unlike most previous studies in Alaskan MAT, here we examined multiple levels of soil nutrients. Based on earlier studies, we hypothesized (H1) that with increasing levels of nutrient addition, plant communities will have more pronounced shifts toward the dominance of deciduous shrubs (specifically Betula) and reduced Eriophorum abundance. We quantified this by examining relative cover, species richness, and diversity over 16 years in plots receiving one of four different levels of nutrient addition. We also hypothesized (H2) that fertilization would not affect the ability of Eriophorum to recover from simulated vole herbivory. We tested H2 by implementing a 4-year simulated herbivory experiment across this nutrient addition gradient with both pulse (clipped once) and press (clipped annually) herbivory treatments.
Methods
A nutrient addition gradient experiment in MAT was established by the Arctic Long-Term Ecological Research project in 2006 at Toolik Field Station, located in the northern foothills of the Brooks Range, Alaska, USA (68.63, 149.60). Soils in this region are moist and mainly glacial till and outwash from glacial advances approximately 60,000 years before the present (Hobbie and Kling Citation2014). The region is snow-covered for two-thirds of the year, and the maximum thaw depth ranges from ~0.25-1.0 m during summers. The growing season in this region is short, typically ranging between 120-126 days, starting around mid-May until mid-September (Cherry et al. Citation2014). Over the past several decades there has been no consistent warming trend documented in this area (https://www.uaf.edu/toolik/edc/). Tussock-forming sedges (Eriophorum vaginatum), deciduous shrubs (Betula nana), ericaceous evergreens (Rhododendron tomentosum and Vaccinium vitis-idaea), and mosses (Sphagnum spp.) dominate the vegetation at this site (Shaver et al. Citation2014, Table S1). Most of the previous nutrient addition experiments conducted on MAT have included only one high level of fertilization (N 10 g/m2/yr and P 5 g/m2/yr) (Shaver et al. Citation2014). The MAT nutrient addition gradient used in this study was established to monitor the response of the plant community to a range of nutrient addition levels described below.
Nutrient addition
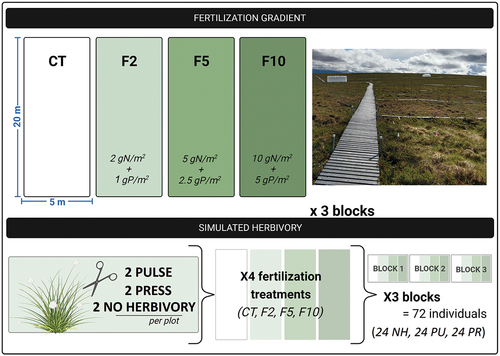
The MAT nutrient gradient experiment consists of blocks of 5 × 20 m plots that are assigned different fertilization treatments (). Control plots (CT) receive no fertilizer, F2 receives 2 gN/m2/yr + 1 gP/m2/yr, F5 receives 5 gN/m2/yr + 2.5 gP/m2/yr, and F10 receives 10 gN/m2/yr + 5 gP/m2/yr (Prager et al. Citation2017; Suchocki Citation2020). Plots are fertilized annually with granular sodium nitrate, ammonium chloride, and triple superphosphate at the beginning of the growing season when the plots are free of snow (prior to 2012, N was applied solely in the form of ammonium nitrate). All these nutrient amendments are likely greater than the amount of additional N being mobilized by increased rates of decomposition resulting from warming in this plant community [estimated by Prager et al. (Citation2017) as ~0.3 gN/m2/yr].
Figure 1. Nutrient addition gradient study with simulated herbivory experimental design in three blocks, each containing four 5 × 20 m fertilization plots (CT, F2, F5, and F10). Each fertilization plot has two no-herbivory (NH), two pulse (PU), and two press (PR) individual tussocks.
Plant community sampling
In mid to late July from 2008-2021 (except for 2009), relative vascular plant abundance was estimated to species or genus in the four nutrient level treatments in blocks 1-3 of this experiment. The relative abundance of mosses, lichens, and nonliving groups, including plant litter, bare ground (including frost boils and standing water), and woody standing dead plant tissues (mainly deciduous shrub die-off), were also estimated. A permanent 8 × 1 m long monitoring area was established in 2008 on the northern side of each plot. Along this area, eight 1 m2 quadrats were aligned roughly 0.2 m in from the edge of the plots, and aerial percent cover was estimated for each species/group (only four quadrats were used per plot in 2008, and five quadrats per plot in 2015 and 2020). To determine relative abundance, the percent cover of individual species/groups was divided by the sum of all percent cover within a quadrat. Plants were identified to species, then consolidated into growth forms (deciduous shrubs, evergreen shrubs, graminoids, and forbs; see Table S1) except for Eriophorum, which was excluded from the graminoid group and evaluated independently.
Diversity was calculated with the data at the species level using the Shannon Diversity Index (EquationEquation 1(1)
(1) ). Species richness and diversity were calculated at a 1 m2 level from the cover quadrats.
EquationEquation 1(1)
(1) : Where H is diversity, i is one species, pi is the proportion of the entire community made up of species i, S is the total number of species in the plot.
Simulated herbivory
In 2018, we established a simulated herbivory experiment within the fertilization gradient to examine the effects of leaf removal on Eriophorum (Suchocki Citation2020; Williamson Citation2022). Six Eriophorum tussocks with no discernable signs of vole herbivory were randomly selected in every plot, except in the F2 treatment in Block 3 where there were no tussocks in the sampling area (N = 66). Two Eriophorum tussocks were randomly assigned to one of three herbivory treatments (NH: no herbivory, PU: pulse or PR: press). This provided a total of six replicates for each of the twelve possible combinations of fertilization and simulated herbivory treatments, except for the F2 treatments that only had four replicates (). In late June 2018, the leaves (and any other species of plant growing on the tussock) of each tussock in a pulse or press treatment were cut to the base of the leaf and removed. This process was repeated in 2019, 2020, and 2021 for the press treatment, while the pulse treatment was allowed to recover.
Six tillers (ten in 2021) from each Eriophorum tussock were randomly selected for measurement. Selected tillers were fitted with metal identification tags, given unique identifiers, and monitored for the duration of the growing season. If a tag fell off, a new tiller was randomly selected to maintain a total of six tillers (ten in 2021) per Eriophorum tussock. Tags were removed from press treatments before leaves were cut, and new tillers were selected following each simulated herbivory event. The length of the longest green leaf within a tiller was measured for all treatments every 2 weeks for the duration of the growing season (about 8 weeks), except in 2020, when leaf lengths were collected only once at peak season (in late July) because of staffing and travel limitations during the COVID-19 pandemic.
Statistics
Statistical analysis was performed with R version 4.0.3 (2020). Statistical significance was evaluated at an alpha level of 0.05. A multivariate analysis of variance was used to test significant differences among mean relative abundance of live plant growth forms and Eriophorum (excluding plant litter, bare ground, and woody-standing dead) among fertilization treatments for 2008 and 2021 (run independently) to provide a comparison between the start of the experiment and 16 years of treatment. Similarly, species richness and diversity were analyzed separately for 2008 and 2021 as a one-way analysis of variance (ANOVA) to compare treatment effects in these 2 years. Linear regressions were used to test the relationships between the relative abundance of Eriophorum and deciduous shrubs among the fertilization treatments. Two-way ANOVA with interaction was used to test differences in peak season leaf lengths among simulated herbivory and fertilization treatments (each year tested independently of the others). If the ANOVA showed significant differences among treatments or the interaction, the means were compared using Tukey’s honestly significant difference.
Results
Plant community response to nutrient addition
In 2008, after 2 years of nutrient addition, there was little difference in mean relative abundance for most functional groups across nutrient addition treatments (). However, moss and Eriophorum had significantly different mean relative abundances across the fertilization treatments (Table S2). Eriophorum abundance was greater under the highest levels of nutrient addition (F5 and F10) compared to the CT and F2 treatments, while moss had the opposite trend ().
Figure 2. Mean (n = 3) relative cover of growth forms/species among years (2008–2021) and fertilization treatments (see for nutrient levels). Relative cover was not measured in 2009, and F2 treatments were not sampled in 2010 and 2011.
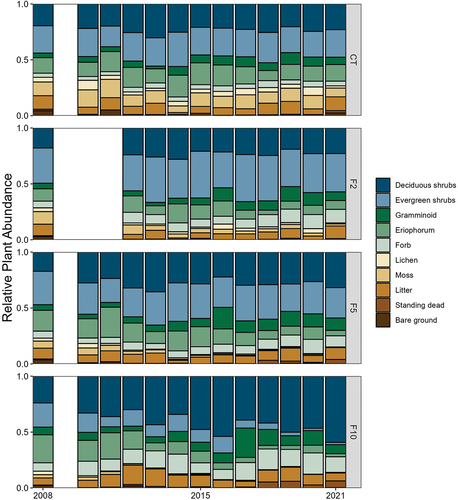
Fourteen years later (2021), much of the plant community had shifted in response to fertilization, most dramatically in the F10 treatment (, Table S2). Although we did not measure productivity or biomass in this study, NDVI (Normalized Difference Vegetation Index) data suggest that aboveground biomass of vascular plants was greatest in the F10 treatment (Williamson Citation2022; Figure S1), like results from older experiments at this site in which ANPP significantly increased in response to F10 treatments (Shaver et al. Citation2014). As in 2008, the relative abundance of moss in 2021 continued to be significantly lower in the fertilized treatments compared to the control (Table S2). Eriophorum, however, had the opposite trend, seen in 2008, tending to have a lower relative abundance in the fertilized treatments compared to the control. Evergreen shrubs also had significantly lower abundance as fertilization increased, while lichen and graminoids (not including Eriophorum) were not affected (). Deciduous shrubs (of which Betula comprised more than 70 percent with almost 100 percent in F10) and forbs (dominated primarily by Rubus) were the only living growth forms to increase in abundance in response to nutrient addition, although this was only significant for deciduous shrubs. By 2021, deciduous shrubs made up over half of the relative abundance in the F10 plots, compared to about a quarter in F10 plots in 2008 (). No differences in relative abundance of litter, woody standing dead, or bare ground were detected across fertilization treatments or years.
In 2008, mean species richness was similar across the control and all fertilization treatments (; fertilization treatment not significant). By 2021, richness had declined in the F5 and F10 treatments, while the control and F2 treatments remained relatively unchanged (main effect of fertilization: F3,8 = 25.2, p < .001; ). This effect was most pronounced within the F10 treatment, which saw a loss of over half the number of species documented in 2008. Several plant species went locally extinct in the F10 treatment by 2021, all of which occurred in low relative abundance in control plots (Table S1), including two deciduous shrub species (Arctostaphylos alpina and Vaccinium uliginosum), one evergreen shrub (Cassiope tetragona), and one forb (Pedicularis sp.). Shannon diversity had similar trends where there was no difference in diversity across the nutrient addition treatments in 2008, but diversity was significantly lower in the F5 and F10 treatments compared to CT and F2 in 2021 (, main effect of fertilization in 2021: F3,8 = 36.1, p < .0001).
Table 1. Mean (n = 3; ± SD) species richness and Shannon diversity index per 1 m2 by fertilization level (see for treatment abbreviations) for the years 2008 and 2021. Superscript letters indicate means were significantly different within year.
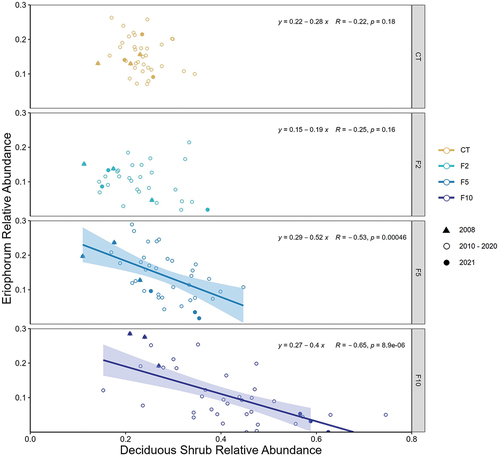
Negative correlations between deciduous shrub (dominated by Betula) and Eriophorum relative abundance occurred across all treatments; however, they were only significant under the highest levels of nutrient addition, F5 and F10 (). Notably, the range of relative deciduous shrub abundance increased with the level of fertilization (0.15–0.75 in the F10 treatment compared to 0.14–0.34 in the CT). In the F10 treatments, relative deciduous shrub abundance in 2008 (solid triangles; ) was between 0.2 and 0.3, while in 2021 (solid circles) shrub abundance was always over 0.5. A similar, but less dramatic trend was seen in the F5 treatment. This increase in relative shrub abundance over time in the F5 and F10 treatments is responsible for driving the negative relationship as Betula abundance increased and Eriophorum abundance decreased. In the CT treatment, values from 2008 and 2021 are clustered together, indicating little to no change in deciduous shrub or Eriophorum cover over time.
Figure 3. Correlation between deciduous shrub and Eriophorum relative cover in each fertilization treatment. Each point represents the average for one block (n = 8 quadrats within block) for 3 points per treatment per year (2008–2021). Confidence interval around regression line is SE.
Eriophorum recovery from herbivory
In general, leaf growth was measured across the growing season as either an increase or no change compared to the first measurement. In some cases, mean leaf length fluctuated within a growing season because of new leaves being selected if tags fell off or the tip of a leaf started to senesce, reducing the live length ().
Figure 4. Mean (± SD, n = 3 except in F2 n = 2) Eriophorum tiller heights (cm) among simulated herbivory and fertilization treatments (see for treatment abbreviations) over four growing seasons (2018–2021). Note that tiller heights were only measured once in 2020 due to COVID-19 restrictions.
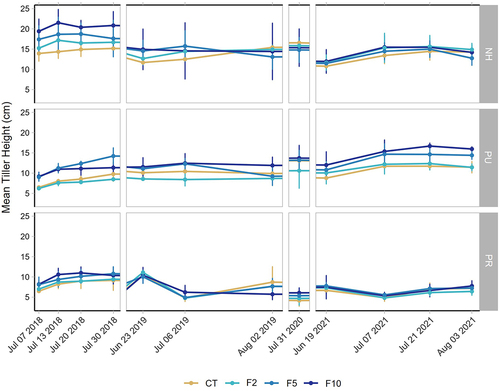
The seasonal pattern of growth in the 3 years for which multiple dates were sampled generally did not differ across fertilization treatments. The tussocks that were not subjected to clipping (NH) showed a positive effect of fertilization on leaf length in 2018, but in the other years leaf lengths were lower overall, and there was little effect of fertilization. The PU treatment had longer tillers in the F5 and F10 treatments across all years, whereas the PR tussocks were generally not able to regrow following clipping in any of the fertilization treatments ().
The effects of the treatments on leaf length at the final measurement from each growing season differed in 2018 and 2021. In 2018, a marginally significant interaction effect was found between clipping and fertilization (F6,53 = 2.21, p = .06, ). This occurred because the NH leaves grew longer with greater nutrients, the PU tillers in F5 and F10 also grew longer than the other two fertilization treatments, but the PR leaves were not affected by fertilization. Leaf lengths were significantly different among the simulated herbivory treatments as well (main effect of clipping: F2,53 = 60.0, p < .0001). PR and PU were significantly shorter than NH (p < .001 for both treatments) but were not different from each other (p = .26). Leaf lengths were also significantly affected by fertilization (main effect of fertilization: F3,53 = 5.82, p < .001). F10 and F5 fertilization treatments had significantly longer final measurement leaf lengths compared to the control (p = .01) but were not significantly different from each other or the F2 treatment ().
Figure 5. Final tiller heights (n = 3 except n = 2 in F2) among simulated herbivory and fertilization treatments for four growing seasons (2018–2021; treatment abbreviations in ). Xs indicate means; letters indicate significant differences among the means caused by a significant interaction between herbivory and fertilization in 2021.
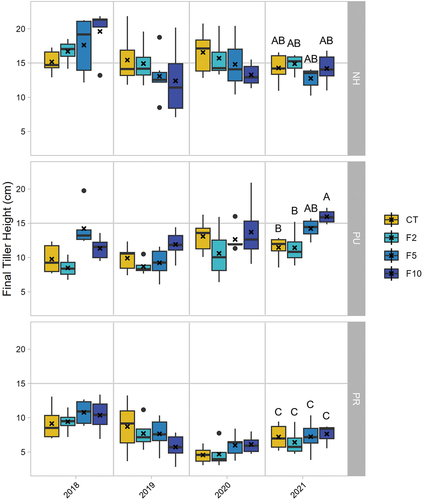
In 2021, the fourth year of the simulated herbivory experiment, a significant interaction effect was found between clipping and fertilization (F6,51 = 3.30, p = .008, ). Fertilization resulted in different leaf lengths within the PU treatment but not the NH or PR treatments. In the PU herbivory treatment, Eriophorum in the F10 fertilization plot produced significantly longer leaves compared to CT and F2, but none were significantly different from F5. In addition, the PU leaves in F5 and F10 grew to similar lengths as the NH leaves in all fertilization treatments, demonstrating recovery (). PR Eriophorum produced significantly shorter leaves compared to all other treatments because of annual clipping. Leaf lengths were also found to be significantly different among simulated herbivory treatments in 2021 (main effect of clipping: F2,51 = 90.6, p < .0001). PR and PU were significantly shorter than NH (p < .001 for both treatments) but were not significantly different from each other (p = .59). Leaf lengths were also found to be significantly affected by fertilization (main effect of fertilization: F3,51 = 2.98, p = .04). Eriophorum in F10 fertilization plots produced significantly longer leaves compared to the CT (p = .04), but not when compared to any other fertilization treatment.
Discussion
Plant community composition shifted toward Betula dominance and decreased Eriophorum in response to fertilization
The MAT plant community was significantly altered by nutrient addition over the course of 16 years, with a notable decrease in relative Eriophorum abundance. The magnitude of the shift depended on the level of fertilization, and thus supports our first hypothesis. Our results agree with previous studies that used the F10 level of nutrient addition in MAT and showed an increase in ANPP resulting from the increase in Betula (e.g., Shaver et al. Citation2001; Mack et al. Citation2004; Hobbie, Gough, and Shaver Citation2005). By 2021, the relative abundance of deciduous shrubs (driven by the increase of Betula) was significantly greater in the F5 and F10 treatments compared with the CT and F2 treatments. Added nutrients resulted in significantly more soil ammonium and nitrate availability in the F5 and F10 plots in 2021 compared with CT and F2 (M. Wilcots, unpublished data), and this difference in available N may be responsible for the more dramatic vegetation shifts in the higher nutrient treatments. Betula can quickly accumulate a significant height advantage over most other MAT species when fertilized because of rapid branching and sturdy wooden structures that support increased canopy area (Bret-Harte et al. Citation2001). Betula also appears to have a leaf-level physiological advantage over Eriophorum under both ambient and increased soil nutrient conditions (Heskel et al. Citation2013; Prager et al. Citation2020).
In response to fertilization, the only other growth forms/groups to increase in relative abundance were forbs (primarily Rubus) and standing dead (also dominated by Betula, particularly in the F10 where Betula comprised 97 percent of standing dead cover in 2021), although this change was not statistically significant for forbs. Rubus has been found to respond positively to nutrient addition in other MAT experiments (Shaver et al. Citation2014), creating an understory layer beneath the taller Betula shrubs. Greater standing dead Betula in the F5 and F10 plots likely resulted from winter frost exposure as the shrubs extend above the snow or disease, although the exact cause remains uncertain. This die-off suggests that Betula may not be able to maintain long-term dominance even with greater soil nutrient availability. Most of the other growth forms (evergreen shrubs, Eriophorum, lichen, moss, and bare ground) decreased significantly in response to fertilization likely caused by increased shading from deciduous shrubs, resulting in the species richness and diversity decline in MAT over time.
Although only significant in the F5 and F10 treatment, Eriophorum abundance was negatively associated with Betula abundance, and this relationship intensified as the nutrient addition continued over time. Eriophorum abundance was higher in the F10 treatment in 2008 compared with the control, reflecting a short-term positive growth response to added nutrients before the shrubs were able to grow tall enough to outcompete this species (also see Shaver et al. Citation2001). Eriophorum growth was reduced when artificially shaded (Chapin and Shaver Citation1985), and this species increased productivity and biomass more under fertilization when Betula was removed (Bret‐Harte et al. Citation2004, Citation2008). At a landscape scale, a recent remote sensing study found that across Alaska and part of northwestern Canada, deciduous shrubs are increasing at the expense of graminoids (Macander et al. Citation2022), and another study determined that Eriophorum is decreasing in abundance across much of Alaska (Curasi et al. Citation2022), which could also be correlated with increased shrub abundance.
At the level of the individual tiller in the NH treatment, the effect of fertilization on Eriophorum leaf length was mixed. In the first year of the experiment (2018), fertilization caused an incremental increase of leaf length with added nutrients as expected (), consistent with similar studies that reported greater leaf lengths under fertilization (Shaver, Chapin, and Gartner Citation1986; Shaver and Laundre Citation1997; Johnson and Gough Citation2013) and in warming treatments (e.g., Hobbie, Shevtsova, and Chapin Citation1999). However, in the other three years, growth of NH tillers was not consistently greater with fertilization. Eriophorum might have been increasing its production in other ways, such as increasing tiller number (Shaver and Laundre Citation1997). In addition, because of the heterogeneity of tussocks occurring on the landscape, biomass of Eriophorum often does not significantly differ between control and fertilized plots (e.g., Shaver et al. Citation2014), so, although leaf length is increasing in fertilized plots, without the establishment of new tussocks, biomass of this species at the community level may not significantly change while relative abundance declines because of the dramatic absolute and relative increase of Betula.
Another explanation for the interannual variation in leaf length we observed is that variables such as weather, herbivory, or interspecific plant competition are interacting with fertilization to prevent a positive growth response to additional nutrients. For example, Eriophorum can experience reduced growth when exposed to higher air temperatures but can have increased growth when exposed to both elevated temperatures and fertilization (Chapin and Shaver Citation1985), suggesting that growth responses might differ depending on the environmental conditions. As discussed in the previous section, woody shrubs often grow to dominate over other species in fertilized plots and can lead to understory shading that limits Eriophorum growth. In addition to increased competition for light, natural vole herbivory on Eriophorum has been found to increase with fertilization (Gough et al. Citation2012). Estimates of vole activity and vole damage to Eriophorum tussocks in the treatment plots sampled here did not detect significant differences across soil nutrient levels (data not shown); effects were heterogeneous and patchy even in relatively high vole abundance years. Snap trap and mark-recapture estimates suggest that vole populations in this area were low in 2017 and 2018 and higher in 2019–2021 (J. Steketee, personal communication, 10 October 2023). This suggests that natural vole activity could potentially have affected our results. The combined negative impacts on Eriophorum growth from plant competition and increased vole activity could lead to suppressed leaf growth responses in fertilized plots.
Nutrient addition does not always support Eriophorum recovery from vole herbivory
In the fourth year of the simulated herbivory experiment, there were inconsistent responses in Eriophorum leaf length to simulated herbivory and nutrients. In addition, the pulse and press treatments resulted in different responses. For the press treatment, our results supported our second hypothesis that added nutrients did not affect Eriophorum recovery from repeated clipping. In 2018, after a single year of clipping, there was a suggestion that leaves on tussocks in the higher fertilization plots were able to recover marginally faster and achieve slightly longer lengths by peak season, mimicking the pattern in the no herbivory treatment, but there were no significant differences among treatments. After 4 years of simulated herbivory in the press treatment, there were no differences in tiller length among fertilization treatments, and on average tillers remained less than 10 cm in length compared to around 15 cm in the no herbivory plots. The results of the press treatment demonstrate that the negative impact of repeated clipping could not be overcome by increased nutrients. In other studies where leaves were clipped multiple times within a growing season, a threshold has also been demonstrated beyond which Eriophorum does not have the resources available to regrow (Chapin and Slack Citation1979) even when receiving nutrients at the F10 level (Johnson and Gough Citation2013). Thus, if herbivore pressure were to become more consistent across years, Eriophorum abundance would likely decline regionally.
In the PU treatment, however, our second hypothesis that greater nutrients would not affect Eriophorum growth following simulated herbivory was not supported after 3 years of recovery. In 2018, following the initial clipping treatment, leaves in the F5 and F10 treatments recovered faster and achieved greater lengths than those in the F2 and CT plots. In 2021, the pulse F5 and F10 leaves had recovered to approximately 15 cm in length, similar to leaves not subjected to clipping. However, the CT and F2 leaves were still shorter, demonstrating that leaves that were not able to take advantage of the higher levels of nutrients could not recover from biomass removal 4 years earlier. A similar result was seen 1 year after clipping when Eriophorum was fertilized with just N, and shoot production was still lower than leaves that had not been clipped (Grogan and Zamin Citation2018). These results suggest that Eriophorum requires significant nutrients to recover from a single clipping event after 4 years, which is an approximate cycle for voles in this region. In a similar study conducted in MAT at the F10 level after 10 years of fertilization, Eriophorum was also not able to recover from clipping after 3 years (Johnson and Gough Citation2013). In that study, adding nutrients without clipping did consistently increase leaf length. These results suggest that weather, as well as the surrounding plant community, are likely affecting the ability of Eriophorum to regrow.
Conclusion
The composition of MAT plant communities and specifically the abundance of Eriophorum are affected by soil nutrient availability (Shaver et al. Citation2014). Under the greatest levels of nutrient addition, Betula dominates the community, resulting in an overall loss of diversity and reduction in Eriophorum relative abundance. The levels of nutrient addition applied here are higher than would be likely to naturally occur with warming (Prager et al. Citation2017). Our results suggest a similar community trajectory toward dominance by Betula at lower levels of soil nutrients than F10, mirroring results from a passive warming experiment in MAT (Sistla et al. Citation2012). As the Arctic continues to warm, and soil nutrient concentrations subsequently rise, the MAT plant community will likely become woodier, as is already occurring in many regions (e.g., Myers-Smith et al. Citation2019). Depending on the scale and magnitude of these plant community composition shifts, they could potentially impact the regional carbon balance as well as small mammal herbivores like voles.
It is unclear how a warming Arctic will impact tundra vole populations. Voles rely on a thick snowpack to remain insulated from harsh winter weather conditions. Greater woody shrub abundance could therefore benefit voles in the winter, as the taller canopy provided by the shrubs can trap snow and create a thicker snowpack (also see Steketee et al. Citation2022). Voles might initially experience a dietary benefit as increased soil nutrient availability contributes to greater forage quality. However, in this study we documented that at the same time as deciduous shrubs increase in abundance, tundra voles’ preferred forage species (Eriophorum) decreases. Our results demonstrate that Eriophorum growth does not rapidly recover from herbivory events even when soil nutrients are drastically increased. Therefore, if greater forage quality promotes increased herbivory rates, it could further accelerate the decline of Eriophorum, and thus negatively affect vole populations over the long term. The role and degree of impact that small mammals will have on arctic plant communities and the C cycle are complex but have the potential to be significant.
Supplemental Material
Download Zip (1.2 MB)Acknowledgments
The authors thank many field assistants for their help in collecting these data and maintaining these experiments, particularly through the COVID-19 pandemic restrictions, including Ruby An, Lilly Conteh, Audrey Fatone, Savannah Kjaer, Peter Lamousin, Megan Muller-Girard, Nicholas Patel, Miriam Ritchie, Sunniva Sheffield, and Julian Sheppy. We thank Jim Laundre and Gus Shaver for their long-term maintenance of the Long-Term Ecological Research experiments, and Rebecca Rowe, Jennie McLaren, Kevin Griffin, Natalie Boelman, and Ed Rastetter for their collaboration and comments on this article. We also thank Megan Wilcots for sharing unpublished data, and the anonymous reviewers for comments that improved the article.
Disclosure statement
No potential conflict of interest was reported by the author(s).
Data availability statement
The data that support the findings of this study are openly available in the Arctic Long-Term Ecological Research Data Catalog at https://arc-lter.ecosystems.mbl.edu/arctic-data-catalog.
Supplementary material
Supplemental data for this article can be accessed online at https://doi.org/10.1080/15230430.2024.2356276
Additional information
Funding
References
- Aars, J., and R. A. Ims. 2002. Intrinsic and climatic determinants of population demography: The winter dynamics of tundra voles. Ecology 83, no. 12: 3449–14. doi:10.1890/0012-9658(2002)083[3449:IACDOP]2.0.CO;2.
- Archer, S., and L. L. Tieszen. 1983. Effects of simulated grazing on foliage and root production and biomass allocation in an Arctic tundra sedge (Eriophorum vaginatum). Oecologia 58, no. 1: 92–102. doi:10.1007/BF00384547.
- Arctic Monitoring and Assessment Programme. 2021. Arctic climate change update 2021: Key Trends and impacts. Summary for policy-makers. Arctic Monitoring and Assessment Programme, Tromsø, Norway 16, 148.
- Batzli, G. O., and H. Henttonen. 1990. Demography and resource use by microtine rodents near Toolik Lake. Vol. 22. Alaska, U.S.A: Arctic & Alpine Research.
- Batzli, G. O., and C. Lesieutre. 1991. The influence of high quality food on habitat use by Arctic microtine rodents. Oikos 60, no. 3: 299–306. doi:10.2307/3545071.
- Bret-Harte, M. S., E. A. García, V. M. Sacré, J. R. Whorley, J. L. Wagner, S. C. Lippert, and F. S. Chapin. 2004. Plant and soil responses to neighbour removal and fertilization in Alaskan tussock tundra. Journal of Ecology 92, no. 4: 635–47. doi:10.1111/j.0022-0477.2004.00902.x.
- Bret-Harte, M. S., M. C. Mack, G. R. Goldsmith, D. B. Sloan, J. DeMarco, G. R. Shaver, P. M. Ray, Z. Biesinger, and F. S. Chapin III. 2008. Plant functional types do not predict biomass responses to removal and fertilization in Alaskan Arctic tundra. Journal of Ecology 96, no. 4: 713–26. doi:10.1111/j.1365-2745.2008.01378.x.
- Bret-Harte, M. S., G. R. Shaver, J. P. Zoerner, J. F. Johnstone, J. L. Wagner, S. Chavez, J. A. Laundre, S. C. Lippert, and J. A. Laundre. 2001. Developmental plasticity allows Betula nana to dominate tundra subjected to an altered environment. Ecology 82, no. 1: 18–32. doi:10.2307/2680083.
- Camill, P., J. A. Lynch, J. S. Clark, J. B. Adams, and B. Jordan. 2001. Changes in biomass, aboveground net primary production, and peat accumulation following permafrost thaw in the boreal peatlands of Manitoba, Canada. Ecosystems 4, no. 5: 461–78. doi:10.1007/s10021-001-0022-3.
- Chapin, F. S., III, and G. R. Shaver. 1985. Individualistic growth response of tundra plant species to environmental manipulations in the field. Ecology 66, no. 2: 564–76. doi:10.2307/1940405.
- Chapin, F. S., III, and M. Slack. 1979. Effect of defoliation upon root growth, phosphate absorption and respiration in nutrient-limited tundra graminoids. Oecologia 42, no. 1: 67–79. doi:10.1007/BF00347619.
- Cherry, J. E., S. J. Dery, Y. Cheng, M. Stieglitz, A. S. Jacobs, F. Pan. 2014. Climate and hydrometeorology of the Toolik Lake Region and the Kuparuk River Basin: Past, present and future. In Alaska’s changing Arctic: Ecological consequences for tundra, streams, and lakes, ed. J. E. Hobbie and G. W. Kling, 21–60. New York, NY: Oxford University Press.
- Christie, K. S., J. P. Bryant, L. Gough, V. T. Ravolainen, R. W. Ruess, and K. D. Tape. 2015. The role of vertebrate herbivores in regulating shrub expansion in the Arctic: A synthesis. BioScience 65, no. 12: 1123–33. doi:10.1093/biosci/biv137.
- Curasi, S., N. Fetcher, R. E. Hewitt, P. M. Lafleur, M. M. Loranty, M. C. Mack, … A. V. Rocha. 2022. Range shifts in a foundation sedge potentially induce large Arctic ecosystem carbon losses and gains. Environmental Research Letters 17, no. 4.
- Elmendorf, S. C., G. H. Henry, R. D. Hollister, R. G. Björk, N. Boulanger-Lapointe, E. J. Cooper, … S. Wipf. 2012. Plot-scale evidence of tundra vegetation change and links to recent summer warming. Nature Climate Change 2, no. 6: 453–7. doi:10.1038/nclimate1465.
- Fauteux, D., G. Gauthier, D. Berteaux, and R. Ims. 2015. Seasonal demography of a cyclic lemming population in the Canadian Arctic. Journal of Animal Ecology 84, no. 5: 1412–22. doi:10.1111/1365-2656.12385.
- Fetcher, N. 1985. Effects of removal of neighboring species on growth, nutrients, and microclimate of Eriophorum vaginatum. Arctic and Alpine Research 17, no. 1: 7–17. doi:10.1080/00040851.1985.12004445.
- Gorham, E. 1991. Northern peatlands: Role in the carbon cycle and probable responses to climatic warming. Ecological Applications 1, no. 2: 182–95. doi:10.2307/1941811.
- Gough, L., and D. R. Johnson. 2018. Mammalian herbivory exacerbates plant community responses to increased soil nutrients in two Alaskan tundra plant communities. Arctic Science 4, no. 2: 153–66. doi:10.1139/AS-2017-0025.
- Gough, L., J. C. Moore, G. R. Shaver, R. T. Simpson, and D. R. Johnson. 2012. Above-and belowground responses of Arctic tundra ecosystems to altered soil nutrients and mammalian herbivory. Ecology 93, no. 7: 1683–94. doi:10.1890/11-1631.1.
- Gough, L., E. A. Ramsey, and D. R. Johnson. 2007. Plant-herbivore interactions in Alaskan Arctic tundra change with soil nutrient availability. Oikos 116, no. 3: 407–18. doi:10.1111/j.0030-1299.2007.15449.x.
- Gough, L., K. Shrestha, D. R. Johnson, and B. Moon. 2008. Long-term mammalian herbivory and nutrient addition alter lichen community structure in Alaskan dry heath tundra. Arctic, Antarctic and Alpine Research 40, no. 1:65–73. doi:10.1657/1523-0430(06-087)
- Grogan, P., and T. J. Zamin. 2018. Growth responses of the common Arctic graminoid Eriophorum vaginatum to simulated grazing are independent of soil nitrogen availability. Oecologia 186, no. 1: 151–62. doi:10.1007/s00442-017-3990-5.
- Heijmans, M. M. P. D., R. I. Magnusson, M. J. Lara, G. V. Frost, I. H. Myers-Smith, J. van Huissteden, … J. Limpens. 2022. Tundra vegetation change and impacts on permafrost. Nature Reviews Earth & Environment 3, no. 1: 68–84. doi:10.1038/s43017-021-00233-0.
- Heskel, M., H. Greaves, A. Kornfeld, L. Gough, O. K. Atkin, M. H. Turnbull, G. Shaver, and K. L. Griffin. 2013. Differential physiological responses to environmental change promote woody shrub expansion. Ecology and Evolution 3, no. 5: 1149–62. doi:10.1002/ece3.525.
- Heskel, M. A., O. Roger Anderson, O. K. Atkin, M. H. Turnbull, and K. L. Griffin. 2012. Leaf- and cell-level carbon cycling responses to a nitrogen and phosphorus gradient in two Arctic tundra species. American Journal of Botany 99, no. 10: 1702–14. doi:10.3732/ajb.1200251.
- Hobbie, S. E., L. Gough, and G. R. Shaver. 2005. Species compositional differences on different‐aged glacial landscapes drive contrasting responses of tundra to nutrient addition. Journal of Ecology 93, no. 4: 770–82. doi:10.1111/j.1365-2745.2005.01006.x.
- Hobbie, J. E., and G. W. Kling. 2014. Alaska’s changing Arctic: Ecological consequences for tundra, streams, and lakes. New York: Oxford Press.
- Hobbie, S. E., A. Shevtsova, and F. S. Chapin III. 1999. Plant responses to species removal and experimental warming in Alaskan tussock tundra. Oikos 84, no. 3: 417–34. doi:10.2307/3546421.
- Ims, R. A., and E. Fuglei. 2005. Trophic interaction cycles in tundra ecosystems and the impact of climate change. BioScience 55, no. 4: 311. doi:10.1641/0006-3568(2005)055[0311:TICITE]2.0.CO;2.
- Johnson, D. R., and L. Gough. 2013. Two Arctic tundra graminoids differ in tolerance to herbivory when grown with added soil nutrients. Botany 91, no. 2: 82–90. doi:10.1139/cjb-2012-0143.
- Kleinhesselink, A. R., S. M. Magnoli, and J. H. Cushman. 2014. Shrubs as ecosystem engineers across an environmental gradient: Effects on species richness and exotic plant invasion. Oecologia 175, no. 4: 1277–90. doi:10.1007/s00442-014-2972-0.
- Koltz, A., L. Gough, and J. R. McLaren. 2022. Arctic terrestrial food webs: Effects of climate change and implications for carbon and nutrient cycling. Annals of the New York Academy of Sciences 1516, no. 1: 28–47. doi:10.1111/nyas.14863.
- Macander, M. J., P. R. Nelson, T. W. Nawrocki, G. V. Frost, K. M. Orndahl, E. C. Palm, A. F. Wells, and S. J. Goetz. 2022. Time series maps reveal widespread change in plant functional type cover across Arctic and boreal Alaska and Yukon. Environmental Research Letters 17, no. 5.
- Mack, M. C., E. A. Schuur, M. S. Bret-Harte, G. R. Shaver, and F. S. Chapin. 2004. Ecosystem carbon storage in Arctic tundra reduced by long-term nutrient fertilization. Nature 431, no. 7007: 440–3. doi:10.1038/nature02887.
- Mekonnen, Z. A., W. J. Riley, L. T. Berner, N. J. Bouskill, M. S. Torn, G. Iwahana, and R. F. Grant. 2021. Arctic tundra shrubification: A review of mechanisms and impacts on ecosystem carbon balance. Environmental Research Letters 16, no. 5. doi:10.1088/1748-9326/abf28b.
- Min, E., M. Wilcots, S. Naeem, L. Gough, J. R. McLaren, R. J. Rowe, E. Rastetter, N. Boelman, and K. L. Griffin. 2021. Herbivore influence on carbon sink capacity of Alaskan dry heath tundra is sensitive to temperature and light. Environmental Research Letters 16, no. 2: 024027. doi:10.1088/1748-9326/abd3d0.
- Myers-Smith, I. H., B. C. Forbes, M. Wilmking, M. Hallinger, T. Lantz, D. Block, and D. S. Hik. 2011. Shrub expansion in tundra ecosystems: Dynamics, impacts and research priorities. Environmental Research Letters 6, no. 4: 045509. doi:10.1088/1748-9326/6/4/045509.
- Myers-Smith, I. H., M. M. Grabowski, H. J. D. Thomas, S. Angers-Blondin, G. N. Daskalova, A. D. Bjorkman, and C. D. Eckert. 2019. Eighteen years of ecological monitoring reveals multiple lines of evidence for tundra vegetation change. Ecological Monographs 89 (2). doi: 10.1002/ecm.1351.
- Natali, S. M., E. A. G. Schuur, C. Trucco, C. E. Hicks Pries, K. G. Crummer, and A. F. Baron Lopez. 2011. Effects of experimental warming of air, soil and permafrost on carbon balance in Alaskan tundra. Global Change Biology 17 (3): 1394–407. doi:10.1111/j.1365-2486.2010.02303.x.
- Olofsson, J., H. Tommervik, and T. V. Callaghan. 2012. Vole and lemming activity observed from space. Nature Climate Change 2 (12): 880–3. doi:10.1038/nclimate1537.
- Pitelka, F. A., and G. O. Batzli. 2007. Population cycles of lemmings near Barrow, Alaska: A historical review. Acta Theriologica 52, no. 3: 323–36. doi:10.1007/BF03194229.
- Pithan, F., and T. Mauritsen. 2014. Arctic amplification dominated by temperature feedbacks in contemporary climate models. Nature Geoscience 7, no. 3: 181–4. doi:10.1038/ngeo2071.
- Prager, C. M., N. T. Boelman, J. U. H. Eitel, J. T. Gersony, H. E. Greaves, M. A. Heskel, … K. L. Griffin. 2020. A mechanism of expansion: Arctic deciduous shrubs capitalize on warming-induced nutrient availability. Oecologia 192, no. 3: 671–85. doi:10.1007/s00442-019-04586-8.
- Prager, C. M., S. Naeem, N. T. Boelman, J. U. H. Eitel, H. E. Greaves, M. A. Heskel, K. L. Griffin, D. N. L. Menge, L. A. Vierling, and K. L. Griffin. 2017. A gradient of nutrient enrichment reveals nonlinear impacts of fertilization on Arctic plant diversity and ecosystem function. Ecology and Evolution 7, no. 7: 2449–60. doi:10.1002/ece3.2863.
- Rantanen, M., A. Y. Karpechko, A. Lipponen, K. Nordling, O. Hyvärinen, K. Ruosteenoja, T. Vihma, and A. Laaksonen. 2022. The Arctic has warmed nearly four times faster than the globe since 1979. Communications Earth and Environment 3, no. 1: 168. doi:10.1038/s43247-022-00498-3.
- Rastetter, E. B., K. L. Griffin, R. J. Rowe, L. Gough, J. R. McLaren, and N. Boelman. 2021. Model responses to CO2 and warming are underestimated without explicit representation of Arctic small mammal grazing. Ecological Applications. doi: 10.1002/eap.2478.
- Reid, D. G., F. Bilodeau, C. J. Krebs, G. Gauthier, J. Alice, B. S. Gilbert, E. Hofer, D. Duchesne, and E. Hofer. 2012. Lemming winter habitat choice: A snow-fencing experiment. Oecologia 168, no. 4: 935–46. doi:10.1007/s00442-011-2167-x.
- Roy, A., L. Gough, N. T. Boelman, R. J. Rowe, K. L. Griffin, and J. R. McLaren. 2022. Small but mighty: Impacts of rodent-herbivore structures on carbon and nutrient cycling in Arctic tundra. Functional Ecology 36, no. 9: 2331–43. doi:10.1111/1365-2435.14127.
- Roy, A., M. Suchocki, L. Gough, and J. McLaren. 2020. Above- and belowground responses to long-term herbivore exclusion. Arctic, Antarctic, and Alpine Research 52, no. 1: 109–19. doi:10.1080/15230430.2020.1733891.
- Schmidt, N. M., R. A. Ims, T. T. Hoye, O. Gilg, L. H. Hansen, J. Hansen, and B. Sittler. 2012. Response of an Arctic predator guild to collapsing lemming cycles. Proceedings of the Royal Society B 279, no. 1746: 4417–22. doi:10.1098/rspb.2012.1490.
- Schuur, E. A. G., A. D. McGuire, C. Schädel, G. Grosse, J. W. Harden, D. J. Hayes, … J. E. Vonk. 2015. Climate change and the permafrost carbon feedback. Nature 520, no. 7546: 171–9. doi:10.1038/nature14338.
- Schuur, E. A. G., J. G. Vogel, K. G. Crummer, H. Lee, J. O. Sickman, and T. E. Osterkamp. 2009. The effect of permafrost thaw on old carbon release and net carbon exchange from tundra. Nature 459, no. 7246: 556–9. doi:10.1038/nature08031.
- Shaver, G. R., M. S. Bret-Harte, M. H. Jones, J. Johnstone, L. Gough, J. Laundre, and F. S. Chapin III. 2001. Species composition interacts with fertilizer to control long-term change in tundra productivity. Ecology 82, no. 11: 3163–81. doi:10.1890/0012-9658(2001)082[3163:SCIWFT]2.0.CO;2.
- Shaver, G. R., F. S. Chapin III, and B. L. Gartner. 1986. Factors limiting seasonal growth and peak biomass accumulation in Eriophorum vaginatum in Alaskan tussock tundra. Ecology 74, no. 1: 257–78. doi:10.2307/2260362.
- Shaver, G. R., and J. Laundre. 1997. Exsertion, elongation, and senescence of leaves of Eriophorum vaginatum and Carex bigelowii in Northern Alaska. Global Change Biology 3, no. S1: 146–57. doi:10.1111/j.1365-2486.1997.gcb141.x.
- Shaver, G. R., J. A. Laundre, M. S. Bret-Harte, F. S. Chapin III, J. A. Mercado-Diaz, A. E. Giblin, and J. P. Schimel. 2014. Terrestrial ecosystems at Toolik Lake, Alaska. In Alaska’s changing Arctic: Ecological consequences for tundra, streams, and lakes, ed. J. E. Hobbie and G. W. Kling, 90–142. New York, NY: Oxford University Press.
- Sistla, S. A., J. C. Moore, R. T. Simpson, L. Gough, G. R. Shaver, and J. P. Schimel. 2012. Long-term warming restructures Arctic tundra without changing net soil carbon storage. Nature 497, no. 7451: 615–9. doi:10.1038/nature12129.
- Steketee, J., A. Rocha, L. Gough, K. Griffin, I. Klupar, R. An, N. Williamson, and R. Rowe. 2022. Small herbivores with big impacts: Tundra voles (Microtus oeconomus) alter post-fire ecosystem dynamics. Ecology 103, no. 7: e3689. doi:10.1002/ecy.3689.
- Stow, D. A., A. Hope, D. McGuire, D. Verbyla, J. Gamon, F. Huemmrich, … R. Myneni. 2004. Remote sensing of vegetation and land-cover change in Arctic Tundra Ecosystems. Remote Sensing of Environment 89, no. 3: 281–308. doi:10.1016/j.rse.2003.10.018.
- Sturm, M., R. Charles, and K. Tape. 2001. Climate change: Increasing shrub abundance in the Arctic. Nature 411, no. 6837: 546–7. doi:10.1038/35079180.
- Suchocki, M. 2020. Effects of herbivory and soil nutrients on Arctic tundra vegetation. MS Thesis, Towson University.
- Tissue, D. T., and W. C. Oechel. 1987. Response of Eriophorum vaginatum to elevated CO2 and temperature in the Alaskan tussock tundra. Ecology 68, no. 2: 401–10. doi:10.2307/1939271.
- Tuomi, M., S. Stark, K. S. Hoset, M. Väisänen, L. Oksanen, F. J. A. Murguzur, and K. A. Bråthen. 2018. Herbivore effects on ecosystem process rates in a low-productive system. Ecosystems 827–43. doi:10.1007/s10021-018-0307-4.
- Williamson, N. (2022). Examining the roles of small mammal herbivory and soil nutrient addition in structuring Arctic plant communities using experiments and remote sensing. MS Thesis, Towson University.
- Zimov, S. A., S. P. Davydov, G. M. Zimova, A. I. Davydova, E. A. G. Schuur, K. Dutta, and I. S. Chapin. 2006. Permafrost carbon: Stock and decomposability of a globally significant carbon pool. Geophysical Research Letters 33, no. 20. doi: 10.1029/2006GL027484.