
Abstract
The linguistic complexity of many text-based tests can be a source of construct-irrelevant variance, as test-takers’ performance may be affected by factors that are beyond the focus of the assessment itself, such as reading comprehension skills. This experimental study examined the extent to which the use of animated videos, as opposed to written text, could (i) reduce construct-irrelevant variance attributed to language and reading skills and (ii) impact test-takers’ reactions to a situational judgment test. The results indicated that the variance attributed to construct-irrelevant factors was lower by 9.5% in the animated version of the test. In addition, those who took the animated test perceived it to be more valid, fair, and enjoyable, than those who took the text-based test. They also rated the language used as less difficult to understand. The implications of these findings are discussed.
Introduction
The majority of tests in use today rely heavily on static text. In most instances, text is still the principal mode of presenting the stimuli and responses for both selection (e.g., multiple-choice) and constructed-response test items. For example, Christian et al. (Citation2010), in their meta-analysis, found that most situational judgment tests (SJTs)Footnote1 do not use any kind of multimedia and that they tend to be exclusively based on written descriptions. Despite the ubiquity of text, it is not difficult to list some of the critical limitations inherent in text-based assessments (Popp et al., Citation2016).
Tests that rely heavily on written text require test-takers to have competencies, such as verbal, reading comprehension, and interpretation skills, that are often irrelevant to the construct that the test purports to capture (Popp et al., Citation2016). Therefore, the extensive use of text in assessments that do not measure language skills is problematic, especially for tests that are administered to test-takers with varying levels of reading comprehension or poor proficiency in the language of the test (Kan et al., Citation2018). Indeed, research has demonstrated that the amount and complexity of written text in tests can negatively impact the performance of certain groups of test-takers (Abedi, Citation2004, Citation2006). According to Abedi (Citation2010), linguistic complexity may be a source of construct-irrelevant varianceFootnote2 for some test-takers, in that their performance can be negatively affected by a factor that is beyond the focus of the assessment they are taking. This is an issue that, according to the latest Standards for Educational and Psychological Testing, constitutes a significant threat to validity (American Educational Research Association (AERA) et al., Citation2014).
These issues linked to the extensive use of text in assessment are exacerbated when it comes to the measurement of more sophisticated or higher-order skills. As argued by Scully (Citation2017), assessment of skills that go beyond the simple recall of knowledge usually involves test items that provide test-takers with complicated stimuli. This typically requires the use of longer, more complex pieces of text with difficult vocabulary and sentence structure (e.g., SJTs).
The potential of video technology in reducing construct-irrelevant variance
The technological developments of the last decades have significantly influenced assessment, improving test development, administration, and scoring (Norcini et al., Citation2013; O’Leary et al., Citation2018). Through the use of technology, assessments can increase both the quantity and quality of the information that test-takers are presented with (Fetzer & Tuzinski, Citation2013). As argued by Boyce et al. (Citation2013), video representations seem to be an efficient way of reducing test dependency on text, which, as outlined above, is likely to eliminate a major source of construct-irrelevant variance and the associated adverse impact on certain groups of test-takers.
Indeed, there have been attempts to incorporate video technologies in tests to replace some or most of their written text, mostly in the context of SJTs, where videos are often used as an alternative to text-based vignettes. Early attempts to replace written passages in SJTs took the form of acted videos, with human actors performing a scenario (e.g., Chan & Schmitt, Citation1997), while lately, some researchers, such as Bruk-Lee et al. (Citation2016), have begun considering the potential of animated videos because of their attractiveness and the ease with which they can be modified.
A small number of studies have compared construct validity evidence from video-based and text-based tests, particularly with regards to the reading demands of the tests. Most of them used video-based techniques in the form of acted videos, while the use of animated videos has been much rarer. Chan and Schmitt (Citation1997) were among the first scholars to explore the benefits that acted videos can bring to assessment in terms of reducing construct-irrelevant variance in test-takers’ performance. Their findings indicated that ethnic group differences were smaller in the video-based SJT (d = 0.21) compared to the text-based SJT (d = 0.95). Additionally, the study showed that there was a statistically significant correlation between students’ test performance and their reading comprehension ability in the text-based but not in the video-based version of the SJT. The findings of Chan and Schmitt's (Citation1997) study suggest that multimedia and, more specifically, video-based tests can actually eliminate the adverse impact that reading comprehension may have on assessment outcomes, improving the validity of the inferences from the test scores. However, it should be noted that the potential benefits of acted videos have not been replicated in other studies. For example, a more recent study conducted by MacCann et al. (Citation2016) failed to find empirical support for the benefits of acted-video SJTs over their equivalent text-based versions.
Dancy and Beichner (Citation2006) were among the first researchers to examine the problem of construct-irrelevant variance using animation technology. The aim of their research was to compare a static (i.e., using pictures and descriptions of motion) to an animated version of the same science test. The results indicated that, although performance on the static version of the science test was significantly correlated to performance on a verbal skills test (r = .22), this was not the case for the animated version of the test. Moreover, interviews with participant students confirmed that the static versions of the questions were more likely to be misread; while even when students managed to read the static questions correctly, they often reported misunderstanding them (Dancy & Beichner, Citation2006).
One of the most relevant works in the field was undertaken by Bardach et al. (Citation2020) in the context of a study investigating ethnic bias. The authors compared three different forms of the same SJT (i. text-based, ii. animated videos accompanied by written descriptions of the scenario, and iii. animated videos without text). The results provided evidence of bias for all three conditions, with members of the majority groups significantly outperforming the minority groups. The main finding of the study was that the use of animations, either instead of or in addition to written text, failed to reduce the adverse impact on minority groups.
Supplementing the limited research in the field, two different theories were considered when developing this study, namely cognitive load theory and additive theory. According to cognitive load theory, the simultaneous presentation of multiple information elements (e.g., written text, visual images, and audio) can place excessive demands on perceivers’ working memories, which, in turn, may affect their ability to comprehend the provided material (Sweller et al., Citation2011). This theory, although formulated in the field of learning, may also apply to the field of assessment, where animations can be used to present complex scenarios that test-takers must fully understand in order to answer the question. However, the discussion around the demands that multimedia can put on test-takers does not necessarily suggest that the presentation of information using multiple media should be avoided, but rather that it should be done carefully to ensure the main messages that the video aims to convey can still be easily understood.
In contrast to cognitive load theory, additive theory postulates that accuracy accumulates as a linear function of available information (Archer & Akert, Citation1980). This implies that video representations of a situation are expected to be more authentic than written text transcripts. It should be noted, that both theories are plausible, as the impact that animations may have on the perceivers heavily depends on the exact nature of the animations, how they are developed, and how well the multiple pieces of information are integrated. This may partially explain the mixed nature of the results emerging from the existing research literature.
The impact of acted and animated videos on test-takers’ reactions to the test
Much of the discourse around assessment and alternative testing formats has focused on the valid and fair measurement of individuals’ knowledge and skills. However, it is also important to know what test-takers think about the quality of the tests they take. As Chan and Schmitt (Citation2004) argued, the examination of test-takers’ perceptions of testing situations allows the subsequent investigation of the influence that these kinds of reactions may have on test-takers’ behavior during and after the assessment process, such as performance on the test and attitudes toward the body organizing the assessment.
A key concept in the area of test-takers’ perceptions is face validity, which is defined as the extent to which a measurement tool appears effective and relevant in terms of its stated aim (Gravetter & Forzano, Citation2012). It should be noted that face validity does not constitute a type of validity evidence, and alone is not an acceptable substitute for other forms of validity evidence. That said, it has been argued that the concept is still important because examinees who believe that they are being assessed on characteristics relevant to the purpose of the test are more likely to place credence on it and try their best (Chan et al., Citation1997; Scott & Mead, Citation2011).
Following a review of the research literature on various employee selection assessments, Chan and Schmitt (Citation2004) highlighted the positive impact that technology, including the use of acted videos, can have on improving test-takers’ reactions to a test. For example, Chan and Schmitt (Citation1997) showed that the acted-video version of a test was associated with higher face validity than the text-based one (d = 0.50). Similarly, in their study, Richman-Hirsch et al. (Citation2000) found that the participants who were assigned to take the acted-video version of a test perceived it as more content valid (d = 0.52), more predictively valid (d = 0.34), and more job-relevant (an indicator of face validity, d = 0.29) than those who took the text-based version of the test (administered via either paper-and-pencil or computer). In addition, these researchers provided evidence to support the argument that video-based tests can improve the extent to which test-takers enjoy the test they complete. However, it has to be acknowledged that the research on these topics is not conclusive and alternative findings exist in the literature. For example, in Lievens and Sackett's (Citation2006) study, analysis of the responses coming from more than 3,000 students who took the medical admission exams in Belgium revealed no statistically significant differences in the levels of face validity between the video- and the text-based versions of the same test.
A study by Kanning et al. (Citation2006) attempted to create a video-based assessment, where both the stems and the response options of the items were presented with the use of acted videos. The results supported the main findings of previous research; the text-based items were perceived to have lower levels of job-relatedness compared to the equivalent video-based items. However, there were no statistically significant differences in test-takers’ perceptions between the acted-video SJTs with and without video-recorded response options.
In the last decade, a small number of research studies specifically investigating the use of animations in testing have been conducted. In a seminal study by Bruk-Lee et al. (Citation2016), test-takers were presented with either an animated or a text-based version of the same SJT. Participants’ responses to the survey questions following the assessment showed that the animated SJT was perceived as more job-relevant than the text-based version of the test. It should be mentioned, though, that the effect size of the difference between the two formats was particularly small (d = 0.08). Additionally, no statistically significant differences were found in test-takers’ perceptions of opportunity to perform, an indicator of perceived fairness, between the animated and the text-based test.
Similar conclusions were reached by Bardach et al. (Citation2020), who compared test-takers’ reactions to three versions of an SJT. The results of their study did not indicate higher perceived fairness or job-relatedness for participants who took either of the two animated versions of the SJT compared to those who completed the text-based test. Similarly, no significant differences across the three formats were found in terms of test-takers’ effort and test anxiety. Statistically significant differences in test-takers’ reactions were found only in terms of their engagement with the assessment, with those taking either of the two animated versions of the SJT reporting higher levels of engagement than those who completed the text-based version. No significant differences in engagement were found between the two animated formats (with and without written text).
The current study
On the whole, the research literature exploring alternatives to text-based tests is quite limited, providing mixed results. Of the few studies that examined the use of videos (acted or animated) as an alternative to written text, some have provided promising results in terms of (i) reducing construct-irrelevant variance attributed to language and reading skills and (ii) improving test-takers’ perceptions of the test.
The majority of the studies exploring video-based assessments have used SJTs involving human actors in recorded videos, while research on animated scenarios is much scarcer. Animated videos represent a distinct and relatively unexplored option that may have significant advantages over acted videos. In contrast to acted videos, animations can be changed and modified relatively easily. Thereby, it is possible to address mistakes at any point, keep the instruments up-to-date over time, and make adjustments to use the scenarios across different contexts, something that is not as easily achieved when human actors are involved. Despite the advantages of animations, their potential in assessment has not been fully explored.
The study described in this paper is one of the first investigations of what animations can contribute over and above written text in assessments, via comparing a text-based and an animated-video version of the same test. Two research questions guided the study, as follows:
Research Question 1: What impact does the use of animated videos have on construct-irrelevant variance attributed to language proficiency and reading comprehension ability?
Research Question 2: What impact does the use of animated videos have on test-takers’ reactions to the test?
Methods
Design and participants
To explore the benefits of using animated videos in assessment, an experimental design was implemented. Participants were randomly assigned to take either an animated or a text-based version of an SJT designed to measure practical knowledge in the teaching profession; both versions of the test were in English. These two groups formed the experimental and the control groups, respectively. The sample of this study consisted of pre-service primary school teachers. Specifically, 129 third-year Bachelor of Education students from two universities in Ireland and Greece voluntarily participated in the study. This sample was deemed appropriate, as students at this stage of their studies have some practical experience in teaching due to their school placements, enabling them to effectively engage with the practical knowledge test.Footnote3 The inclusion of students from Greece in the study ensured adequate numbers of non-native English speakers leading to a higher variation in participants’ proficiency and reading comprehension in English. In total, 51 native English speakers from Ireland (84% females) and 78 non-native English speakers from Greece (85% females) took part in the study.
This was a low-risk research project and ethical approval was obtained prior to administration.
Measures and variables
The practical knowledge SJT
An adapted version of an SJT measuring teachers’ practical knowledge was selected as the “vehicle” for examining the effectiveness of the animations.Footnote4 The scenarios (i.e., vignettes) and response options in the original version of this SJT were developed by Stemler et al. (Citation2006), based on Sternberg's (Citation1999) theory of successful intelligence. The test measures teachers’ knowledge of how to deal with challenging social situations involving students, parents, principals or other teachers. The skills assessed are tacit in nature, meaning that they are not an outcome of formal training and learning, rather they are acquired through experience (Stemler & Sternberg, Citation2006; Sternberg & Grigorenko, Citation2001).
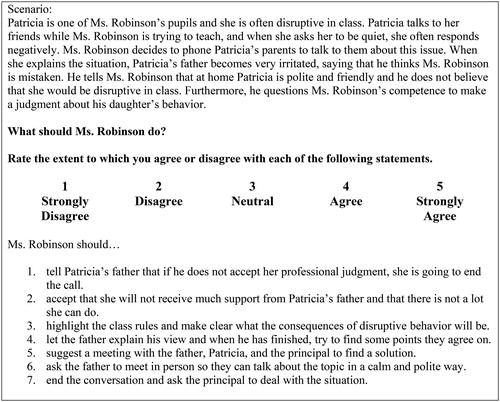
The SJT used in this study provided test-takers with 15 scenarios, and each scenario was accompanied by seven different ways of dealing with the provided situation, representing seven different strategies; comply, consult, confer, avoid, delegate, legislate, and retaliate. For each scenario, participants were asked to rate the extent to which they agreed or disagreed with each of the seven practice statements, using a 5-point Likert scale. The language used in the SJT was as simple as possible to keep the reading demands to a minimum. presents a text-based sample scenario and its corresponding practice statements. Each practice statement was treated as an individual test item, thus, the assessment consisted of 105 items (i.e., 15 scenarios with seven practice statements each). The 15 selected scenarios were adapted to suit the cultural context of the study. Both native and non-native English speakers took the test in English.
Figure 1. Sample SJT scenario and practice statements. Adapted from ‘The socially skilled teacher and the development of tacit knowledge”, by Elliott, J. G., Stemler, S. E., Sternberg, R. J., Grigorenko, E. L., & Hoffman, N., 2011, British Educational Research Journal, 37(1), p. 93. © 2011. Julian G. Elliott, Steven E. Stemler, Robert Sternberg, Elena Grigorenko, and Newman Hoffman. All Rights Reserved. Reproduced with permission.
For the purposes of the study, a parallel, animated version of the text-based practical knowledge SJT was developed. In the animated SJT, text-based scenarios were replaced by animated videos, while the practice statements retained their text-based format but were accompanied by audio. Every effort was made to ensure that the animated videos provided high fidelity without creating substantial extraneous cognitive load. presents a sample scene from the animated version of the test.
Figure 2. Sample scene from the animated version of a scenario.

It should be appreciated that the extent to which each of the practice statements in this SJT can be considered “correct” or “incorrect” is not necessarily universal. This reflects a recurrent theme associated with the assessment of complex, non-cognitive skills, and it presents challenges for the scoring of such assessments (Bergman et al., Citation2006). For the purposes of this study, an “expert judgment approach” to scoring was adopted, whereby the SJT was administered to a sample of experiencedFootnote5 primary school teachers (n = 36 from Greece and n = 38 from Ireland).
Based on these teachers’ responses, each practice statement was classified as Good, Bad or Neutral, and these classifications were then used as a reference point against which items were scored. Test-takers’ overall performance on the SJT was, thus, comprised of their ability to (i) opt for the Good practices and (ii) avoid the Bad practices in dealing with the provided challenging social situations portrayed in the scenario (see Elliott et al., Citation2011 for more details).
Furthermore, to remove any concerns surrounding potential cultural differences, only those items for which there was no statistically significant difference between Greek and Irish experts’ ratings (n = 48) were taken into account for the scoring of the instrument. Total scores in the scale could range from 16 to 80. The scale had a Cronbach’s α reliability of .74, which is considered acceptable (L. Cohen et al., Citation2011).
Test-takers’ reactions to the test
Following the completion of the SJT, participants completed a short questionnaire about their perceptions of and invested effort in the SJT they had taken. Most items were adapted from Bauer et al. (Citation2001), Eklöf (Citation2010), Macan et al. (Citation1994), and Smither et al. (Citation1993), and factor analytic procedures were applied to develop the relevant scale indices. The present study adopted a more holistic approach to face validity than much of the existing literature. Rather than focusing exclusively on the relevance of test content, face validity, in this paper, was conceptualized as test-takers’ perceptions related to the validity and fairness of a test, namely, the extent to which test-takers considered the SJT to be closely related to one’s ability to deal with challenging social situations that may be encountered in the teaching profession, predictive of a teacher’s behavior in the classroom, and a fair indicator of teachers’ practical knowledge. The face validity index consisted of nine items (e.g., “A person who can successfully tackle challenging social situations would do well on this assessment”), α = .63. The enjoyment index consisted of three items (e.g., “I enjoyed taking this assessment”), α = 0.72. Finally, the invested effort index consisted of five items (e.g., “I gave my best effort on this assessment”), α = .77. The final indices were computed by taking test-takers’ means on the relevant items; total scores for each index could range from one to five.
Participants were also asked to rate the difficulty of the language used in the SJT (“I found the language used in the assessment difficult to understand”). This question was expected to provide some information regarding the reading demands of the test for this particular sample.
All items in the questionnaire were rated on a 5-point scale, ranging from “strongly disagree” to “strongly agree”. Participants were expected to better express their opinion about the test experience in their mother tongue and, therefore, the post-test survey was translated into Greek for the non-native English speakers.
Level of proficiency in English
Prior to taking the test, non-native English speakers were asked to report their level of proficiency in English, according to the Common European Framework of Reference for Languages, selecting from a range of categories (i.e., lower than B2, B2, C1, and C2). The Common European Framework of Reference for Languages is an international standard for describing language proficiency.Footnote6 All native English speakers were assumed proficient in English.
Reading comprehension
A set of retired items of the Graduate Record Examinations (GRE) general test, developed by the Educational Testing Service (ETS), was used to measure participants’ reading comprehension ability in English. The test consisted of three passages of text with 11 items in total; total scores in the scale could range from 0 to 11. It should be acknowledged that the internal consistency of the reading comprehension scale was low (α = .52), something that may be attributed to the relatively small number of items.
Ethical considerations
Ethical approval for this project was obtained from Dublin City University’s Research Ethics Committee (DCUREC/2017/206). All ethical guidelines were followed throughout the study and participants were provided with a plain language statement and an informed consent form to sign prior to data gathering.
Results
English proficiency, reading comprehension, and performance on the practical knowledge SJT
More than half of non-native English speakers (56.4%) categorized themselves as independent users of English at level B2, while about one third of them, in total, reported that they were advanced (5.1%) or proficient (30.8%) users of English (levels C1 and C2, respectively). A small number of pre-service teachers (7.7%) reported that their proficiency in English was below level B2. To facilitate analysis, English proficiency was eventually collapsed into two levels, with those reporting a level of B2 or below categorized as “non-advanced” and those reporting a level of C1 or above categorized, along with native English speakers, as “advanced”. In the experimental group (i.e., animated SJT), 59.1% of participants belonged to the advanced English group, while this percentage was 63.5% for the control group (i.e., text-based SJT).
summarizes participants’ performance on the reading comprehension test. Overall, participants performed relatively poorly on the reading comprehension test. As expected, advanced English speakers performed significantly better than non-advanced speakers; t(127) = −5.469, p < .001, d = 1.01.
Table 1. Performance on the English reading comprehension test.
As shows, overall, pre-service teachers performed well on the practical knowledge SJT, scoring at the upper end of the scale. Participants who completed the animated SJT performed significantly better than those who took the text-based version of the test; t(127) = 2, p = .048, d = 0.35. Of course, this finding alone does not necessarily indicate that the use of animations enhanced the quality and validity of the inferences from test-takers’ performance. To explore these aspects in more depth, the following research questions were addressed.
Table 2. Performance on the practical knowledge SJT.
The impact of animated videos on construct-irrelevant variance attributed to language proficiency and reading comprehension ability
The first research question sought to investigate the extent to which the use of animated videos reduced the potential adverse impact of a number of construct-irrelevant factors on participants’ SJT scores. More specifically, two construct-irrelevant factors were examined: (i) proficiency in English and (ii) reading comprehension in English, which was the language of the test. As a first step, the relationship between each one of these factors and SJT performance was examined, separately for those who took the animated and those who took the text-based version of the test. Then, the amount of variance (R2) in SJT scores that was attributed to these two construct-irrelevant factors in the animated test was compared to the corresponding explained variance in the text-based version of the test, to examine the extent to which the use of animated videos led to a decrease in construct-irrelevant variance.
In terms of test-takers’ proficiency in English, advanced English speakers performed statistically significantly better than non-advanced speakers, both in the text-based and the animated SJT; text-based SJT: t(61) = −4.751, p < .001, d = 1.19, animated SJT: t(64) = −4.830, p < .001, d = 1.17.Footnote7 As shown in , though, the average performance gap between advanced and non-advanced English speakers was slightly smaller in the animated compared to the text-based SJT.
Table 3. Performance on the SJT, by English proficiency.
Participants’ performance on the reading comprehension test was also statistically significantly correlated to their performance on the SJT: r(129) = .482, p < .001. Specifically, teachers with stronger reading comprehension skills tended to perform better both in the case of the text-based and the animated test; text-based SJT: r(63) = .499, p < .001, animated SJT: r(66) = .469, p < .001.
In order to more thoroughly examine the extent to which the use of animations may reduce the overall construct-irrelevant variance attributed to language and reading skills, both construct-irrelevant factors (i.e., English proficiency and reading comprehension skills) were included in two regression models, one for the animated and one for the text-based version of the test.Footnote8 Multiple regression analysis indicated that the construct-irrelevant factors accounted for a large proportion of variance in participants’ SJT scores. As shows, English proficiency and reading comprehension were statistically significant predictors of pre-service teachers’ SJT performance, both in the animated and the text-based format of the test.
Table 4. Regression models with construct-irrelevant factors.
In the text-based SJT, 36.8% of the total variance in test-takers’ performance was explained by the two construct-irrelevant factors. In the case of the animated test, though, the variance explained was 3.5 percentage points lower (R2 = 33.3%). This indicates that when animations were used, the predictive power of construct-irrelevant factors on participants’ test scores was weaker, by a rate of 9.5%.Footnote9
To explain these findings in practical terms, the unstandardized coefficients (B), as shown in , can be used. Overall, with other variables held constant, advanced English speakers were expected to outperform their non-advanced counterparts in the SJT by 5.05 and 4.16 score-points in the text-based and the animated version of the test, respectively. Similarly, for every one-unit (score-point) increase in their reading comprehension score (e.g., comparing someone who had a score of five out of 11 to someone with a score of six out of 11), pre-service teachers’ SJT scores were expected to increase by 1.05 score-points in the text-based SJT but by 0.83 score-points in the animated SJT.
The impact of animated videos on test-takers’ reactions to the test
presents descriptive statistics pertaining to participants’ reactions to the test, using the face validity, enjoyment, and invested effort indices.
Table 5. Perceptions and invested effort indices.
The results of the Independent-Samples T-test indicated that the animated version of the test was associated with statistically significantly higher levels of face validity (M = 3.91, SD = 0.36) compared to the text-based SJT (M = 3.77, SD = 0.37); t(127) = −2.133, p = .035. That is, test-takers perceived the animated test to be a more relevant, predictive, and fair indicator of one’s knowledge of how to deal with challenging social situations that may be encountered in the teaching profession, d = 0.38.
Additionally, the test-takers who completed the animated version of the SJT found the test to be more enjoyable (M = 4.59, SD = 0.44) compared to their peers who took the text-based SJT (M = 4.36, SD = 0.48); t(127) = −2.881, p = .005, d = 0.50. Finally, the results showed that there was not a statistically significant difference between the text-based (M = 4.19, SD = 0.54) and the animated SJT (M = 4.28, SD = 0.57) in terms of the effort participants reported investing in the assessment; t(127) = −.899, p = .370.Footnote10 This finding indicates that, based on participants’ self-reports, the animation of the text-based SJT did not lead to significantly greater invested effort in the assessment and, consequently, any differences in the performance of the two groups cannot be attributed to this construct.
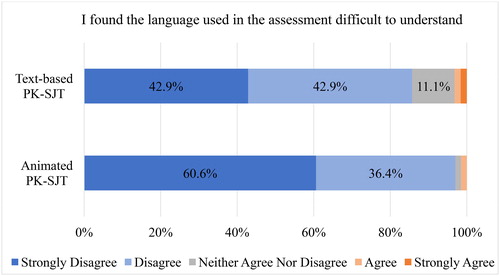
The language used in the test did not appear to pose problems for participants. Indeed, less than 10% of them agreed or strongly agreed that the language of the assessment was difficult to understand. As shown in , this trend was even more pronounced in the animated version of the SJT, despite the fact that the two tests used the same scripts and had the same content, U = 1631, p = .018, η2 = 0.043.
Figure 3. Perceived difficulty of the language used in the assessment.
Note. Data labels for percentages smaller than 5% are not included in the graph.
Discussion and conclusions
Technology offers many opportunities for improving assessment and this study has made an important contribution to the field by exploring the use of animated videos in testing. This was one of the first experimental studies to compare an animated and a text-based version of the same SJT, providing validity evidence regarding the extent to which animated videos may mitigate construct-irrelevant variance attributed to language and reading skills. In addition, the study explored the role of animations in improving test-takers’ perceptions of a test, the importance of which is often overlooked within the testing community.
The findings indicated that, both in the animated and the text-based test, a relatively large proportion of the variance in SJT scores was explained by test-takers’ proficiency and reading comprehension skills in the language of the test (i.e., English). Importantly, however, the variance attributed to construct-irrelevant factors was 9.5% lower in the case of the animated versus the text-based SJT. This finding is consistent with conclusions reached in a number of previous studies (e.g., Chan & Schmitt, Citation1997; Dancy & Beichner, Citation2006).
The findings of this study can also be considered in light of two theories highlighted earlier. The animated SJT succeeded, at least to some extent, in overcoming challenges highlighted in cognitive load theory by alleviating excessive demands being made on test takers’ working memories. This, in turn, may have improved their ability to comprehend the material provided. These findings provide some support for additive theory, whereby the more information test takers are provided with, the better they comprehend the conveyed messages (Archer & Akert, Citation1980). What can be argued with some conviction is that the meticulous design of the animated videos contributed positively toward the development of an instrument that seemed to facilitate rather than impede test performance.
The study suggests that providing test-takers with visual stimuli is a promising approach for enhancing the validity of the inferences drawn from their test scores. With this in mind, it should be appreciated that the findings presented here are potentially relevant in various other assessment contexts. In certification, licensure, and personnel selection assessments, for example, despite the fact that many candidates have profiles that may significantly affect their ability to process written text, the majority of the tests continue to rely heavily on text as the primary medium of communication. This is at odds with equity and fairness concerns requiring test developers to ensure decisions based on test performance are not being undermined by construct-irrelevant variance – an issue particularly relevant to minority groups and test-takers not proficient in the language of the test. Furthermore, the use of animated videos could accommodate psychological assessments of young children who do not have fully-functional verbal language.
Overall, this study suggests that there is some merit in using animated videos in assessments of complex knowledge and skills. While it is safe to argue that the use of animations enhanced the validity of the inferences drawn from test-takers’ scores, strong assertions about the extent to which they eliminated the construct-irrelevant variance cannot be made. Indeed, it is acknowledged that, even in the animated version of the SJT, English proficiency and reading comprehension were correlated with test performance. One possible explanation for this is that some construct-irrelevant variance remained, perhaps due to the fact that only the SJT scenarios (stems) were animated, with the response options retaining their text-based format.
It should also be borne in mind that the correlations observed do not necessarily represent a validity threat, especially taking into account the fact that participants did not find the language used in the tests particularly difficult to understand. Indeed, it is common to see that performance on a test might be highly correlated with performance on a different test measuring a completely different construct; for example, when students who are very good in one subject at school tend to be good in other subjects as well. In other words, the correlation of SJT scores with construct-irrelevant factors, on its own, does not constitute evidence of unintended subgroup differences. What constituted a validity concern in the text-based version of the test, in the context of this study, is the fact that the variance attributed to these factors was reduced when the reading demands on the tests were lowered, via the use of animations. However, the extent to which this variance can be explained by actual differences between test-takers or whether it should be attributed to unintended subgroup differences that were not eliminated through the use of animations is unknown.
A secondary aim of this study was to investigate the impact of animations on test-takers’ perceptions of and invested effort in the test. Although the two assessment formats were identical in terms of their content, pre-service teachers who completed the animated SJT considered it to be significantly more relevant to the teaching profession and a fairer indicator of their practical knowledge compared to those who took the same test in its text-based format. The use of animations also positively influenced the extent to which test-takers enjoyed the assessment process. These findings corroborate a great deal of previous research in the field of both acted-video and animated assessments (Bruk-Lee et al., Citation2016; Kanning et al., Citation2006; Richman-Hirsch et al., Citation2000), and further support one of the main advantages of multimedia over text-based assessments; i.e., that assessments using multimedia are often perceived to be more authentic and evoke more positive test-taker reactions.
Although test-takers’ perceptions of a test, in general, and the presence of face validity, in particular, do not constitute validity evidence per se, they are still worthy of consideration. Examinees who believe that they are being assessed on characteristics relevant to the purpose of the test are more likely to place credence on the measure and be motivated to do their best, which, in turn, could affect their performance (Chan et al., Citation1997; Scott & Mead, Citation2011). In personnel selection assessment contexts, test-takers’ attitudes toward the measures used can affect not only the perceived reputation of a company but also candidates’ desire to work there (Hausknecht et al., Citation2004). In relation to this, Bruk-Lee et al. (Citation2016) concluded that the use of animated videos rather than text-based descriptions in assessment can considerably impact test-takers’ perceptions of the organization and their intention to accept a potential job offer.
Although face validity and “enjoyableness” have been investigated by previous research in the field, this study took a further step toward the examination of test-takers’ reactions to the assessment by exploring the impact of animations on test-takers’ invested effort in the test in order to provide some indication of engagement with the assessment process. Despite the fact that animations were linked to higher levels of enjoyment among the test-takers, they did not significantly affect the levels of effort participants reportedly put into the test. Such a finding may imply that the overall impact of animations on test-takers’ performance cannot be attributed to the fact that those who took the animated test put in more effort as, based on participants’ responses, this was not the case. In order to provide definitive answers, more comprehensive measures of engagement (e.g., process data) could be used.
It should be noted that test-takers’ perceptions are important, not only in the context of assessments that have short- or long-term consequences for test-takers (e.g., job selection assessments and college admission exams) but in low-stakes contexts as well. This might be the case because, in high-stakes assessments, test-takers are expected to be motivated to perform well, independently of their perceptions of the test, however, in low-stakes contexts, such perceptions may serve as a mediator, significantly affecting their engagement with the assessment tasks. Hopfenbeck and Kjærnsli (Citation2016), for instance, highlighted the importance of further examining and promoting students’ test motivation in low-stakes large-scale assessments, such as the Programme for International Student Assessment (PISA), as a way to improve the validity of their results, given the influence that these results have on policy-making across the participating countries. Harlen (Citation2012) argued that motivation and engagement are key components in assessment for learning purposes (i.e., formative assessment) because engaging assessments enhance students’ learning and further motivate them to achieve learning goals. In the context of teacher education, for example, instruments that use technology (e.g., animations) to improve their fidelity and perceivers’ experience could also be used to facilitate training and professional development.
It is not possible to come to a universal conclusion about the cost-effectiveness of animations on the basis of these results alone, as this is something that highly depends on the nature and the scope of each assessment. This research has provided promising results in relation to the use of animations in assessment, however, it is acknowledged that in certain contexts, it may be difficult to justify their use on the basis of the considerable costs involved. Nonetheless, it can be argued that the cost and complexity of developing animated assessments make them more suited to large-scale rather than small-scale assessment contexts. The practicality and benefit of animations for national and international assessments, university assessment programs, personnel selection and/or credentialing exams administered to many thousands of candidates should be explored in the future.
Limitations, future research, and final notes
There are a number of limitations underlying this study that should be taken into account when interpreting the findings. First, this was a small-scale study and, for many of the analyses, the sample size was not large enough to obtain statistical power at the recommended .80 level (J. Cohen, Citation1988). Also, reliability indices for some of the measures used in this study (i.e., face validity and reading comprehension scales) were not particularly high.
Given the relatively high academic standard required for entry to the teaching education programs (Bachelor of Education) in Ireland and Greece, it could be argued that concerns relating to poor reading comprehension are less pronounced than may be the case in various other testing contexts. Thus, the results of this study may underestimate the potential value that animations can add. With this in mind, future studies involving groups with low levels of education, poor text processing skills or learning difficulties, and tests using more difficult language, would all be welcome.
Notwithstanding the contribution of this research, the use of animations in the field of assessment remains a relatively underexplored area, and further research will be necessary to reach clearer conclusions. Both the limitations of this study and some additional, but related issues which were not explored (e.g., comparisons between text-based and entirely text-free assessments) should be used to inform future research.
This study has empirically demonstrated the potential of animations to enhance validity and to significantly improve the fidelity, face validity, and “enjoyableness” of tests. These findings represent a significant contribution to the field of assessment and testing and should not escape the attention of test developers, especially those working in large-scale testing programs.
Acknowledgements
This research was supported by a grant from Prometric to CARPE. The content of this paper has not been influenced in any way by Prometric, and is solely the responsibility of the authors. The authors gratefully acknowledge Prof. Steve Stemler (Wesleyan University) for granting them permission to adapt and use the Tacit Knowledge Inventory assessment for this research and for providing sound advice on some methodological aspects of the study. The authors are also indebted to Dr. Vasiliki Pitsia and many other colleagues at Dublin City University for their valuable contributions during the research and writing process.
Notes
1 SJTs are assessments that provide test-takers with descriptions of challenging real-life situations (in the form of vignettes), followed by a number of possible alternative ways to deal with them (Motowidlo et al., Citation1990). Respondents are usually required to select the most appropriate response option or rate the suitability of the provided options.
2 Construct-irrelevant variance can be described as measuring phenomena that are not included in the definition of the construct of interest. It occurs when an instrument ends up measuring more than just the construct it is supposed to measure and it is one of the biggest threats to validity (Thompson, Citation2018).
3 The fourth-year cohort was not available at the time of data collection due to students’ final school placements.
4 The practical knowledge SJT was used in this study merely as a tool for facilitating the examination of the research problem, which relates to the potential advantages of animated over text-based descriptions in testing. This study should not be seen as an attempt to examine this research problem in a particular domain (e.g., education). Rather, it attempts to provide information that could prove useful in a broad range of fields.
5 According to Darling-Hammond (Citation2000), the benefits of experience for teachers appear at a level of about five years. Therefore, only primary teachers with five or more years of experience were invited to complete the SJT. The same experience criteria were used by Elliott et al. (Citation2011) to inform the scoring of the original practical knowledge test in the US.
6 In this study, the Common European Framework of Reference for Languages was used because Greek people receive English language certifications within this framework and would, therefore, be familiar with it.
7 The assumption of homogeneity of variance was met in both cases; text-based test: F(1, 61) = 2.779, p = .101, animated test: F(1, 64) = 3.979, p = 0.050.
8 The assumptions of linearity, homoscedasticity, multivariate normality and absence of multicollinearity were all met.
9 In this context, 3.5 percentage points, when expressed in terms of percent change, equates to a difference of 9.5%.
10 The assumption of homogeneity of variance was met in all cases; face validity: F(1, 127) = 0.001, p = .979, enjoyment: F(1, 127) = 0.841, p = .361, invested effort: F(1, 127) = 0.063, p = .802.
References
- Abedi, J. (2004). The No Child Left Behind Act and English language learners: Assessment and accountability issues. Educational Researcher, 33(1), 4–14. https://doi.org/10.3102/0013189X033001004
- Abedi, J. (2006). Language issues in item development. In S. M. Downing & T. Haladyna (Eds.), Handbook of test development (pp. 377–398). Lawrence Erlbaum Associates.
- Abedi, J. (2010). Linguistic factors in the assessment of English language learners. In G. Walford, E. Tucker, & M. Viswanathan (Eds.), The SAGE handbook of measurement (pp. 129–150). SAGE Publications Ltd.
- American Educational Research Association (AERA), American Psychological Association (APA), & National Council on Measurement in Education (NCME). (2014). Standards for educational and psychological testing. American Educational Research Association.
- Archer, D., & Akert, R. (1980). The encoding of meaning: A test of three theories of social interaction. Sociological Inquiry, 50(3/4), 393–419. https://doi.org/10.1111/j.1475-682X.1980.tb00028.x
- Bardach, L., Rushby, J. V., Kim, L. E., & Klassen, R. M. (2020). Using video- and text-based situational judgement tests for teacher selection: A quasi-experiment exploring the relations between test format, subgroup differences, and applicant reactions. European Journal of Work and Organizational Psychology, 30(2), 251–264. https://doi.org/10.1080/1359432X.2020.1736619
- Bauer, T., Truxillo, D., Sanchez, R., Craig, J., Ferrara, P., & Campion, M. (2001). Applicant reactions to selection: Development of the Selection Procedural Justice Scale (SPJS). Personnel Psychology, 54(2), 387–419. https://doi.org/10.1111/j.1744-6570.2001.tb00097.x
- Bergman, M. E., Drasgow, F., Donovan, M. A., Henning, J. B., & Juraska, S. E. (2006). Scoring situational judgment tests: Once you get the data, your troubles begin. International Journal of Selection and Assessment, 14(3), 223–235. https://doi.org/10.1111/j.1468-2389.2006.00345.x
- Boyce, A. S., Corbet, C. E., & Adler, S. (2013). Simulations in the selection context: Considerations, challenges, and opportunities. In M. Fetzer & K. Tuzinski (Eds.), Simulations for personnel selection (pp. 17–41). Springer.
- Bruk-Lee, V., Lanz, J., Drew, E. N., Coughlin, C., Levine, P., Tuzinski, K., & Wrenn, K. (2016). Examining applicant reactions to different media types in character-based simulations for employee selection. International Journal of Selection and Assessment, 24(1), 77–91.https://doi.org/10.1111/ijsa.12132
- Chan, D., & Schmitt, N. (1997). Video-based versus paper-and-pencil method of assessment in situational judgment tests: Subgroup differences in test performance and face validity perceptions. Journal of Applied Psychology, 82(1), 143–159. https://doi.org/10.1037/0021-9010.82.1.143
- Chan, D., & Schmitt, N. (2004). An agenda for future research on applicant reactions to selection procedures: A construct-oriented approach. International Journal of Selection and Assessment, 12(1/2), 9–23. https://doi.org/10.1111/j.0965-075X.2004.00260.x
- Chan, D., Schmitt, N., DeShon, R. P., Clause, C. S., & Delbridge, K. (1997). Reactions to cognitive ability tests: The relationships between race, test performance, face validity perceptions, and test-taking motivation. Journal of Applied Psychology, 82(2), 300–310. https://doi.org/10.1037/0021-9010.82.2.300
- Christian, M. S., Edwards, B. D., & Bradley, J. C. (2010). Situational judgement tests: Constructs assessed and a meta-analysis of their criterion related reliabilities. Personnel Psychology, 63(1), 83–117. https://doi.org/10.1111/j.1744-6570.2009.01163.x
- Cohen, J. (1988). Statistical power analysis for the behavioral sciences (2nd ed.). Lawrence Erlbaum Associates.
- Cohen, L., Manion, L., & Morrison, K. (2011). Research methods in education (7th ed.). Routledge.
- Dancy, M. H., & Beichner, R. (2006). Impact of animation on assessment of conceptual understanding in physics. Physical Review Special Topics - Physics Education Research, 2(1), 1–7. https://doi.org/10.1103/PhysRevSTPER.2.010104
- Darling-Hammond, L. (2000). Teacher quality and student achievement: A review of state policy evidence previous research. Education Policy Analysis Archives, 8(1), 1–44. https://doi.org/10.14507/epaa.v8n1.2000
- Eklöf, H. (2010). Student motivation and effort in the Swedish TIMSS advanced field study. 4th IEA International Research Conference.
- Elliott, J. G., Stemler, S. E., Sternberg, R. J., Grigorenko, E. L., & Hoffman, N. (2011). The socially skilled teacher and the development of tacit knowledge. British Educational Research Journal, 37(1), 83–103. https://doi.org/10.1080/01411920903420016
- Fetzer, M., & Tuzinski, K. (Eds.). (2013). Simulations for personnel selection. Springer. https://doi.org/10.1007/978-1-4614-7681-8
- Gravetter, F., & Forzano, L. (2012). Research methods for the behavioral sciences (4th ed.). Wadsworth.
- Harlen, W. (2012). The role of assessment in developing motivation for learning. In J. Gardner (Ed.), Assessment and learning (2nd ed., pp. 171–183). SAGE Publication Ltd. http://doi.org/10.4135/9781446250808.n11
- Hausknecht, J. P., Day, D. V., & Thomas, S. C. (2004). Applicant reactions to selection procedures: An updated model and meta-analysis. Personnel Psychology, 57(3), 639–683. https://doi.org/10.1111/j.1744-6570.2004.00003.x
- Hopfenbeck, T. N., & Kjærnsli, M. (2016). Students’ test motivation in PISA: The case of Norway. The Curriculum Journal, 27(3), 406–422. https://doi.org/10.1080/09585176.2016.1156004
- Kan, A., Bulut, O., & Cormier, D. C. (2018). The impact of item stem format on the dimensional structure of mathematics assessments. Educational Assessment, 24(1), 13–32. https://doi.org/10.1080/10627197.2018.1545569
- Kanning, U. P., Grewe, K., Hollenberg, S., & Hadouch, M. (2006). From the subjects’ point of view: Reactions to different types of situational judgment items. European Journal of Psychological Assessment, 22(3), 168–176. https://doi.org/10.1027/1015-5759.22.3.168
- Lievens, F., & Sackett, P. R. (2006). Video-based versus written situational judgment tests: A comparison in terms of predictive validity. The Journal of Applied Psychology, 91(5), 1181–1188. https://doi.org/10.1037/0021-9010.91.5.1181
- Macan, T. H., Avedon, M., Paese, M., & Smith, D. (1994). The effects of applicants’ reactions to cognitive ability tests and an assessment center. Personnel Psychology, 47, 715–739. https://doi.org/10.1111/j.1744-6570.1994.tb01573.x
- MacCann, C., Lievens, F., Libbrecht, N., & Roberts, R. D. (2016). Differences between multimedia and text-based assessments of emotion management: An exploration with the multimedia emotion management assessment (MEMA). Cognition and Emotion, 30(7), 1317–1331. https://doi.org/10.1080/02699931.2015.1061482
- Motowidlo, S. J., Dunnette, M. D., & Carter, G. W. (1990). An alternative selection procedure: The low-fidelity simulation. Journal of Applied Psychology, 75(6), 640–647. https://doi.org/10.1037/0021-9010.75.6.640
- Norcini, J. J., Lipner, R. S., & Grosso, L. J. (2013). Assessment in the context of licensure and certification. Teaching and Learning in Medicine, 25(sup1), S62–S67. https://doi.org/10.1080/10401334.2013.842909
- O’Leary, M., Scully, D., Karakolidis, A., & Pitsia, V. (2018). The state-of-the-art in digital technology-based assessment. European Journal of Education, 53(2), 160–175. https://doi.org/10.1111/ejed.12271
- Popp, E. C., Tuzinski, K., & Fetzer, M. (2016). Actor or avatar? Considerations in selecting appropriate formats for assessment content. In F. Drasgow (Ed.), Technology and testing: Improving educational and psychological measurement (pp. 79–103). Routledge. https://doi.org/10.4324/9781315871493
- Richman-Hirsch, W. L., Olson-Buchanan, J. B., & Drasgow, F. (2000). Examining the impact of administration medium on examinee perceptions and attitudes. Journal of Applied Psychology, 85(6), 880–887. https://doi.org/10.1037/0021-9010.85.6.880
- Scott, J. C., & Mead, A. D. (2011). Foundations for measurement. In N. Tippins & S. Adler (Eds.), Technology-enhanced assessment of talent (pp. 21–65). Jossey-Bass.
- Scully, D. (2017). Constructing multiple-choice items to measure higher-order thinking. Practical Assessment, Research & Evaluation, 22, 1–13.https://doi.org/10.7275/ca7y-mm27
- Smither, J., Reilly, R., Millsap, R., Pearlman, K., & Stoffey, R. (1993). Applicant reactions to selection procedures. Personnel Psychology, 46(1), 49–76. https://doi.org/10.1111/j.1744-6570.1993.tb00867.x
- Stemler, S. E., Elliott, J. G., Grigorenko, E. L., & Sternberg, R. J. (2006). There’s more to teaching than instruction: Seven strategies for dealing with the practical side of teaching. Educational Studies, 32(1), 101–118. https://doi.org/10.1080/03055690500416074
- Stemler, S. E., & Sternberg, R. J. (2006). Using situational judgment tests to measure practical intelligence. In J. A. Weekley & R. Ployhart (Eds.), Situational judgment tests (pp. 107–131). Lawrence Erlbaum Associates. https://doi.org/10.4324/9780203774878
- Sternberg, R. J. (1999). The theory of successful intelligence. Review of General Psychology, 3(4), 292–316. https://doi.org/10.1037/1089-2680.3.4.292
- Sternberg, R. J., & Grigorenko, E. L. (2001). Practical intelligence and the principal. Institute of Education Sciences.
- Sweller, J., Ayres, P., & Kalyuga, S. (2011). Cognitive load theory. Springer.
- Thompson, W. (2018). Construct irrelevance. In B. Frey (Ed.), The SAGE encyclopedia of educational research, measurement, and evaluation (pp. 375–376). SAGE Publications, Inc. https://www.doi.org/10.4135/9781506326139.n143