?Mathematical formulae have been encoded as MathML and are displayed in this HTML version using MathJax in order to improve their display. Uncheck the box to turn MathJax off. This feature requires Javascript. Click on a formula to zoom.
Abstract
The Dark Factor of Personality (D) measures the latent core of antagonistic traits. The present study evaluated the psychometric properties of the Swedish version of the full (D70) and the brief (D16) versions, concerning structural validity, item information, and convergent validity. An online sample (N = 294) was analyzed using CFA (Maximum Likelihood Estimation), IRT (Graded Response Model) and SEM (latent correlations). Firstly, the original theorized bifactor model for D70 and a single-factor model for D16 showed good fit to the data. Moreover, new reliability-analyses based on FD and H indicated that the D70 favorably can be collapsed into a unidimensional measure, which is further discussed. Secondly, the IRT-analyses present valid item quality and functioning and showed that items provide the most information on trait levels above mean levels. Lastly, convergent SEM-analyses showed that D had high latent trait correlations to psychopathy and Machiavellianism, but not to narcissism. The correlations with the Big Six personality factors (mini-IPIP6) yielded expected high correlations with Agreeableness and Honesty-Humility. The Swedish translation of the full D70 and brief D16 is recommended for use in future research.
Keywords:
Introduction
Socially aversive traits, which manifest in destructive, unmoral, dysfunctional, and socially undesirable behaviors have been termed dark or antagonistic traits. Moshagen et al. (Citation2018) introduced the Dark Factor of Personality (D) as a new framework, aiming at unifying and measuring an underlying dark core. Several translations of D are already available on darkfactor.org. Recent research in different countries applied D, for instance exploring links to Covid19 responses (Ścigała et al., Citation2021), risk-taking (Tiwari et al., Citation2021), sexism in sports (Schrödter et al., Citation2021), and dating app usage (Castro et al., Citation2020). The present study aims at validating a Swedish translation of D. To understand the emergence of D and its underlying reasoning, a look at the history of this trait research is needed.
Ever since the introduction of the Dark Triad (DT), consisting of narcissism, psychopathy, and Machiavellianism (Paulhus & Williams, Citation2002), a great body of research has formed around those traits. Narcissism is characterized by high self-esteem, self-confidence, and disproportionate self-love (Morf & Rhodewalt, Citation2001). Individuals scoring high on narcissism seek admiration, achievement, and attention (Kajonius & Björkman, Citation2020a, Citation2020b). Psychopathy is characterized by low levels of empathy, proneness to risk-seeking behavior, and high impulsivity (Hare, Citation1985). Machiavellianism is characterized by a cynical world view and manipulative and cold behavior (Paulhus & Williams, Citation2002). The DT focusses on the subclinical version of those three traits, assuming that they are less problematic but more prevalent in the general population than the clinical versions (Paulhus & Williams, Citation2002). Recently, the Dark Triad construct has been extended to the Dark Tetrad, adding Sadism to the constellation. Sadism is characterized by finding enjoyment through the suffering of others and seems to share the same underlying tendency of callousness with the other three traits (Paulhus et al., Citation2020).
Several meta-analyses and literature reviews summarized and analyzed existing measurements of antagonistic traits and their factorial structure, psychosocial correlates, and the relation between antagonistic traits and other structural models of personality (e.g., Furnham et al., Citation2013; Miller et al., Citation2019; Muris et al., Citation2017). The DT is still the most widely used framework and its corresponding most prominent measurements are the Short Dark Triad (SD3; Jones & Paulhus, Citation2014) and the Dirty Dozen (DD; Jonason & Webster, Citation2010). Paulhus and Williams (Citation2002) established that the DT captures three distinct traits, which show intercorrelations, meaning that they partially overlap and share antisocial commonalities. Individuals scoring high on the DT exhibit antisocial behavior in a variety of domains. For instance, in romantic relationships (Hughes & Samuels, Citation2021; Prusik et al., Citation2021; Sevi et al., Citation2020), in interpersonal interactions (Blais et al., Citation2014; Buckels et al., Citation2013), at the workplace (Becker & Dan O’Hair, Citation2007; O’Boyle et al., Citation2012), and in the context of financial, health-related, and recreational risk-taking (Crysel et al., Citation2013; Hudek-Knezevic et al., Citation2021).
Links to other models of personality show consistent, negative associations between the DT and Agreeableness and Conscientiousness (see Furnham et al., Citation2013) of the Five Factor Model (FFM; Costa et al., Citation1991). According to Costa and McCrae, Agreeableness describes the quality of interpersonal behavior “along a continuum from compassion to antagonism” (Costa & McCrae, Citation1985, p.2). Therefore, low Agreeableness is characterized by cynicism, selfish and aggressive behavior (Costa et al., Citation1991). Low Conscientiousness is characterized by moral recklessness and impulsiveness (Costa et al., Citation1991). Further, all three traits load on the Honesty-Humility factor of the HEXACO model (Lee & Ashton, Citation2005). The HEXACO model represents a six-dimensional alternative to the FFM, including Honesty-Humility which contrasts pro-social behavior like modesty and fairness from anti-social behavior like pretentiousness and greed (Ashton & Lee, Citation2007).
These findings add to the ongoing discussion of whether antagonistic traits all load on one overarching latent trait, a so-called dark core, which accounts for the overlaps between antagonistic traits (e.g., Furnham et al., Citation2013; Miller et al., Citation2019; Persson et al., Citation2019). Researchers suggest several candidates as an underlying core, ranging from disagreeableness (Jakobwitz & Egan, Citation2006), Honesty-Humility (Lee & Ashton, Citation2005), to lack of empathy or callousness (CitationJones & Figueredo, 2013).
Measuring and modeling D
Based on the given controversy around antagonistic trait models and their structure, Moshagen et al. (Citation2018) specified the Dark Factor of Personality (D) to identify the underlying core of all aversive traits. D is defined as “the general tendency to maximize one’s individual utility—disregarding, accepting, or malevolently provoking disutility for others, accompanied by beliefs that serve as justifications” (Moshagen et al., Citation2018, p. 657). D was created with a rational item selection procedure from more than 180 items of 12 aversive traits (Moshagen et al., Citation2020). Three item sets were originally identified, comprising 70, 35, and 16 items. All item sets have been scrutinized regarding their reliability and validity and have been proven to be empirically sound measurements for D (Moshagen et al., Citation2020).
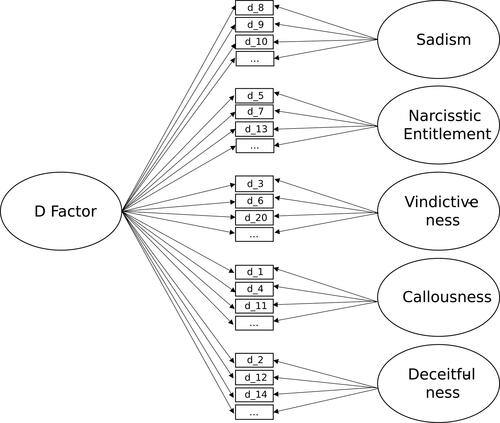
Despite the agreement on the theoretical background of D, how the structure of D can be modeled best has been an ongoing debate. Further analyses regarding the internal structure of the dark core identified five themes, labeled Callousness, Deceitfulness, Narcissistic Entitlement, Sadism, and Vindictiveness (Bader et al., Citation2021). According to the authors, these findings allow for the dark core to be described by a bifactor model of D along with these five specific themes. The specific factors are orthogonal to each other, which sets the covariances to zero. Each item loads on both the general factor (D) as well as on one of the specific factors (see ). Based on this conceptualization, D is described as an underlying antagonistic tendency, which will manifest in flavored expressions of any aversive trait and thus aims to provide a new theoretical basis for the emergence of aversive personality (Bader et al., Citation2021).
Figure 1. The structural bi-factor model of the Dark Factor.
Note. Not all 70 items are depicted. Arrows represent loadings of all items on the general factor as well as the respective themes of D.
Bifactor models are closely related to higher-order models (Reise, Citation2012), which have also been used to model D in previous studies (Hartung et al., Citation2022). Bifactor models and higher-order models both belong to the class of hierarchical factor models. That means both have a general factor that accounts for commonalities between items, while specific factors account for the variance between some groups of items (Reise, Citation2012). An important difference between bifactor models and higher-order models is that bifactor models propose a direct influence between the general factor and the indicators, whereas the higher-order model suggests an indirect influence of the general factor on the indicator linked through a first-order factor. Note that the bifactor model fits the theoretical assumptions of D much better, as D is theorized to directly influence the individual differences in aversive behaviors and traits.
Present study
We aim to analyze the Swedish translation of the Dark Factor of Personality with the purpose to make it available for research and applied settings. We have chosen to analyze the original long scale D70 and the short version D16. First, we assess the factor structure with CFA using the theorized and proposed bifactorial structure of D70 and its five dark themes. D16 was assessed using a single factor model in the CFA. In addition, we assess the item quality and functioning with Item Response Theory (IRT). These analyses quantify how much information each item provides about the trait D and how well items can differentiate between individuals with different trait expressions. In conclusion, we assess the convergent validity of D using a range of measures of individual differences using latent trait correlations in a SEM framework. We were particularly interested in investigating the links between D and the Dirty Dozen as well the basic Big Six personality traits (mini-IPIP6).
Method
Participants and procedure
Participants were invited to take part in personality questionnaire in the Swedish language. We collected two samples of Swedish speakers using online surveys. All participants gave their informed consent prior to starting the survey. The study was in line with national and institutional regulations regarding research ethics; an ethical review was not required. The first sample, a convenience sample, was recruited via social media and posters that were displayed at university facilities. Additionally, a second sample was recruited on Prolific (www.prolific.co) and received approximately 2$for participation. Responding to the survey took around 15 minutes. After completion, the participants received more information about the objectives of the study. To ensure the quality of the data we applied the following requirements for data exclusion. Participants on prolific were given two attention checks throughout the study. Failing at least one led to exclusion. Both samples were screened for Swedish language proficiency. Participants with a Swedish proficiency below good, i.e., beginner and intermediate, were excluded. Lastly, only complete responses on the relevant variables were retained and analyzed. This led to a final sample of N = 294 (Prolific n = 138; Convenience Sample n = 156). Most participants were female (51%) and between 21 and 30 years old (58%). Our sample was comprised of mostly students (50%), 85% were native Swedish speakers. Characteristics of the sample are depicted in .
Table 1. Demographic variables of the sample.
Measurements
Dark Factor of Personality
The Dark Factor of Personality (D; Moshagen et al., Citation2018) measures the basic disposition of antagonistic behaviors. Participants respond to 70 items on a 5-point Likert scale ranging from 1 = strongly disagree to 5 = strongly agree. 35 of the items are reverse coded. The scale can be used in a short version consisting of 16 items. In addition to the general D factor, there are five underlying themes, namely Callousness (reversed: It is hard for me to see someone suffering), Deceitfulness (I’ll say anything to get what I want), Narcissistic Entitlement (reverse coded: Things cannot always go my way), Sadism (I think about harassing others for enjoyment), and Vindictiveness (Payback needs to be quick and nasty). Those themes should not be considered as subscales, but according to the authors, they best describe the internal structure of D (Bader et al., Citation2021). The total Dark Factor has a Cronbach’s alpha of .95 (e.g., Moshagen et al., Citation2020). The Swedish version was translated by Peter Tedeholm, Karolinska Institute, consulted by Martin Bäckström, Lund University and back-translated by Åke Hellström, Stockholm University. For the Swedish translation see Appendix A.
Dirty Dozen
The Dark Triad Dirty Dozen (DD; Jonason & Webster, Citation2010) is a short measurement that assesses the three Dark Triad traits, narcissism (4 items; e.g., “I tend to want others to admire me”), Machiavellianism (4 items; e.g., “I tend to exploit others toward my own end), and psychopathy (4 items; e.g., “I tend to lack remorse”; Paulhus & Williams, Citation2002). Participants answered 12 items on a 7-point Likert scale (1 = strongly disagree to 7 = strongly agree). No items are reverse coded. Cronbach’s alphas of the three subscales, narcissism (.78), Machiavellianism (.77), and psychopathy (.69), are questionable to acceptable (Jonason & Webster, Citation2010). The Swedish translation used in the present study was achieved by a translation and back-translation process (Garcia et al., Citation2017). The Swedish version showed questionable to acceptable Cronbach’s alphas for narcissism (.78), Machiavellianism (.74), and psychopathy (.63).
Big Six factors of personality
The International Personality Item Pool (IPIP; Goldberg, Citation1999) consists of an online database of personality items. The big Six in the present study measures the five distinct broad-bandwidth dimensions of personality Extraversion, Agreeableness, Conscientiousness, Neuroticism, Openness to Experience, and Honesty-Humility (cf. Mini-IPIP6, Sibley et al., Citation2011). This validated short version comprises 24 items (15 reverse coded), which participants answer on a 5-point Likert scale ranging from 1 = not at all accurate to 5 = very accurate (e.g., Donnellan et al., Citation2006). Example items from each dimension are: “I don’t talk a lot” (reversed Extraversion), “I feel others’ emotions” (Agreeableness), “I like order” (Conscientiousness), “I seldom feel blue” (reversed Neuroticism), “I have a vivid imagination” (Openness to Experience), “I deserve more things in life” (reversed Honesty-Humility). The items used in the present study were translated into Swedish by Bäckström (Citation2007) and the IPIP factors showed questionable to good Cronbach’s alpha (range: .65 − .84) and omega values (range: .62 − .84).
Honesty-Humility
Honesty-Humility (HH) is one of the six dimensions measured by the HEXACO model (Ashton & Lee, Citation2009; Lee & Ashton, Citation2004). In this study, we only used two of the four sub facets namely Sincerity (10 items, e.g., reverse coded: “I use flattery to get ahead”) and Fairness (10 items, e.g., “I try to follow the rules), as they are most relevant for D. Sincerity captures an individual’s tendency to be honest and genuine in interpersonal interactions. Fairness measures an individual’s willingness to take advantage through e.g., cheating or fraud in interpersonal interactions. All 20 items (14 reverse coded) are measured by a 5-point Likert scale (1 = strongly disagree to 5 = strongly agree). The Swedish version of the scale was achieved by a translation and back-translation process (Bäckström, Citation2007), and was used in several studies (e.g., Kajonius, Citation2014, Citation2016). Reliability indices for the two sub facets of Honesty-Humility also showed acceptable to good Cronbach’s alphas (range: .76 − .81) and omega values (range: .76 − .82).
Statistical analysis
Structural validity (CFA)
All statistical analyses were performed using R (R Core Team, Citation2020). The packages Lavaan (Rosseel, Citation2012) and BifactorIndicesCalculator (Dueber, Citation2017) were used. To model the factorial structure of D70, both a bifactor model as well as a single-factor model were compared with each other. For D16 only a single-factor model was specified, due to the brevity of the scale. For the bifactor model of D70 six factors were specified. Each item loaded on the general D factor as well as on one of the five themes of D. Both the general D factor as well as the specific themes were set to be mutually orthogonal to each other (i.e., covariances were fixed to 0) and identified by setting one unstandardized loading per factor to 1. The unifactorial models of D70 and D16 contained a single factor for D which was identified by setting an unstandardized loading to 1 as well.
We used Maximum likelihood estimation with robust standard errors and scaled test statistics (Satorra & Bentler, Citation2001; Yuan & Bentler, Citation2000). This has the advantage that it accounts for non-normality in the data. The Shapiro-Wilk test for normality were significant (p < .001) for all items of D70, indicating non-normality of the data. According to recent recommendations, point estimate values of the Standardized Root Mean Residual (SRMR) and the robust Root Mean Squared Error of Approximation (RMSEA) < .08 were considered as estimators of good model fit (Browne & Cudeck, Citation1992; Moshagen & Auerswald, Citation2018). For transparency reasons we report the CFI as well.
To test the psychometric properties, we employed the analysis recommended by Rodriguez et al. (Citation2016a, Citation2016b). We used coefficient omega ( McDonald, Citation2013), omega hierarchical (
, and omega hierarchical subscale (
, as they are often used to gauge reliability in bifactor models. Omega estimates the proportion of reliable variance attributable to all modeled sources of common variance (Rodriguez et al., Citation2016b). Omega hierarchical estimates the proportion of reliable variance attributable to the general factor in a bifactor model (Rodriguez et al., Citation2016b). Omega hierarchical values of .75 or higher indicate that the scores are a reliable measure of an essentially unidimensional construct, in the sense that it is predominantly influenced by a single source (Reise et al., Citation2013). Omega hierarchical subscale estimates the amount of variance explained by the specific factors when the explained variance by the general factor is accounted for (Reise et al., Citation2013; Rodriguez et al., Citation2016b).
Furthermore, we calculated Factor Determinacy (FD) to understand if manifest factor score estimations can be used as reflections of factor scores. FD can range from 0 to 1 and informs if manifest factor scores can be used as proxies to model individual differences on latent variables (see Rodriguez et al., Citation2016b for details). Factor score estimates of factors with a FD below .90 should not be considered as subscales and not used as such in scientific investigations (Gorsuch, Citation1988).
In contrast, for applications of latent trait analysis (e.g., SEM), FD is not informative as no manifest proxies for the latent trait are needed. When applying a scale for SEM it is important to know how well the latent variable is represented by the items. This concern is also known as construct validity (Hancock, Citation2001; Hancock & Mueller, Citation2001). H was used to assess the construct validity of a scale (Rodriguez et al., Citation2016a). H can range between 0 to 1. If H is low, the items do not define the latent trait sufficiently and change across studies is expected. If H is high, the items of the scale capture the latent trait well and stability across studies is expected. Rodrigues and colleagues (2016a) recommend the threshold of H = .80 for the analysis of bifactor models. Factors that are below this threshold should not be included in SEM analysis as the loadings are too low to reliably specify the latent trait across studies.
In a similar vein the Explained Common Variance (ECV; Ten Berge & Sočan, Citation2004) can be informative to see how to best represent the bifactorial structure of a scale in SEM analysis. The ECV shows whether it is permittable to use the general factor without the specific factors in SEM models, as the ECV estimates the essential unidimensionality of the common variance of a set of items. The ECV can be seen as a measure of general factor strength, as it is the ratio of common variance explained by the general factor. In other words, the ECV estimates to which extent the items of a specific factor are subsumed by the general D factor. Higher values are indicative of a stronger general factor. According to recommendations for interpretation values higher than the range of .70 to .80 indicate a virtually unidimensional measure (Rodriguez et al., Citation2016a). That means given a high ECV the unidimensional model is an unbiased approximation of the general factor of the bifactor model.
To better understand and interpret the impact of the ECV the Percent of Uncontaminated Correlations (PUC) was calculated, as both are in a direct relationship to each other. PUC is defined as “the number of unique correlations in a correlation matrix that are influenced by a single factor divided by the total number of unique correlations” (Rodriguez et al., Citation2016b, p. 146). The PUC moderates the direct relationship between the ECV and parameter bias (Bonifay et al., Citation2015; Reise et al., Citation2013). As the PUC increases, the impact of the ECV value becomes less important when a unidimensional model is fit to data with a bifactorial structure. A PUC of higher than .70 indicates that a bifactorial structure can be collapsed into a unidimensional measure (Rodriguez et al., Citation2016a).
Item information (IRT)
Firstly, we performed a descriptive analysis of the 70 items, analyzing their mean value, standard deviation, skewness, and kurtosis (see Appendix B). We conducted IRT analyses using the ltm package (Rizopoulos, Citation2006) of the R software (R Core Team, Citation2020). All items were answered on a 5-point Likert scale, which is considered polytomous data. The most commonly used IRT models for this kind of data are the Generalized Partial Credit Model (GPCM; Muraki, Citation1992) and the Graded Response Model (GRM; Samejima, Citation1997).
Comparison of both models yielded a lower Akaike Information Criterion (AIC) for the GRM. The GRM is a cumulative logistic model, which estimates two parameters:
The first parameter is the slope coefficient alpha (α), also called discrimination parameter. Alpha values identify which items provide more information than others and describe the relation between an item of the scale and the construct D (referred to as θ). Higher discrimination parameters express a stronger association between an item and the underlying trait. Usually, α values range from −2.80 to +2.80, where everything above 1.70 is considered very high, everything between 1.70 and 1.35 high, and everything lower is considered moderate (Baker, Citation2001; Baker & Kim, Citation2017). However, in personality psychology values typically range from 0.5 to 2.0 (Morizot et al., Citation2007).
The second parameter is the difficulty coefficient beta (β), also called item difficulty. Beta values yield information about the location of the item along the scale. Each item has k-1 beta values in which k is the number of item response categories (Baker & Kim, Citation2017). Because D is measured by a 5-point Likert-scale, the model estimates 4 β’s for each item. Beta values are expressed and interpreted on a z-score metric of the trait expression (θ) with a mean of 0 and standard deviation of 1 (Embretson & Reise, Citation2000). Typically, β values range from −3 to +3, but more extreme values (e.g., > 3) are not uncommon (Garcia et al., Citation2018). Due to the GRM being a cumulative model, item category probabilities cannot be estimated directly. This means that beta values are the thresholds of the underlying trait at which the categories of the item scale have a probability greater than 50% of being confirmed (e.g., β1 refers to the probability of answering option 1 instead of 2, 3, 4, and 5). To demonstrate this with an example from D, we could assume that item 1 of the D factor has a β1 of −1.5 and a β2 of 0.0. In this case the GRM model predicts that an individual with an expression of D 1.5 SD below the mean (θ = −1.5) has a 50% chance of endorsing the first category of the scale (strongly disagree) and a 50% chance of endorsing all other categories (disagree to strongly agree). Further it predicts that a respondent with a latent trait expression at the mean (θ = 0.00) has a 50% chance of endorsing the first or second category (strongly disagree or agree) and a 50% chance of responding with a higher category (neutral to strongly agree). A uniform distribution of β values across the range of the latent trait would indicate equally good measurement at all points (DeMars, Citation2010).
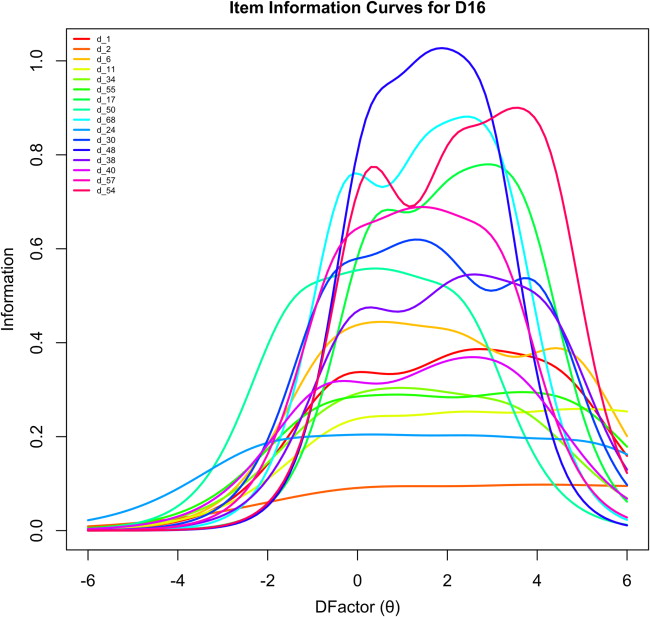
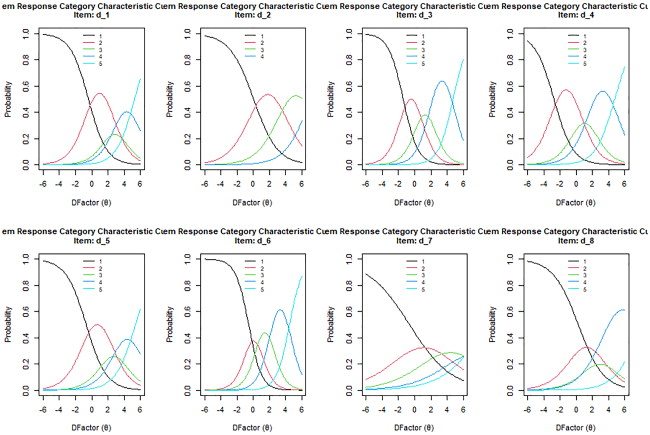
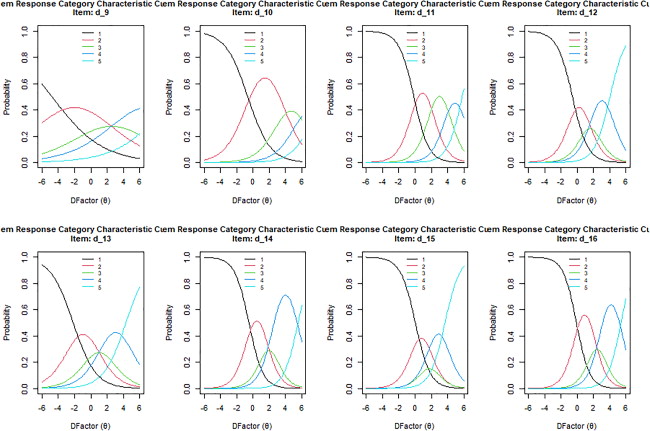
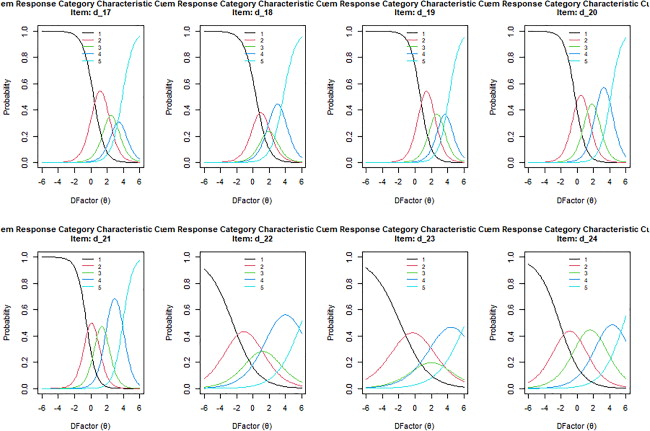
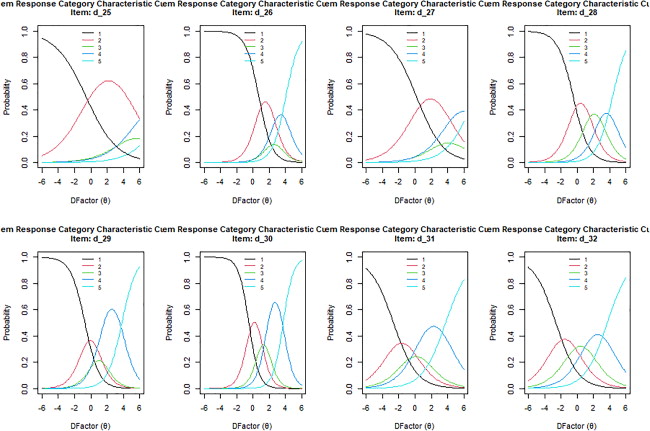
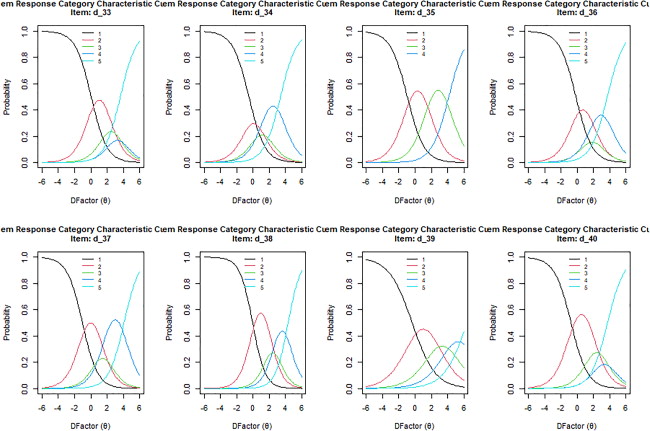
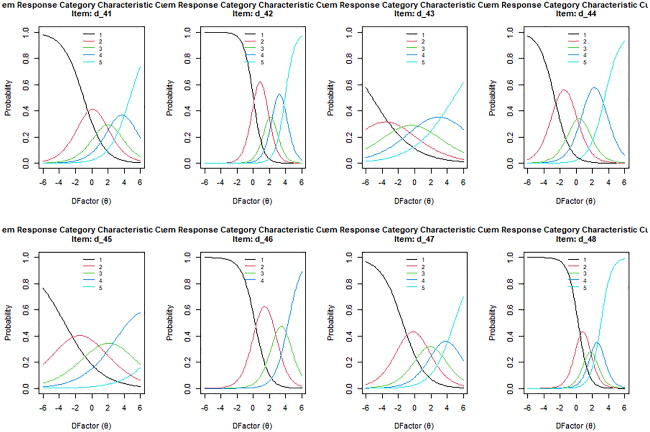
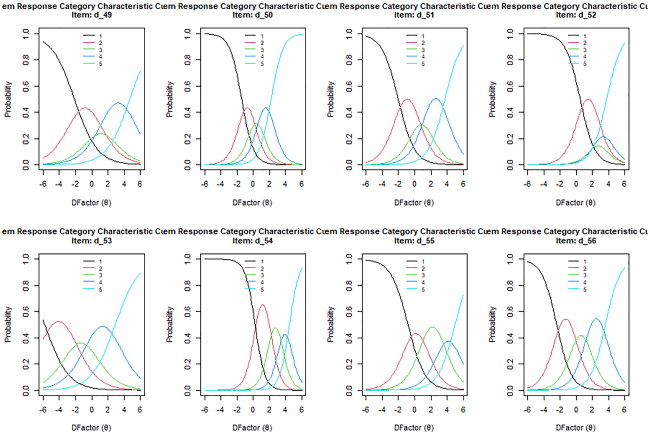
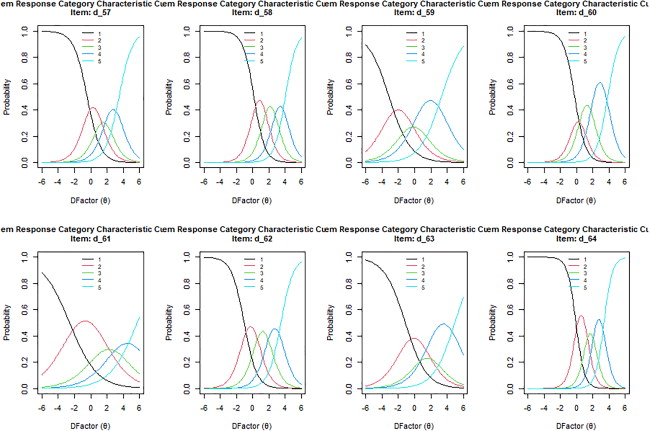
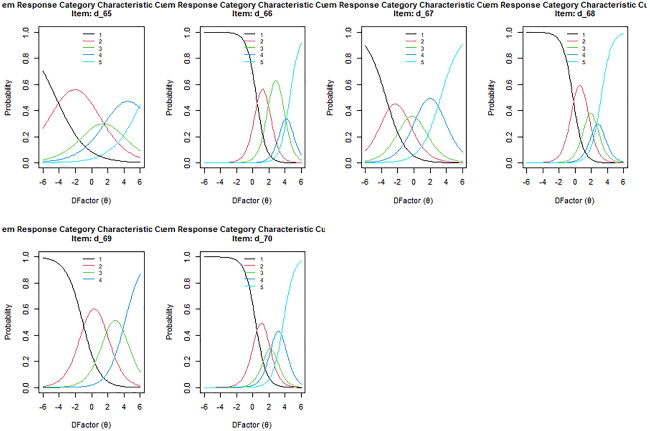
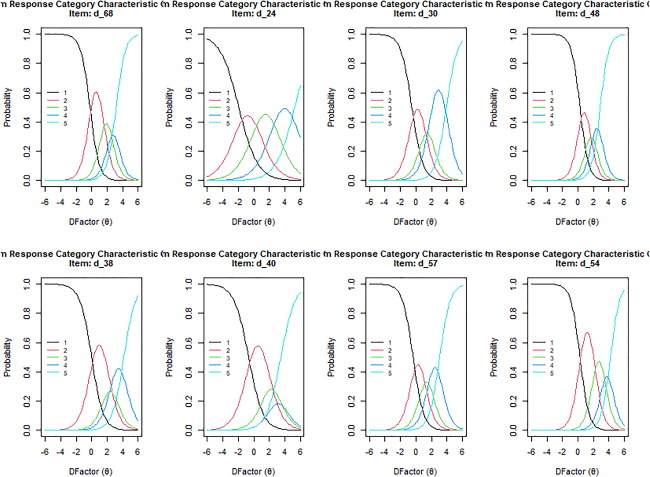
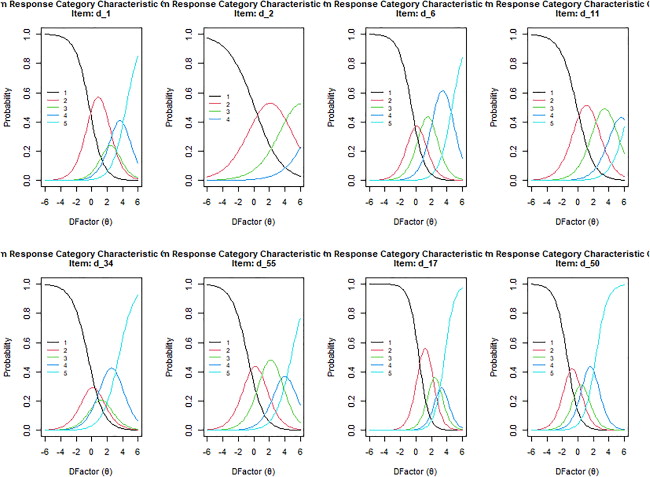
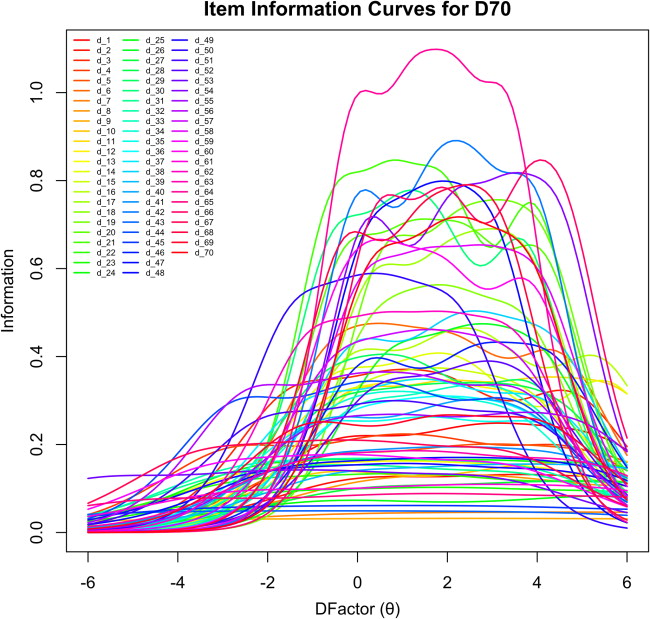
The item parameters of a scale can also be interpreted by examining IRT plots. We plotted Category Response Curves (CRC) and Item Information Functions (IIF) for all items of both D70 and D16. A CRC shows a set of probability curves for each item, which describes the relationship between an individual’s underlying trait and their responses to that item. This way the most likely response category can be identified for different levels of the underlying trait (θ). The α value of an item determines the steepness and narrowness of the respective probability curves in each CRC; a higher α leads to steeper and narrower curves. The β values determine the locations and intersections of the curves. The IIF depicts how much psychometric information a single item provides across trait levels, again higher α values of an item result in a greater peak of the IIF. The TIF is then plotted by summing all IIFs of one scale and presents the information that the whole scale can provide (Baker & Kim, Citation2017). We could in this manner compare the D70 and D16.
Convergent validity
The convergent validity of a scale yields information about the relation between a construct and its indicators. It can also be estimated by the relationship between the measurement under question and similar measurements of the same construct (Boateng et al., Citation2018). To investigate whether D provides similar measurement results for aversive traits as other measurements of antagonistic personality, the DD scale was used. High latent bivariate correlations between D and sub facets of the DD would indicate convergent validity, whereas low latent correlations suggest that both scales measure different constructs.
To examine the convergent validity, we used structural equation modeling (SEM), which was conducted using the lavaan package (Rosseel, Citation2012) in the R Software (R Core Team, Citation2020). Based on the psychometric properties derived from the CFA and reliability-analyses, we conducted all analyses modeling D as one latent factor. To further investigate the convergent validity of D, we included all personality variables as factors in separate models. The IPIP was modeled with six latent factors, the HH with two, and the DD with three. As a next step, we repeated all analyses with D16.
Results
Structural validity (CFA)
Fitting the data to the bifactor model with one general and five specific factors for D70 yielded an expectable fit 2(2,275) = 3,628, p < .001; RMSEA = .048, 90% CI[.045, .051]; SRMR = .064, CFI = .739. All items showed significant loadings on D, ranging from .01 to .66 (mean
= .40, SD = .13; see ). In general, loadings on the specific factors were lower (mean
= .24, SD = .18, range: −.04 − .75). In total, 36 items had non-significant loadings on the specific factors. Note that in the application of bifactor models this is not a problem as it simplifies the identification of the model (Eid et al., Citation2017; Zhang et al., Citation2021).
Table 2. Standardized item loadings on D in the D70 and D16.
Estimating the fit of an alternative single-factor model for D70 reached satisfactory fit 2(2,345) = 4,258, p < .001; RMSEA = .056, 90% CI[.054, .059]; SRMR = .071, CFI = .627. However, when comparing both models, the single-factor model yielded a significantly worse fit than the bifactor model (
270) = 498, p < .001). Similarly, the AIC and BIC of the bifactor model (AIC = 51983, BIC = 52756) and the single-factor model (AIC = 52611, BIC = 53127) indicated a preference for the bifactor model based on the lower AIC and BIC.
For the single-factor model of D16, the fit was good, with 2(104) = 187, p < .001; RMSEA = .058, 90% CI[.053, .075]; SRMR = .056, CFI = .899. The standardized factor loadings were in the range of .29 − .67 (mean
= .51, SD = .11). All loadings of the items on D16 were significant.
Manifest correlations of D70 with D16 (r = .91) were high. This shows that although some information is lost, the different subsets of D70 measure the same latent variable and can be used as an approximation for the full scale.
For the general factor, the FD value was .97, which means that manifest scores can be used as an approximation of the general factor D. H of the general factor was .95, which indicates a high stability in the context of SEM. FD estimates and H for all specific factors were below the threshold of .90 and .80, respectively (see ). For all items the ECV of D was .69. Therefore, 69% of the variance of all items can be attributed to the general factor. The PUC was .80, indicating that collapsing D70 in a unidimensional structure would result in small relative bias.
Table 3. Psychometric properties of the bifactor model of D70.
Cronbach’s alpha for D70 (= .94) and D16 (
= .84) were good to excellent. Regarding D70, out of the total omega (
.95), the omega hierarchical for D70 (
.88) explained the biggest amount of reliable variance. Regarding the reliable variance, 94% (.89/.95) can be attributed to the general factor and 6% (.95 − .89) of the reliable variance in the total scores can be attributed to the multidimensionality caused by the specific factors. For the specific factors, omega hierarchical subscale values were lower (see ). However, these lower ωHS, were expected as the specific factors represent residual variances to the general Factor D. For the single-factor model the omega for D16 (
.85) was high.
Item analyses (IRT)
As ECV and PUC for the bifactor model indicated that collapsing the D70 into a unidimensional measure would result in low relative bias, we conducted separate IRT analyses for unidimensional models of D70 and D16 respectively. In every case, we compared a constrained GRM model to an unconstrained model. The constrained model sets discrimination values across all items to an equal value, whereas the unconstrained model allows discrimination parameters to vary across items. In all cases, the unconstrained model showed better fit indices based on likelihood ratio tests (see ). Estimated parameters of all unconstrained GRM models are described separately for the long (D70) and short (D16) version in the following section and can also be found in Appendix C.
Table 4. Likelihood ratio tests for comparison of constrained and unconstrained GRM models.
Among all items of the D70 scale, discrimination values ranged from 0.32 (d_9, Spreading rumors) to 1.92 (d_64, Success is survival of the fittest). According to thresholds recommended by Baker (Citation2001), most of the items (79%) fell in the category of providing moderate information and the rest showed values above 1.35 which can be considered high. The mean of all α’s across D70 was 1.04. Across all item sets D16 showed the highest proportion of α values providing high information with a mean of 1.26. Values ranged from 0.59 (d_2, It is better to be humble and honest) to 1.81 (d_48, Like to make people suffer) of which 62% provide moderate information and the remaining items provide high information. In general, across both item sets, all items provided moderate to high and some even very high information about the underlying trait.
The threshold parameters (β’s) showed a similar pattern across both item sets of D. For D70 the thresholds for the lowest item category (strongly disagree) ranged from −5.79 (d_53, No sympathy for someone who hurts me) to 0.72 (d_26, Harassing others for enjoyment), while the thresholds for the highest category (strongly agree) ranged from 1.23 (d_46, Doing good deeds brings joy) to 9.96 (d_9, Spreading rumors). For D16 the thresholds for the lowest item category ranged from −1.94 (d_24, People regret messing with me) to 0.39 (d_17, Hurting people is uncomfortable), while the thresholds for the highest category ranged from 2.29 (d_50, Use Information against people) to 8.11 (d_2, It is better to be humble and honest). With only a few exceptions, most item’s thresholds, across D70 and D16, already crossed into a positive range in the second category (61 items for D70 and 15 items for D16).
The above-described patterns of IRT parameters can also be seen in the created Category Response Curves (CRC) and Item Information Functions (IIF) for both item sets. CRC plots for D70 showed that most intersections of the probability curves for the item categories are located around or above the mean and less so on the negative side of the continuum (θ < 0). The spread of the probability curves differed greatly among items and not all CRCs depicted a desired order of probability curves with distinct peaks (see Appendix D for illustration).
The same pattern emerged across items of D16. However, the proportion of ordered CRCs with distinct peaks increased with the decrease of items involved, as the shorter scales also showed a greater amount of high α values. All CRC plots of both item sets can be found in Appendix E.
In the next step, we plotted IIFs for both scales (see Appendix F). This way, all items can be compared regarding how much information they provide across different levels of the D Factor. Again, the plots showed trends that were already detected by the examination of the estimated GRM parameters. Across both item sets, most items provided moderate information with some exceptions of items providing particularly little or much information.
Convergent validity
The data fitted all models well. Model fit indices are reported in . Latent bivariate correlations between the D70, D16, and all other scales are reported in . Across both the long and short item sets of D, associations to Machiavellianism and psychopathy were significant and moderate to strong (r = .63 to .80, p < .001), whereas no significant association was found between D and narcissism.
Table 5. Fit indices for all SEM models.
Table 6. Reliability indices and latent bivariate correlations between constructs as indicators of convergent validity.
Associations to the six subfactors of the IPIP showed an almost identical pattern across both item sets of D. Significant, negative correlations with D were found for Openness to Experience (−.19 to −.21, p < .01), and Agreeableness (−.58 to −.60, p < .001). No significant associations were found with Neuroticism, Extraversion, and Conscientiousness. Honesty-Humility showed the highest association to D (−.55 to −.62, p < .001). This pattern again emerged across both item sets of D.
Discussion
The purpose of the present study was to investigate the factorial structure (and psychometric properties), the item quality, and the convergent validity of the Swedish translation of the Dark Factor of Personality. In the following, the reported results of the CFA, the IRT, and convergent validity will be discussed separately.
Structural validity of D
The model fit as indicated by RMSEA and SRMR for a bifactor model was good, except for CFI. Note that the usefulness of CFI as an indicator for pointwise model fit has been questioned as the goodness of fit. The bifactor model represented the data better than the single-factor model. The bifactor model also aligns with the theoretical background of D (Bader, Horsten, et al., Citation2022). In that framework, this represents two domains. Firstly, the specific manifestation of D, and secondly the non-aversive domain that are unique themes to the trait. Furthermore, the CFA analysis demonstrated that the single-factor models for D16 represented the data well. This indicates that a recommended single-factor solution for D16 is appropriate for the shorter item set.
For the bifactor model of D70, the lower FD values showed that the specific factors should not be seen as subscales. This recommendation differs from Bader, Horsten, et al. (Citation2022), who did not consider FD. Due to the high intercorrelations of the themes, they recommend approximating manifest scores of the themes of D by regressing each theme on D and considering the regression residuals. Similarly, H indicated that the themes of D are not stable enough to be modeled in SEM. So far, little is known about H for the bifactor model. Although emphasizing the use of latent variable analysis for investigating D, validations of D in English and German did not report H (Bader et al., Citation2021; Bader, Horsten, et al., Citation2022). Therefore, in the context of SEM the stability of the themes of D in the German and English versions is unclear.
Furthermore, for SEM analysis, it is important to know if the bifactor model of D can be collapsed into a unidimensional measure. The ECV was slightly below the recommended threshold of .70, which indicates that unidimensionality could introduce bias and is not ideal. However, this is mitigated by the high PUC, which indicates that the risk of introducing bias via a virtually unidimensional measure in SEM analysis is low. In their study, Rodriguez et al. (Citation2016a) analyzed the ECV and PUC of 50 psychological measures with bifactor models. They demonstrated that with a high PUC the ECV can be as low as .50 and still result in small relative bias. Therefore, we conclude that it is justified to collapse the D70 into a unidimensional measure in the context of SEM.
Cronbach’s alphas for the D70 and D16 were good to excellent. Likewise, the omega hierarchical of D70 and the omega of D16 were good indicating that the scales measure reliably. In the Swedish D70, the omega hierarchical values suggested that the majority of the measured variance can be attributed to D. In contrast the omega hierarchical subscale values were lower, which was expected due to the residual nature of the specific factors. For D70, Cronbach’s alpha and omega total were very high. Note that very high Cronbach’s alpha and omega values (> .90) can also indicate redundancies in the scales and that the scale could be shortened (Rodriguez et al., Citation2016b; Tavakol & Dennick, Citation2011). The shortened D16 showed no redundancies based on Cronbach’s alpha and omega values.
Item analysis of the D-factor
To our knowledge, this is the first IRT conducted on D, only allowing comparison to studies on other antagonistic personality scales (e.g., DD and DT). The analyses of IRT parameters showed that most items functioned similarly across both the long and short version of D. According to the alpha values, the majority of items provided at least moderate information, and some items even high or very high information. All alpha values of D16 was in the common range of 0.5 to 2.0 for personality research (Morizot et al., Citation2007). Within D70, 7 items showed particularly low alpha values between 0.32 and 0.58 (see items marked as bold in Appendix A), of which more than half were reverse worded items. Low discrimination values for reverse worded items are a common pattern in personality scales (e.g., Sliter & Zickar, Citation2014). However, none of these items are included in D16, which might be one of the reasons for higher alpha values with D16. Another notable pattern within alpha value ranking was that specific items repeatedly landed in the lower third across the different scale versions (see items marked as bold in Appendix A). These findings could suggest that the mentioned items do not function well. However, cultural differences could be another plausible influence here. Garcia et al. (Citation2018) conducted an IRT on the Swedish translation of the Dirty Dozen scale and found that in contrast to the original English version, the narcissism subscale provided more information about the lack of narcissism in their Swedish sample. They reasoned that this might be due to the Swedish culture emphasizing the collective norms while individual achievements are seen of less value. These cultural differences could also have influenced the response behavior in our Swedish sample.
When looking at both the beta values as well as the plotted CRCs for all item sets, 4 items (d_2, d_35, d_46, and d_69) were missing a b5 value. Consequently, CRCs showed no probability curve for the endorsement of the highest item response category. This indicates that none of the participants endorsed the category representing the highest expression of D. This could compromise the functioning of those items. All of the three items are reverse coded and describe extreme situations of utility maximization. Item 2 states “All in all, it is better to be humble and honest than important and dishonest”, item 35 states “I am willing to volunteer for people in need”, item 46 states “Doing good deeds brings joy to the heart”, and item 69 states “It is sometimes worth a little suffering on my part to help others in need.” It is possible that the reverse coded nature of these items had a retrieval- or judgment-related influence on respondence behavior (Weijters & Baumgartner, Citation2012). Additionally, this finding could be a sample size issue, as other studies on the Dark Factor with bigger sample sizes (N > 10.000) did record small frequencies of response in the highest category for those items (Bader, Horsten, et al., Citation2022).
Furthermore, we observed an emerging pattern of positive beta values for the second response category in almost all items. CRCs therefore also showed more intersections of probability curves around the mean and above. This pattern shows that the items generally cover the positive side (above average) of the D continuum better than the negative side. In other words, an above-average level of the D (i.e., θ) already leads to a 50% probability of endorsing Likert-scale category 1 or 2 vs. 3 - 5. Therefore, D70 and D16 provide less information at low levels of D. This finding is in line with previous research on antagonistic personality scales like the Short Dark Triad (Burtăverde et al., Citation2022) or the Dirty Dozen (Garcia et al., Citation2018; Kajonius et al., Citation2016). Researchers explain this pattern by the fact that antagonistic traits are something in-between clinical traits and individual differences (Furnham et al., Citation2013). This is why one needs to theorize whether low scores represent prosocial behavior or rather the absence of antisocial behavior (Burtăverde et al., Citation2022). Based on the theoretical conceptualization of D as the core of all aversive traits, D can be interpreted as a continuum. Therefore, individuals with a low tendency of maximizing their individual utility while disregarding potential costs for others are expected to show low scores of D. In that way our findings are aligned with this conceptualization, as the item sets discriminate better between individuals with high scores of D. The negative end of the continuum might better be described by scales assessing opposite tendencies like prosocial behavior (e.g., the Light Triad; Kaufman et al., Citation2019).
Convergent validity
All three subscales of the Dirty Dozen (DD) scale showed acceptable Cronbach’s alpha and omega values in the present study, which is in line with other studies on the Swedish version of the DD (Garcia et al., Citation2017). SEM analyses of the associations between D and DD revealed strong and highly significant correlations between D and Machiavellianism and psychopathy. These associations can be interpreted as convergent validity in so far that D similarly measures antagonistic traits as these two sub facets of the Dark Triad. Interestingly, associations with narcissism were weak and non-significant. This finding can be explained by previous research on the structure of the English Dark Triad, suggesting that narcissism does not add a lot of information to the core concept of the Dark Triad (Kajonius et al., Citation2016). Additionally, an IRT analysis of the Swedish version of the DD revealed that items measuring narcissism might actually measure the lack of narcissism which could be due to cultural conditions within the Swedish sample (Garcia et al., Citation2018). On the contrary, a factor analysis of the Swedish DD found support for the suggested three-factor structure, however, model fit indices showed mixed results (Garcia et al., Citation2017).
Associations between D and six factors of personality were investigated by SEM analyses. No significant correlations were found between D and Neuroticism, Extraversion, and Conscientiousness, respectively. These findings indicate discriminant validity between those facets of personality and D. In contrast highly significant and strong correlations with D for Agreeableness and Honesty-Humility were found. Both links to Agreeableness and Honesty-Humility are in line with previous research that suggested both concepts as contenders for the core of antagonistic traits (Jakobwitz & Egan, Citation2006; Lee & Ashton, Citation2004; Vize et al., Citation2020). The strong correlations could be interpreted as high convergent validity, ultimately suggesting that they capture the same aspects of individual differences as D. However, other research indicated that this is not the case. Despite the high correlations between D and HH, D increases the prediction of a variety of criteria (e.g., Self-Centeredness, Aggression, Nurturance, and Perspective Taking) beyond Honesty-Humility (Moshagen et al., Citation2018). This indicates that the traits are distinct from each other as they provide unique information to increase predictions. Moreover, within a longitudinal design, low Honesty-Humility and D demonstrated distinct differences in accounting for different aversive traits, which indicates that both constructs can be understood as closely related but functionally different (Horsten et al., Citation2021). Arguably, this distinctiveness can be seen in the correlation pattern of D and the HH subscales of the present study. A completely overlapping construct would likely results in strong and stable correlations across subscales of HH. Regarding the distinctiveness between Agreeableness and D, there have been productive debates on whether the construct coverage of Agreeableness is sufficient or not (see Hilbig et al., Citation2021, Vize & Lynam, Citation2021; Vize et al., Citation2021). Both constructs share substantial similarities, but D may show stronger relations to outcome variables that are linked to the underlying theory of D, such as behavioral dishonesty, stereotypical sexualized behaviors, and internet trolling (Moshagen et al., Citation2020).
Implications and recommendations
The Swedish D70 and D16 are reliable measures as indicated by high omega and Cronbach’s alpha values. D70 and D16 also correlate highly. Based on the presented findings of CFA and IRT analyses, we recommend the use of the Swedish translation of D for various settings, especially when modeled as a single-factor D. Despite the superior fit of the bifactor model, for SEM we recommend using the single-factor model for the Swedish D70 in future research. This is based on the low H of the specific factors, which indicates that across multiple SEM studies the specific factors that comprise the themes of D would be too unstable. Note that this recommendation differs from Bader, Horsten, et al. (Citation2022), who solely recommend caution in interpreting the regression coefficients of the specific factors in the context of SEM (due to low internal consistency and ECV). We also found that most of the variance in the structures can be attributed to the general D-factor. Based on the low FD of the specific factors, we recommend not considering them as subscales, but rather recommend treating D as a unidimensional measure when working with manifest scores of D70.
Within IRT results there is a noteworthy pattern of beta values almost always crossing into a positive range in the second item response category. This suggests that D discriminates better between individuals at high underlying trait levels. This is in line with other research on antagonistic personality scales (Burtăverde et al., Citation2022; Garcia et al., Citation2018; Kajonius et al., Citation2016). Depending on the research objective, researchers should consider integrating scales measuring prosocial behavior such as the Light Triad (Kaufman et al., Citation2019), Agreeableness, or Honesty-Humility (HEXACO, Ashton & Lee, Citation2009). However, based on low discrimination values, non-ideal CRCs, and potential redundancies in D70, we argue that the shorter item set is sufficient and economic instruments for measuring antagonistic personality and recommend its use in an applied setting.
Limitations and future research
An important consideration is the size of the analyzed sample. The appropriate sample size for CFA is an ongoing debate. Factors like data non-normality or varying reliability scores can influence what is deemed appropriate (For details see Kyriazos, Citation2018). Based on Monte Carlo simulations, Bader et al. (Citation2022) recommend a minimum sample size of 150 - 500, for bifactor models with similar properties (average loading on general factor = .50; ECV = .50). Therefore, our sample can be deemed sufficient for the applied CFA analysis. We further argue that our applied screening and inclusion methods helped to ensure high data quality, increasing the appropriateness of our sample. Regarding sample sizes for IRT analysis, Morizot et al. (Citation2007) suggest taking many factors like model complexity, data structure, and sample heterogeneity into account. In general, models for polytomous items, such as D, require much larger sample sizes (Morizot et al., Citation2007). For items with a 5-point Likert scale, acceptable estimations of item parameters with a GRM require 500 or more participants (Reise & Yu, Citation1990), which our sample size does not reach. Thus, an IRT analysis with a bigger sample might lead to a more robust estimation of parameters. Moreover, regarding SEM analysis similar sample size considerations apply. The required sample size can vary from 30 to 500, depending on both, factor loadings, as well as the number of factors and indicators (Wolf et al., Citation2013).
Another limitation of the present study concerns differential item functioning (DIF). One hidden assumption of IRT is that estimated item parameters are valid for all individuals of the investigated population (Morizot et al., Citation2007). DIF applies if individuals from different groups (e.g., female vs. male) with the same latent trait have different patterns/probabilities of item responses. Considering that men have been found to score higher on antagonistic personality traits (Muris et al., Citation2017), future research should continue to investigate DIF across sex on the Dark Factor of Personality. Measurement invariance is important as it needs to be established to ensure that comparisons between groups can be done and interpreted in a meaningful way (International Test Commission, Citation2017; Meredith, Citation1993). Invariance for the English version of D regarding age and gender was attested (Hartung et al., Citation2022). For the German version of D, invariance regarding age groups was also found (Bader, Horsten, et al., Citation2022). Furthermore, by comparing the German and English versions partial strict invariance was established (Bader, Horsten, et al., Citation2022). We did not test for gender invariance in the present study due to sample size limitations.
Conclusion
We tested the structural validity, item functioning, and convergent validity of the Swedish translation of the Dark Factor of Personality. We established that the Swedish version is a reliable and valid measurement of D, similar to results based on other languages. The originally proposed bifactor model for D70 showed a good fit and D16 is suitably modeled by a single factor. However, we do not recommend the bifactor model for application in SEM analyses, due to low H values of the themes of D. Furthermore, reliability indices and IRT results favor the use of the more economic shorter item set, useful for applied settings. Both the full and short version of D showed expected convergent validity through associations with psychopathy and Machiavellianism, while no associations with narcissism. Moreover, D showed expected associations with personality traits measured by the Big Six (mini-IPIP6). However, the strong negative associations with HH and Agreeableness should be further discussed and tested with predictive models. Concluding, we recommend the use of both the full and brief versions of D in the Swedish language.
Disclosure statement
No potential conflict of interest was reported by the authors.
References
- Ashton, M. C., & Lee, K. (2007). Empirical, theoretical, and practical advantages of the HEXACO model of personality structure. Personality and Social Psychology Review, 11(2), 150–166. https://doi.org/10.1177/1088868306294907
- Ashton, M. C., & Lee, K. (2009). The HEXACO-60: A short measure of the major dimensions of personality. Journal of Personality Assessment, 91(4), 340–345. https://doi.org/10.1080/00223890902935878
- Bäckström, M. (2007). Higher-order factors in a five-factor personality inventory and its relation to social desirability. European Journal of Psychological Assessment, 23(2), 63–70. https://doi.org/10.1027/1015-5759.23.2.63
- Bader, M., Hartung, J., Hilbig, B. E., Zettler, I., Moshagen, M., & Wilhelm, O. (2021). Themes of the Dark Core of Personality. Psychological Assessment, 33(6), 511–525. https://doi.org/10.1037/pas0001006
- Bader, M., Horsten, L. K., Hilbig, B. E., Zettler, I., & Moshagen, M. (2022). Measuring the dark core of personality in German: Psychometric properties, measurement invariance, predictive validity, and self-other agreement. Journal of Personality Assessment, 104(5), 660–673. https://doi.org/10.1080/00223891.2021.1984931
- Bader, M., Jobst, L. J., & Moshagen, M. (2022). Sample size requirements for bifactor models. Structural Equation Modeling: A Multidisciplinary Journal, 29(5), 772–783. https://doi.org/10.1080/10705511.2021.2019587
- Baker, F. B. (2001). The basics of item response theory. ERIC Clearinghouse on Assessment and Evaluation. https://edres.org//irt/baker/
- Baker, F. B., & Kim, S.-H. (2017). The basics of item response theory using R. Springer. https://doi.org/10.1080/15366367.2018.1462078
- Becker, J. A. H., & Dan O’Hair, H. (2007). Machiavellians’ motives in organizational citizenship behavior. Journal of Applied Communication Research, 35(3), 246–267. https://doi.org/10.1080/00909880701434232
- Blais, J., Solodukhin, E., & Forth, A. E. (2014). A meta-analysis exploring the relationship between psychopathy and instrumental versus reactive violence. Criminal Justice and Behavior, 41(7), 797–821. https://doi.org/10.1177/0093854813519629
- Boateng, G. O., Neilands, T. B., Frongillo, E. A., Melgar-Quiñonez, H. R., & Young, S. L. (2018). Best practices for developing and validating scales for health, social, and behavioral research: A primer. Frontiers in Public Health, 6, 149. https://doi.org/10.3389/fpubh.2018.00149
- Bonifay, W., Reise, S. P., Scheines, R., & Meijer, R. R. (2015). When are multidimensional data unidimensional enough for structural equation modeling? An evaluation of the DETECT multidimensionality index. Structural Equation Modeling: A Multidisciplinary Journal, 22(4), 504–516. https://doi.org/10.1080/10705511.2014.938596
- Browne, M. W., & Cudeck, R. (1992). Alternative ways of assessing model fit. Sociological Methods & Research, 21(2), 230–258. https://doi.org/10.1177/0049124192021002005
- Buckels, E. E., Jones, D. N., & Paulhus, D. L. (2013). Behavioral confirmation of everyday sadism. Psychological Science, 24(11), 2201–2209. https://doi.org/10.1177/0956797613490749
- Burtăverde, V., Oprea, B., Miulescu, A., & Ene, C. (2022). Seeking important people and taking revenge: Network and IRT analysis of the Short Dark Triad (SD3). Current Psychology, 1–15. https://doi.org/10.1007/s12144-022-02969-4
- Castro, Á., Barrada, J. R., Ramos-Villagrasa, P. J., & Fernández-Del-Río, E. (2020). Profiling dating apps users: Sociodemographic and personality characteristics. International Journal of Environmental Research and Public Health, 17(10), 3653. https://doi.org/10.3390/ijerph17103653
- Costa, P. T., & McCrae, R. R. (1985). The NE0 personality imentory manual. Psychological Assessment Resources.
- Costa, P. T., McCrae, R. R., & Dye, D. A. (1991). Facet scales for agreeableness and conscientiousness: A revision of tshe NEO personality inventory. Personality and Individual Differences, 12(9), 887–898. https://doi.org/10.1016/0191-8869(91)90177-D
- Crysel, L. C., Crosier, B. S., & Webster, G. D. (2013). The Dark Triad and risk behavior. Personality and Individual Differences, 54(1), 35–40. https://doi.org/10.1016/j.paid.2012.07.029
- DeMars, C. (2010). Item response theory. Oxford University Press. https://doi.org/10.1093/acprof:oso/9780195377033.001.0001
- Donnellan, M. B., Oswald, F. L., Baird, B. M., & Lucas, R. E. (2006). The Mini-IPIP scales: Tiny-yet-effective measures of the Big Five factors of personality. Psychological Assessment, 18(2), 192–203. https://doi.org/10.1037/1040-3590.18.2.192
- Dueber, D. M. (2017). Bifactor indices calculator: A Microsoft Excel-based tool to calculate various indices relevant to bifactor CFA models. https://doi.org/10.13023/edp.tool.01
- Eid, M., Geiser, C., Koch, T., & Heene, M. (2017). Anomalous results in G -factor models: Explanations and alternatives. Psychological Methods, 22(3), 541–562. https://doi.org/10.1037/met0000083
- Embretson, S. E., & Reise, S. P. (2000). Item response theory for psychologists. Lawrence Erlbaum Associates Publishers.
- Furnham, A., Richards, S. C., & Paulhus, D. L. (2013). The dark triad of personality: A 10 year review. Social and Personality Psychology Compass, 7(3), 199–216. https://doi.org/10.1111/spc3.12018
- Garcia, D., MacDonald, S., & Rapp-Ricciardi, M. (2017). Factor analysis of the Swedish version of the Dark Triad Dirty Dozen. PsyCh Journal, 6(2), 166–167. https://doi.org/10.1002/pchj.168
- Garcia, D., Persson, B. N., Al Nima, A., Brulin, J. G., Rapp-Ricciardi, M., & Kajonius, P. J. (2018). IRT analyses of the Swedish Dark Triad Dirty Dozen. Heliyon, 4(3), e00569. https://doi.org/10.1016/j.heliyon.2018.e00569
- Garcia, D., Rosenberg, P., MacDonald, S., Räisänen, C., & Ricciardi, M. R. (2017). Measuring malevolent character: Data using the Swedish version of Jonason’s Dark Triad Dirty Dozen. Data in Brief, 14, 648–652. https://doi.org/10.1016/j.dib.2017.08.020
- Goldberg, L. R. (1999). A broad-bandwidth, public domain, personality inventory measuring the lower-level facets of several five-factor models. In I. Mervielde, I. Deary, F. De Fruyt, & F. Ostendorf (Eds.), Personality psychology in Europe (pp. 7–28) Tilburg University Press.
- Gorsuch, R. L. (1988). Exploratory Factor Analysis. In J. R. Nesselroade & R. B. Cattell (Eds.), Handbook of multivariate experimental psychology (pp. 231–258). Springer US. https://doi.org/10.1007/978-1-4613-0893-5_6
- Hancock, G. R. (2001). Effect size, power, and sample size determination for structured means modeling and MIMIC approaches to between-groups hypothesis testing of means on a single latent construct. Psychometrika, 66(3), 373–388. https://doi.org/10.1007/BF02294440
- Hancock, G. R., & Mueller, R. O. (2001). Rethinking construct reliability within latent variable systems. In R. Cudeck, S. du Toit, & D. Sörbom (Eds.), Structural equation modeling: Present and future: A Festschrift in honor of Karl Jöreskog (pp. 195–216). Scientific Software International.
- Hare, R. D. (1985). Comparison of procedures for the assessment of psychopathy. Journal of Consulting and Clinical Psychology, 53(1), 7–16. https://doi.org/10.1037/0022-006X.53.1.7
- Hartung, J., Bader, M., Moshagen, M., & Wilhelm, O. (2022). Age and gender differences in socially aversive (“dark”) personality traits. European Journal of Personality, 36(1), 3–23. https://doi.org/10.1177/0890207020988435
- Hilbig, B. E., Moshagen, M., Horsten, L. K., & Zettler, I. (2021). Agreeableness is dead. Long live Agreeableness? Reply to Vize and Lynam. Journal of Research in Personality, 91, 104074. https://doi.org/10.1016/j.jrp.2021.104074
- Horsten, L. K., Moshagen, M., Zettler, I., & Hilbig, B. E. (2021). Theoretical and empirical dissociations between the dark factor of personality and low honesty-humility. Journal of Research in Personality, 95, 104154. https://doi.org/10.1016/j.jrp.2021.104154
- Hudek-Knezevic, J., Kardum, I., & Banov, K. (2021). The effects of the Dark Triad personality traits on health protective behaviours: Dyadic approach on self-reports and partner-reports. Psychology & Health, 1–19. https://doi.org/10.1080/08870446.2021.1998497
- Hughes, S., & Samuels, H. (2021). Dark desires: The Dark Tetrad and relationship control. Personality and Individual Differences, 171, 110548. https://doi.org/10.1016/j.paid.2020.110548
- International Test Commission. (2017). The ITC guidelines for translating and adapting tests (pp. 1–41). www.InTestCom.org
- Jakobwitz, S., & Egan, V. (2006). The dark triad and normal personality traits. Personality and Individual Differences, 40(2), 331–339. https://doi.org/10.1016/j.paid.2005.07.006
- Jonason, P. K., & Webster, G. D. (2010). The dirty dozen: A concise measure of the dark triad. Psychological Assessment, 22(2), 420–432. https://doi.org/10.1037/a0019265
- Jones, D. N., & Figueredo, A. J. (2013). The core of darkness: Uncovering the heart of the dark triad. European Journal of Personality, 27(6), 521–531. https://doi.org/10.1002/per.1893
- Jones, D. N., & Paulhus, D. L. (2014). Introducing the short dark triad (SD3): A brief measure of dark personality traits. Assessment, 21(1), 28–41. https://doi.org/10.1177/1073191113514105
- Kajonius, P. J. (2014). Honesty-humility in contemporary students: Manipulations of self-image by inflated IQ estimations. Psychological Reports, 115(1), 311–325. https://doi.org/10.2466/17.04.PR0.115c13z8
- Kajonius, P. J. (2016). Honesty-Humility predicting self-estimated academic performance. International Journal of Personality Psychology, 2(1), 1–6. https://doi.org/10.21827/a3374008-1e51-028e-cf60-f7988e238525
- Kajonius, P. J., & Björkman, T. (2020a). Dark malevolent traits and everyday perceived stress. Current Psychology, 39(6), 2351–2356. https://doi.org/10.1007/s12144-018-9948-x
- Kajonius, P. J., & Björkman, T. (2020b). Individuals with dark traits have the ability but not the disposition to empathize. Personality and Individual Differences, 155, 109716. https://doi.org/10.1016/j.paid.2019.109716
- Kajonius, P. J., Persson, B. N., Rosenberg, P., & Garcia, D. (2016). The (mis)measurement of the Dark Triad Dirty Dozen: Exploitation at the core of the scale. PeerJ, 4, e1748. https://doi.org/10.7717/peerj.1748
- Kaufman, S. B., Yaden, D. B., Hyde, E., & Tsukayama, E. (2019). The light vs. dark triad of personality: Contrasting two very different profiles of human nature. Frontiers in Psychology, 10, 467. https://doi.org/10.3389/fpsyg.2019.00467
- Kyriazos, T. A. (2018). Applied psychometrics: Sample size and sample power considerations in factor analysis (EFA, CFA) and SEM in general. Psychology, 9(8), 2207–2230. https://doi.org/10.4236/psych.2018.98126
- Lee, K., & Ashton, M. C. (2004). Multivariate behavioral psychometric properties of the HEXACO personality inventory psychometric properties of the HEXACO personality inventory. Multivariate Behavioral Research, 39(2), 329–358. https://doi.org/10.1207/s15327906mbr3902
- Lee, K., & Ashton, M. C. (2005). Psychopathy, machiavellianism, and narcissism in the five-factor model and the HEXACO model of personality structure. Personality and Individual Differences, 38(7), 1571–1582. https://doi.org/10.1016/j.paid.2004.09.016
- McDonald, R. P. (2013). Test theory: A unified treatment. Psychology Press.
- Meredith, W. (1993). Measurement invariance, factor analysis and factorial invariance. Psychometrika, 58(4), 525–543. https://doi.org/10.1007/BF02294825
- Miller, J. D., Vize, C., Crowe, M. L., & Lynam, D. R. (2019). A critical appraisal of the dark-triad literature and suggestions for moving forward. Current Directions in Psychological Science, 28(4), 353–360. https://doi.org/10.1177/0963721419838233
- Morf, C. C., & Rhodewalt, F. (2001). Unraveling the paradoxes of narcissism: A dynamic self-regulatory processing model. Psychological Inquiry, 12(4), 177–196. https://doi.org/10.1207/S15327965PLI1204_1
- Morizot, J. M., Ainsworth, A. T., & Reise, S. P. (2007). Towards modern psychometrics: Application ofitem response theory models in personality research. In R. Robins, R. Fraley, & R. Krueger (Eds.), Handbook ofresearch methods in personality psychology (pp. 407–423). Guilford Press.
- Moshagen, M., & Auerswald, M. (2018). On congruence and incongruence of measures of fit in structural equation modeling. Psychological Methods, 23(2), 318–336. https://doi.org/10.1037/met0000122
- Moshagen, M., Zettler, I., & Hilbig, B. E. (2018). The dark core of personality. Psychological Review, 125(5), 656–688. https://doi.org/10.1037/pas0000778
- Moshagen, M., Zettler, I., & Hilbig, B. E. (2020). Measuring the dark core of personality. Psychological Assessment, 2(32), 182–196. https://doi.org/10.1037/pas0000778
- Moshagen, M., Zettler, I., Horsten, L. K., & Hilbig, B. E. (2020). Agreeableness and the common core of dark traits are functionally different constructs. Journal of Research in Personality, 87, 103986. https://doi.org/10.1016/j.jrp.2020.103986
- Muraki, E. (1992). A generalized partial credit model: Application of an EM algorithm. ETS Research Report Series, 1, 1–30. https://doi.org/10.1002/j.2333-8504.1992.tb01436.x
- Muris, P., Merckelbach, H., Otgaar, H., & Meijer, E. (2017). The malevolent side of human nature: A meta-analysis and critical review of the literature on the dark triad (narcissism, Machiavellianism, and psychopathy). Perspectives on Psychological Science, 12(2), 183–204. https://doi.org/10.1177/1745691616666070
- O’Boyle, E. H., Forsyth, D. R., Banks, G. C., & McDaniel, M. A. (2012). A meta-analysis of the Dark Triad and work behavior: A social exchange perspective. Journal of Applied Psychology, 97(3), 557–579. https://doi.org/10.1037/a0025679
- Paulhus, D. L., Buckels, E. E., Trapnell, P. D., & Jones, D. N. (2020). Screening for dark personalities. European Journal of Psychological Assessment, 37, 208–222. https://doi.org/10.1027/1015-5759/a000602
- Paulhus, D. L., & Williams, K. M. (2002). The dark triad of personality: Narcissism, Machiavellianism, and psychopathy in everyday life. Journal of Research in Personality, 36(6), 556–563. https://doi.org/10.1016/C2017-0-01262-4
- Persson, B. N., Kajonius, P. J., & Garcia, D. (2019). Revisiting the structure of the short dark triad. Assessment, 26(1), 3–16. https://doi.org/10.1177/1073191117701192
- Prusik, M., Konopka, K., & Kocur, D. (2021). Too many shades of gray: The Dark Triad and its linkage to coercive and coaxing tactics to obtain sex and the quality of romantic relationships. Personality and Individual Differences, 170, 110413. https://doi.org/10.1016/j.paid.2020.110413
- R Core Team. (2020). R: A language and environment for statistical computig. R Foundation for Statistical Computing. https://www.r-project.org/
- Reise, S. P. (2012). The rediscovery of bifactor measurement models. Multivariate Behavioral Research, 47(5), 667–696. https://doi.org/10.1080/00273171.2012.715555
- Reise, S. P., Bonifay, W., & Haviland, M. G. (2013). Scoring and modeling psychological measures in the presence of multidimensionality. Journal of Personality Assessment, 95(2), 129–140. https://doi.org/10.1080/00223891.2012.725437
- Reise, S. P., Scheines, R., Widaman, K. F., & Haviland, M. G. (2013). Multidimensionality and structural coefficient bias in structural equation modeling: A bifactor perspective. Educational and Psychological Measurement, 73(1), 5–26. https://doi.org/10.1177/0013164412449831
- Reise, S. P., & Yu, J. (1990). Parameter recovery in the graded response model using multilog. Journal of Educational Measurement, 27(2), 133–144. https://doi.org/10.1111/j.1745-3984.1990.tb00738.x
- Rizopoulos, D. (2006). LTM: An R package for latent variable modeling and item response theory analyses. Journal of Statistical Software, 17(5), 1–25. https://doi.org/10.18637/jss.v017.i05
- Rodriguez, A., Reise, S. P., & Haviland, M. G. (2016a). Applying bifactor statistical indices in the evaluation of psychological measures. Journal of Personality Assessment, 98(3), 223–237. https://doi.org/10.1080/00223891.2015.1089249
- Rodriguez, A., Reise, S. P., & Haviland, M. G. (2016b). Evaluating bifactor models: Calculating and interpreting statistical indices. Psychological Methods, 21(2), 137–150. https://doi.org/10.1037/met0000045
- Rosseel, Y. (2012). Lavaan: An R package for structural equation modeling. Journal of Statistical Software, 48(2), 1–36. https://doi.org/10.18637/jss.v048.i02
- Samejima, F. (1997). Graded response model. In W. J. van der Linden & R. K. Hambleton (Eds.), Handbook of modern item response theory (pp. 85–100). Springer New York. https://doi.org/10.1007/978-1-4757-2691-6_5
- Satorra, A., & Bentler, P. M. (2001). A scaled difference chi-square test statistic for moment structure analysis. Psychometrika, 66(4), 507–514. https://doi.org/10.1007/BF02296192
- Schrödter, R., Laborde, S., & Allen, M. S. (2021). The dark core of personality and sexism in sport. Personality and Individual Differences, 183, 111119. https://doi.org/10.1016/j.paid.2021.111119
- Ścigała, K. A., Schild, C., Moshagen, M., Lilleholt, L., Zettler, I., Stückler, A., & Pfattheicher, S. (2021). Aversive personality and COVID-19. European Psychologist, 26(4), 348–358. https://doi.org/10.1027/1016-9040/a000456
- Sevi, B., Urganci, B., & Sakman, E. (2020). Who cheats? An examination of light and dark personality traits as predictors of infidelity. Personality and Individual Differences, 164, 110126. https://doi.org/10.1016/j.paid.2020.110126
- Sibley, C. G., Luyten, N., Purnomo, M., Mobberley, A., Wootton, L. W., Hammond, M. D., Sengupta, N., Perry, R., West-Newman, T., Wilson, M. S., McLellan, L., Hoverd, W. J., & Robertson, A. (2011). The Mini-IPIP6: Validation and extension of a short measure of the Big-Six factors of personality in New Zealand. New Zealand Journal of Psychology, 40(3), 142–159.
- Sliter, K. A., & Zickar, M. J. (2014). An IRT examination of the psychometric functioning of negatively worded personality items. Educational and Psychological Measurement, 74(2), 214–226. https://doi.org/10.1177/0013164413504584
- Tavakol, M., & Dennick, R. (2011). Making sense of Cronbach’s alpha. International Journal of Medical Education, 2, 53–55. https://doi.org/10.5116/ijme.4dfb.8dfd
- Ten Berge, J. M. F., & Sočan, G. (2004). The greatest lower bound to the reliability of a test and the hypothesis of unidimensionality. Psychometrika, 69(4), 613–625. https://doi.org/10.1007/BF02289858
- Tiwari, S., Moshagen, M., Hilbig, B. E., & Zettler, I. (2021). The dark factor of personality and risk-taking. International Journal of Environmental Research and Public Health, 18(16), 8400. https://doi.org/10.3390/ijerph18168400
- Vize, C. E., Collison, K. L., Miller, J. D., & Lynam, D. R. (2020). The “Core” of the Dark Triad: A test of competing hypotheses. Personality Disorders: Theory, Research, and Treatment, 11(2), 91–99. https://doi.org/10.1037/per0000386
- Vize, C. E., & Lynam, D. R. (2021). On the importance of the assessment and conceptualization of Agreeableness: A commentary on “Agreeableness and the common core of dark traits are functionally different constructs. Journal of Research in Personality, 90, 104059–104148. https://doi.org/10.1016/j.jrp.2020.104059
- Vize, C. E., Miller, J. D., & Lynam, D. R. (2021). Examining the conceptual and empirical distinctiveness of Agreeableness and “dark” personality items. Journal of Personality, 89(3), 594–612. https://doi.org/10.1111/jopy.12601
- Weijters, B., & Baumgartner, H. (2012). Misresponse to reversed and negated items in surveys: A review. Journal of Marketing Research, 49(5), 737–747. https://doi.org/10.1509/jmr.11.0368
- Wolf, E. J., Harrington, K. M., Clark, S. L., & Miller, M. W. (2013). Sample size requirements for structural equation models: An evaluation of power, bias, and solution propriety. Educational and Psychological Measurement, 73(6), 913–934. https://doi.org/10.1177/0013164413495237
- Yuan, K.-H., & Bentler, P. M. (2000). Three likelihood-based methods for mean and covariance structure analysis with nonnormal missing data. Sociological Methodology, 30(1), 165–200. https://doi.org/10.1111/0081-1750.00078
- Zhang, B., Sun, T., Cao, M., & Drasgow, F. (2021). Using bifactor models to examine the predictive validity of hierarchical constructs: Pros, cons, and solutions. Organizational Research Methods, 24(3), 530–571. https://doi.org/10.1177/1094428120915522
Appendix A
Table
Appendix B.
Descriptive statistics for all items of D70
Appendix C.
IRT parameters for D70
Appendix C.
IRT parameters for D16
Appendix D
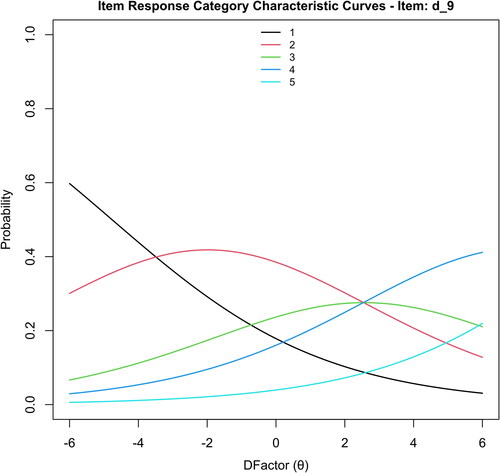
To illustrate item quality, and show two different CRCs of item 64 and 9 of the D70 scale. Item d_64 () showed distinct peaks between the individual probability curves, which can be explained by the high α of 1.92. This item can discriminate well between individuals with different levels of D (θ). However, the curves are not evenly spread out through the whole continuum of the D Factor, which links back to the threshold parameters (β). For item d_64 they were as follows: β1 = −0.09; β2 = 1.22; β3 = 2.15; β4 = 3.37. Those values mark the intersections between the probability curves, which can also be seen in . The CRC for item d_9 () differed greatly. The threshold values showed a wide spread along the continuum (β1 = −4.77; β2 = 0.80; β3 = 4.33; β4 = 9.96), but due to the very low α of 0.32, the probability curves did not show distinct peaks, which means that item d_9 cannot discriminate well between individuals with different trait levels (θ). Consider for example an individual with a θ of around 2.5. According to the CRC of item 9, this individual has the same probability of endorsing item category 2, 3, or 4.
Figure 2. Category Response Curve for Item d_64 in D70.
Note. Item d_64 states “Success is based on survival of the fittest; I am not concerned about the losers.” Item d_64 showed the highest α value (1.92) across D70. Probability curves show the most likely item response category (1 to 5) across the continuum of D. The ordered curves show distinct peaks, indicating good discrimination between individuals.
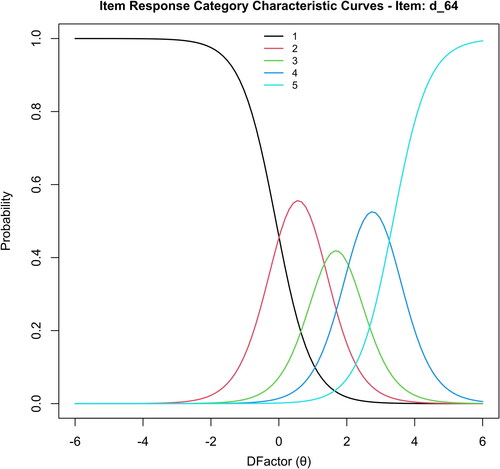
Figure 3. Category Response Curve for Item d_9 in D70.
Note. Item d_9 is reverse coded and states “It is not okay to spread rumors, not even to defend those you care about.” Item d_9 showed the lowest α value (0.32) across D70. Probability curves show the most likely item response category (1 to 5) across the continuum of D. The unordered curves without distinct peaks indicate poor discrimination between individuals.
Appendix E.
CRC curves for all items of D70
Appendix E.
CRCs for all items of D16
Appendix F.
Item information functions for all items of D70
Appendix F.
Item information functions for all items in D16