
Abstract
We focus on the relationships among administrative delay, red tape, and red tape–related organizational performance. We hypothesize that administrative delay leads to more red tape, more complaints from clients about red tape, and makes it more difficult for organizations to serve their clients. We test our hypotheses using data from the National Administrative Studies Project - Citizen, gathered on Amazon Mechanical Turk in late 2014 (n = 1,254). The results support each of the hypotheses. The findings imply that managers may improve organizational performance by identifying and addressing the specific sources of administrative delay, rather than focusing on general perceptions of organizational red tape.
A growing body of knowledge in public administration is concerned with shedding light on the association between pathological written rules or red tape and various other concepts at the level of the organization and the individual (Bozeman & Feeney, Citation2011; Brewer, Walker, Bozeman, Avellaneda, & Brewer Jr., Citation2012). For example, red tape has been studied in the contexts of organizational effectiveness (Pandey, Coursey, & Moynihan, Citation2007), organizational risk culture (Bozeman & Kingsley, Citation1998), and public service motivation (Scott & Pandey, Citation2005). Yet, there is a dearth of research on predictors of red tape. This is where we seek to make our contribution.
Earlier work on red tape argued that red tape is predicted by administrative delay of core organizational tasks, such as purchasing equipment, and hiring personnel (Bretschneider, Citation1990; Pandey & Bretschneider, Citation1997). The authors of those earlier studies were careful to underscore that administrative delay measures do not and cannot actually map the red tape concept space, because red tape is more than an administrative burden or delay alone. Rather, red tape “has no redeeming social value” (Bozeman, Citation1993, p. 283). In this study, we return to the idea of administrative delay as a predictor rather than the actual embodiment of red tape (Pandey & Welch, Citation2005). We are interested in administrative delay’s effects on organizational performance. In particular, we hypothesize that administrative delay within the organization leads employees to perceive more red tape complaints from clients about services and products received from the organization, and affects the organization’s ability to serve clients as a result of red tape.
We test our hypotheses using data from the National Administrative Studies Project-Citizen (NASP-C) gathered on Amazon Mechanical Turk (MTurk) in late 2014. MTurk is a platform that enables researchers to recruit people to perform short tasks, called “Human Intelligence Tasks” or HITs (Kittur, Chi, & Suh, Citation2008; Little, Chilton, Goldman, & Miller, Citation2009; Novotney & Callison-Burch, Citation2010). NASP-C surveyed 3,500 respondents from the United States and asked a variety of questions regarding client red tape, administrative delay, collaboration, social media, mentoring, and volunteering. The NASP-C sample was for all organization types, not restricted by sector or by organizational function, and aims to capture the overall proportion of public, private, and nonprofit organizations in the United States.
The structure of the article is as follows. First, we disentangle administrative delay and red tape. Next, we focus on the relationship between administrative delay, red tape, and organizational performance. We follow with a discussion of the data, our efforts to ensure data reliability and quality, as well as the limits to generalizability of the data. This is followed by our methods and results sections. The final section discusses empirical findings, contributions to theory, and directions for future research.
Disentangling administrative delay and red tape
Most red tape studies look at so-called organizational red tape, which can be defined as “rules, regulations, and procedures that remain in force and entail a compliance burden for the organization but have no efficacy for the rules’ functional object” (Bozeman, Citation1993, p. 283). In a nutshell, organizational red tape studies have compared self-reported red tape measures with outcome variables at the level of the organization and the individual, including organizational effectiveness (Pandey, Coursey, & Moynihan, Citation2007), bureaucratic behavior (Scott & Pandey, Citation2000), and procedural satisfaction (Kaufmann & Tummers, Citation2017).
An alternative approach for understanding the deleterious effects of organizational rules is to look at administrative delay. Administrative delay captures the amount of time required to complete core organizational tasks such as purchasing items, hiring and firing personnel, contracting services, and changing policies (Bretschneider, Citation1990; DeHart-Davis & Bozeman, Citation2001). Administrative delays are associated with organizational interest in information technology (Pandey & Bretschneider, Citation1997) and affect organizational risk-taking culture (Bozeman & Kingsley, Citation1998).
Delays may be caused by ineffective rules or by bad management, but delays may also be attributed to differences in norms and informal behavior or to uncontrollable events (Bozeman & Feeney, Citation2011). Furthermore, delays can derive from organizational centralization, or a lack of resources. Most important, the very notion of administrative delay is essentially a social construction. How much time is required to, say, purchase a new computer can be viewed as an objective indicator (e.g., “the purchasing request began on May 1, the computer arrived on June 1, and the time required for purchase was one month”). But is that time required a delay? The answer to this question depends upon individual perceptions, experiences, and expectations, all of which are important but not objective (Pandey & Kingsley, Citation2000).
Indeed, perceptions play an important role in our conceptualization of both administrative delay and red tape. This perceptual approach is in line with various existing red tape studies (DeHart-Davis & Pandey, Citation2005; Pandey, Pandey, & van Ryzin, Citation2017), as well as the related literature on administrative burden (Moynihan, Herd, & Harvey, Citation2015). For example, Pandey and Kingsley (Citation2000) emphasize the importance of taking the level of the individual into account when trying to understand red tape and its predictors. Specifically, the authors find support for their hypothesis that managers with higher levels of work alienation report higher levels of red tape. Walker and Brewer (Citation2008) find that individuals perceive red tape and its determinants differently depending on their hierarchical position in the organization. Since tasks, responsibilities, and authority differ between internal stakeholder groups, so do reported levels of red tape. Furthermore, Moynihan, Wright, and Pandey (Citation2012) show that transformational leadership can alter red tape as experienced by managers through goal clarity, political support, and internal communication. Similarly, the literature on administrative burden is mostly concerned with an individual’s perceptions of policy implementation as onerous (Burden, Canon, Mayer, & Moynihan, Citation2012).
Scott and Pandey (Citation2005) use a different theoretical approach and draw on attribution theory to argue that individuals assign the causes of their circumstances to either an external force, or to factors internal to the individual. Individuals with an external attribution are more likely to perceive rules as unnecessary, illegitimate and something beyond their control as opposed to individuals with an internal attribution (Scott & Pandey, Citation2005). The attribution perspective is tested experimentally by Davis and Pink-Harper (Citation2016, p. 181), who find that “individuals will judge a rule to be red tape based on information conveyed second-hand regarding the rule-breaking behavior of others.” In the context of administrative delay, individuals with an external attribution are likely to feel more frustrated and vexed as a result of certain rules than individuals with an internal attribution. In turn, these feelings of frustration about delays will likely be associated with higher levels of red tape.
Finally, Pandey and Welch (Citation2005) put forward a theoretical model of perceived red tape, linking red tape to administrative delay and work alienation. The authors suggest that administrative delay likely leads to higher levels of red tape, as administrative delay hinders the achievement of goals and objectives, both for the individual employee and the organization as a whole. Overall, then, there is much support in the literature to suggest that administrative delay negatively affects red tape, which leads to our first hypothesis:
H1: Administrative delay negatively affects red tape.
Administrative delay, red tape, and organizational performance
After having disentangled administrative delay and red tape, we now turn to administrative delay’s effects on organizational performance. Evidently, organizational performance is a very broad concept that has been studied in a multitude of contexts. While many existing studies focus on performance management and measurement in the public sector (Kroll, Citation2015; Mausolff, Citation2004; van Thiel & Leeuw, Citation2002), there is little research on the detrimental effects of red tape on organizational performance. Here, we focus in particular on two dimensions of performance related to red tape, namely red tape complaints made to the organization by clients and employee perceptions that red tape hinders their service abilities. Linking the study of administrative delay to these red tape–related organizational performance dimensions is in line with the existing red tape literature (Bozeman & Feeney, Citation2011; Davis & Pink-Harper, Citation2016), as well as a wealth of prior research in public administration that looks at the performance of public organizations in terms of serving their clients’ needs (Alford, Citation2002; Vigoda, Citation2002).
Generally speaking, organizational performance suffers if organizational rules are pathological (Bozeman, Citation1993; Bozeman & Scott, Citation1996; Pandey, Coursey, & Moynihan, Citation2007), and a number of studies empirically investigate associations between red tape and different organizational performance dimensions. For example, Brewer and Walker (Citation2010) study the impact of different types of red tape on the performance of local English government. In another study, Pandey and Moynihan (Citation2006) find that culture and political support moderate the negative relationship between red tape and performance. Scott and Pandey (Citation2000) use an experiment to show how higher levels of red tape reduce the level of benefits provided to clients, while Yang and Pandey (Citation2007) find that red tape in decision making is negatively associated with public responsiveness of government organizations. Finally, Jacobsen and Jakobsen (Citation2018) conclude that red tape perceptions of teachers in Danish upper secondary schools are negatively related to objective performance measures, albeit weakly. Yet, no existing work has explicitly included administrative delay in their analyses of red tape and performance.
One can certainly imagine that delays would affect red tape–related organizational performance. In the first place, we know that the amount of time spent waiting for goods and services is a key element of both customer satisfaction (Conner-Spady, Sanmartin, Johnston, McGurran, Kehler, & Noseworthy, Citation2011; Kumar, Kalwani, & Dada, Citation1997; Tom & Lucey, Citation1995; Wen & Chi, Citation2013) and, less studied, government agencies’ client satisfaction (Manolitzas & Yannacopoulos, Citation2013; Mugion & Musella, Citation2013). Administrative delays within an organization likely affect completion and delivery times for products and services. Since delays are a predictor of red tape, dissatisfied clients are more likely to voice red tape complaints to the organization if they have to wait for a (disproportionately) long time to receive their product or service, thus making the issue of delays more salient to the organization. This reasoning leads to our second hypothesis:
H2: Administrative delay negatively affects red tape–related client complaints.
The concept of administrative delay has been studied in a variety of fields and to a variety of purposes. For example, legal scholars have focused on effects of delay on legal justice (Cramton, Citation1972; O’Keeffe, Citation1985), economists have emphasized impacts on regulation (Farber, Citation1992; Macey, Citation1992), and political scientists have attended to the use of administrative delay as a tool for political control (Balla, Citation1998). No field has been more active than public administration in conducting studies of administrative delay. Most often, however, the focus of studies of administrative delay has been as an operationalization of red tape (Pandey & Bretschneider, Citation1997), with researchers acknowledging that administrative delay is a surrogate indicator of red tape and not a perfect one (Bozeman & Feeney, Citation2011; Bozeman, Reed, & Scott, Citation1992).
Since most previous research in public administration has used administrative delay as an operationalization of red tape, it stands to reason that there has been minimal focus on its causal effects on perceived red tape. The effects are not patent. For example, it is at least possible that administrative delay, if steady and unchanging, would have no effect at all on perceived red tape but rather would have an effect on shaping baseline perceptions and expectations. In this light, administrative delay can result in adverse effects on organizations’ employees who may feel frustrated and discouraged when often confronting delays viewed as unwarranted (Dressel, Citation1982; Franco, Bennett, & Kanfer, Citation2002; Hoy, Blazovsky, & Newland, Citation1983) and we can expect that these feelings may in some instances spill over to reduced quality of service abilities.
Let us consider a core organizational task, namely the hiring of employees (Bozeman & Bretschneider, Citation1994; DeHart-Davis & Bozeman, Citation2001), to support our argument that administrative delay does indeed make it harder for organizations to serve clients. In order to hire new employees, organizations will normally have to follow a formal hiring process that is transparent and nondiscriminatory. Although the main features of such a process may be similar across organizations, the specific characteristics and implementation of the process may differ substantially from one organization to the next. In this light, some organizations may review job applications whenever they come in, whereas other organizations only review job applications once a month. Even if there is an application deadline in both scenarios, being able to review applications during the month means that part of the workload is shifted to the period preceding the deadline. This implies that the hiring process can be sped up and less time is required for new hires.
From an employee perspective, administrative delay in the hiring process means that a position will take longer to fill. In turn, this delay could imply that fewer employees are available to serve clients, overburdening current employees. For example, administrative delay in the hiring process can mean that a postal office only has four counters open for serving clients at a random point in time, instead of five. This situation implies that the four employees that are currently working will: (1) need to work harder until a new colleague is hired, (2) are more likely to make mistakes because they are overburdened, and (3), as a result of (1) and (2), may be less motivated and feel more alienated. As a result of these dynamics, organizational performance will likely suffer. This leads to our third hypothesis.
H3: Administrative delay negatively affects red tape–related service ability.
Data and methods
Data and data collection procedure
The data for this research comes from the 2014 National Administration Studies Project-Citizen (NASP-C), which was created on the survey platform Qualtrics and administered on Amazon Mechanical Turk (MTurk), a crowdsourcing platform where users can request human workers to perform “Human Intelligence Tasks” or HITs. HITs are often short tasks that cannot be automated, thus requiring a real person (Little, Chilton, Goldman, & Miller, Citation2009).
Increasingly, researchers in many social science fields have employed MTurk as a source of data, especially in the implementation of survey questionnaires and survey-based quasiexperiments. Social scientists from a range of disciplines, such as political science (Arceneaux, Citation2012; Berinsky, Huber, & Lenz, Citation2012; Dowling & Wichowsky, Citation2015; Healy & Lenz, Citation2014); behavioral science (Chandler, Mueller, & Paolacci, Citation2013; Horton, Rand, & Zeckhauser, Citation2011); psychology (Buhrmester, Kwang, & Gosling, Citation2011; Eriksson & Simpson, Citation2011; Fishbach, Henderson, & Koo, Citation2011); and public administration (Jilke, van Ryzin, & van de Walle, Citation2016; Marvel, Citation2014, Citation2015, Citation2016) have used crowdsourcing platforms like MTurk to obtain data for research purposes.
Although different crowdsourcing platforms exist, MTurk has the largest worker base with over 500,000 “Turkers” in 190 countries as of 2014 (Paolacci & Chandler, Citation2014). This large number of participants makes observational studies of various subgroups possible, although it is important to understand the characteristics of those participating. While MTurk—as every data approach—has limitations, many observers (for an overview, see Cheung, Burns, Sinclair, & Sliter, Citation2017) agree that it has some strengths compared to other survey data sources, including the ability to filter respondents according to research needs; avoidance of the increasingly intractable problem of declining response rates; checks on the quality and attentiveness to survey-related tasks; and the ability to compare the demographics of respondents with those of the population of interest. In a critical review comparing studies using MTurk and conventional survey data, Mortensen and Hughes (Citation2018, p. 1) conclude that “the literature overwhelmingly concludes that MTurk is an efficient, reliable, cost-effective tool for generating sample responses that are largely comparable to those collected via more conventional means.” However, like all research data sources, MTurk has its weaknesses, reviewed in the section below.
Our 2014 NASP survey was limited to Turkers located in the United States and included various questions about the respondents’ job and educational experiences. In the end, 3,500 people responded to the survey for which they were paid 75 cents each.
Survey data obtained from MTurk does not come by way of traditional random sampling methods. Survey responses are provided by interested Turkers who have already self-selected themselves into the Turker population and then accept the HIT within the Mechanical Turk online marketplace. Work requesters have the option to limit HIT access to Turkers based on obtuse geographical locations or to those who have certain demonstrated work quality ratings, but other than these options there is no stopping others from outside the target population from accepting HIT. Researchers can limit HIT access to Turkers identified by the researcher from previous HITs, but in this case the researcher has no way of knowing if nonrespondents to subsequent HITs are still active in the market or why the Turker did not respond to the subsequent HIT (Stritch, Pedersen, & Taggart, Citation2017). In either case, a calculation of a survey response rate in the traditional sense is not feasible.
Data quality
Some scholars have raised concerns about the quality of data obtained via MTurk (Goodman, Cryder, & Cheema, Citation2013). First, the fact that participants are being paid may hinder the quality of the data. Related to this, Turkers may quickly click through a survey, thereby reducing the reliability of the data and increasing the chance of false negatives (Button et al., Citation2013). Furthermore, respondents may retake the survey with a separate account, thus hampering independence of observations (Chandler, Mueller, & Paolacci, Citation2013; Horton, Rand, & Zeckhauser, Citation2011). Finally, there are concerns about the generalizability of MTurk samples related to the geographical dispersion and demographics of respondents. Fortunately, researchers can take measures to address these concerns, and studies have found that the quality of data collected through MTurk is similar to that of data obtained from other sources (Germine et al., Citation2012; Necka, Cacioppo, Norman, & Cacioppo, Citation2016). We will now outline how we address the concerns as outlined above.
Although participation incentives are common in large scale survey research, the fact that MTurkers get paid relatively small amounts for doing an individual HIT is a genuine concern. Yet, money does not appear to be the primary motive for HIT completion among Turkers, especially those located in the United States. Indeed, research shows that Turkers are generally intrinsically motivated and participate for other reasons, such as curiosity, a way to spend free time, or simply because they find the tasks enjoyable (Buhrmester, Kwang, & Gosling, Citation2011; Kaufmann, Schulze, & Veit, Citation2011). Since we focus on respondents who work full or part-time for organizations other than their work on MTurk, individuals in our sample are even more likely to complete HITs as a hobby rather than purely for money.
We use various approaches to address the other concerns about data quality, including removal of responses that came from outside the United States (to ensure a sample only from the United States; 1% removed); removal of responses from the same IP address (to guard against multiple responses from the same person and protect response independence; 2% removed); removal of respondents within the highest and lowest 1% of total time taking the survey (to protect against extreme time outliers; 2% removed);Footnote1 and removal of responses from individuals that failed to answer a specific quality check question correctly (to assess the respondents’ level of attention during the survey; 16% removed). The quality check question can be found in Appendix A.
These measures are in line with best practices using data obtained from MTurk for public administration research (see Jilke, van Ryzin, & van de Walle, Citation2016). After these cuts, 2,792 people remained in the dataset. For purposes of this study, we further limited the data to only those respondents who reported that they work for an organization either full- or part-time, which restricted the data to 1,254 respondents.
In terms of demographics, our MTurk survey respondents are generally younger, more educated, lower income, more female, and more white than the average U.S. adult when compared to the 2014 American Community Survey (ACS), which is in line with prior studies using MTurk data (Jilke, van Ryzin, & van de Walle Citation2016; Marvel, Citation2015, Citation2016; Paolacci & Chandler, Citation2014; Paolacci, Chandler, & Ipeirotis, Citation2010; Ross, Irani, Silberman, Zaldivar, & Tomlinson, Citation2010). Respondents are spread out evenly across the four major census regions in roughly the same proportion as the U.S. population in the 2014 ACS, suggesting very low bias across U.S. regions in our data. As a robustness check for the generalizability of our MTurk sample, we also weighted the data to account for differences to the general U.S. adult population in terms of race/ethnicity, gender, age, and household income. Including these weights in our analyses does not materially affect our findings (results from this robustness check are available upon request).
Measures
Our first dependent variable is general red tape derived from the general red tape (GRT) scale (Kaufmann & Feeney, Citation2014; Rainey, Pandey, & Bozeman, Citation1995), which asks respondents to indicate the overall level of red tape in their organization on a scale of 0–10. Although a number of alternative red tape measures have been developed recently (Borry, Citation2016; van Loon, Leisink, Knies, & Brewer, Citation2016), these measures have not been retested empirically. As a result, the GRT scale is still the most salient red tape measure to date.
The second dependent variable is red tape–related client complaints. Using the same red tape definition, this variable is measured by asking respondents to indicate on a scale of 0 (completely disagree) to 10 (completely agree) their level of agreement with the following statement: “Red tape plays part in citizen/client complaints.”
Our third dependent variable is red tape–related client service ability. This variable is measured by first providing respondents with the following benchmark definition of red tape: “burdensome administrative rules and procedures that have negative effects on the organization’s effectiveness” (Rainey, Pandey, & Bozeman Citation1995, p. 574). Next, we wanted to know how red tape inside the organization affects client service by asking respondents to indicate their level of agreement with the following statement on a scale of 0 (completely disagree) to 10 (completely agree): “Red tape affects your organization’s ability to serve citizens/clients.” Although we expect that red tape will negatively affect the organization’s ability to serve clients, it is quite possible that red tape’s effects pertain to thresholds (i.e., at low levels there may be little perceived effect on outcomes). The variable allows us to determine if negative impacts of red tape are stronger for higher levels of administrative delay.
Our independent variable is administrative delay, measured as the standardized average of eight items that capture delays in core organizational tasks. Respondents were asked to report how many weeks their organization took to perform core administrative tasks, namely hiring a full-time new employee, firing a full-time employee, buying low-cost equipment, buying high-cost equipment, reorganizing a department or unit, starting a minor project, starting a major project, and contracting out a project.
To compute the standardized average administrative delay variable, we first standardized the time in weeks for each task into a z-score for each respondent. This z-score was calculated as the reported time in weeks less the sample mean for that particular task, divided by the standard deviation of the sample for that task. We then computed the arithmetic mean of the eight z-scores corresponding to the eight organizational tasks reported by each respondent. However, if a respondent only reported times for, say, five of the organizational tasks, then their average was only based on those five tasks. Thus, this variable measures the extent to which the employee’s organization deviates from a standardized scale on the organizational tasks for which that employee has knowledge. With this method we were able to calculate an administrative delay for 1,110 of the respondents, slightly limiting the dataset from 1,254 respondents. Since only 498 respondents provided estimates for all eight organizational tasks, this suggests to us that respondents only provided time estimates for organizational tasks for which they knew the answer and left others blank when they did not. Summary statistics for the administrative delay measure are shown in .
Table 1. Summary statistics for the eight organizational activities comprising administrative delay.
As illustrates, the three organizational activities for which the most respondents recognized administrative delay were: starting a minor project (978 respondents with a mean of 9.2 weeks), starting a major project (922 respondents with a mean of 20 weeks), and hiring a full-time employee (903 respondents with a mean of 11.9 weeks)—suggesting that most respondents are aware of how long it takes to start projects and hire new employees. The three organizational activities for which the least number of respondents recognized administrative delay were: contracting out a project (646 respondents with a mean of 27.6 weeks), firing a full-time employee (770 respondents with a mean of 12.7 weeks), and buying high-cost equipment (776 respondents with a mean of 23.1 weeks) – suggesting that the time it takes to complete these administrative tasks is less well known among organizational employees.
Given that activities such as contracting and buying high-cost equipment generally fall upon employees higher up within the organizational hierarchy, it follows that the time it takes to start these activities is among the least well known among the respondents. As another testament to the quality of the data, activities that we would expect to take longer than others did, according to our administrative delay data. That is, buying high-cost equipment takes more time than buying low-cost equipment (23.1 weeks vs. 10.1 weeks) and starting a major project takes more time than starting a minor project (20.0 weeks vs 9.2 weeks). As would be expected with a variable bounded at zero, the delay variables all skew to the right.
An argument can also be made for the use of a factor variable as the composite measure for administrative delay. Factor analysis on the 498 responses with time estimates for each of the eight tasks indicates that all eight activities factor into one variable, effectively bolstering the argument for the use of any composite variable in the final analysis (for summary statistics and results of the factor analysis on the eight organizational activities see Appendix B). However, we decided that the approach outlined above is more appropriate than a factor analysis given the fact that more than half of the respondents did not provide time estimates for all organizational tasks.
In conclusion, the standardized average administrative delay variable measures the extent to which each respondent’s organization deviates from the average standardized time taken to complete core organizational tasks, while maintaining as many respondents in the dataset as possible.
A number of individual variables are included to control for potential covariates of red tape perceptions (Kaufmann & Feeney, Citation2012, Citation2014; Scott & Pandey, Citation2000). Age and job tenure are measured as continuous variables, whereas gender is included as a dummy variable (0 = male, 1 = female). Furthermore, position in the organizational hierarchy is operationalized by asking respondents to mark on a pyramid with six levels where their job position would fit, with the top of the pyramid being the lead executive and the bottom of the pyramid being the lowest level of the organization. We control for job descriptions and organizational characteristics through a number of dummy variables. The various job descriptions include management, information technology, professional, administrative support, sales, and other. Organizational size (measured categorically as number of employees) also included as a control.
A final control that is particularly relevant given previous research on red tape is organizational sector. While we believe that the relationships between administrative delay and client red tape hold in all organizational settings, existing research has found that both general red tape levels and administrative delay are higher for public than private organizations. For example, Feeney and Bozeman (Citation2009) compare perceived red tape between public managers working at the Georgia Department of Transportation and private consultants that have worked with this department. The authors find that the level of organizational red tape is perceived to be significantly higher in the public agency. Similarly, delays related to performing core organizational tasks have been found to be more pronounced in public than private organizations (Bozeman, Reed, & Scott, Citation1992; Rainey, Pandey, & Bozeman, Citation1995). As such, we include organizational dummies for the for-profit business, faith based nonprofit, other nonprofit, local government, state government, federal government, and other sectors to control for any sectoral differences in red tape client service and red tape complaints. presents summary statistics for all variables included in the analysis.
Table 2. Summary statistics.
Analysis
present ordinary least squares regressions that test for the effect of administrative delay on the three dependent variables.
Table 3. Prediction of general red tape.
Table 4. Predicting red tape–related client complaints.
Table 5. Predicting red tape–related service ability.
The analysis for the three dependent variables proceeds uniformly. We first test the effect of our control variables on the dependent variables (Models 1, 3, and 5), and then add our independent variable (administrative delay) in the full model specification (Models 2, 4, and 6).
Results
The regression results confirm all three of our hypotheses. Since the results of our control variables–only specifications are consistent with the full model specifications, we focus our discussion on the latter models. First, Model 2 provides support for our first hypothesis, which states that administrative delay is associated with red tape. Model 2 shows that as the standardized mean administrative delay increases by one (a 1.37 standard deviation increase), the general red tape scale increases by 0.86 (a 0.30 standard deviation increase). The relationship is positive and highly significant (p < 0.01). Adding administrative delay to our model increases the R2 from 0.18 to 0.23.
Next, Model 4 provides support for our second hypothesis, which states that administrative delay plays part in red tape–related complaints. Model 2 shows that as the standardized mean administrative delay increases by one (a 1.37 standard deviation increase), red tape–related client complaints increase by 0.84 (a 0.29 standard deviation increase). The relationship between administrative delay and our measure of red tape complaints is positive and highly significant (p < 0.01). The R2 for the full model specification is 0.19, as opposed to 0.14 for the controls only model.
Finally, the Model 6 results show the expected positive relationship between administrative delay and the red tape–related service ability. Model 6 shows that as the standardized mean administrative delay increases by one (a 1.37 standard deviation increase), red tape–related service ability increases by 0.88 (a 0.30 standard deviation increase). This relationship is highly significant (p < 0.01), thus confirming our third hypothesis. Adding administrative delay to our model increases the R2 by 5%, from 0.14 to 0.19. Taken together, these findings suggest that administrative delay has substantial effect on red tape and the red tape–related performance indicators unique to this article, namely client complaints and service ability.
Except for number of hours worked, none of our individual level control variables are significant, which is often the case in red tape studies. Furthermore, organizational size is highly significant in our models, indicating that smaller organizations are troubled less by the negative effects of administrative delay. Again, this finding is in line with our expectations. We also find that, in general, employees in positions lower on the organizational hierarchy perceive more client red tape as opposed to individuals working at the top of the organizational pyramid (Walker & Brewer, Citation2008). This finding can be attributed to the fact that top managers are more isolated from client complaints than employees lower down in the hierarchy (e.g., street-level bureaucrats and front-desk workers will receive more client complaints than mayors or CEOs).
Finally, employees working in the public sector perceive red tape to affect the organization’s ability to serve clients more strongly than do private sector employees. Furthermore, public sector employees perceive more red tape complaints from clients than do their private counterparts. These findings regarding client red tape are in line with prior research that has shown that both administrative delay and organizational red tape levels are higher in public agencies (Bozeman, Reed, & Scott, Citation1992; Feeney & Bozeman, Citation2009; Rainey, Pandey, & Bozeman, Citation1995).
Conclusion
Building on earlier red tape research, we return to the notion of administrative delay as a predictor of red tape. Specifically, we are interested in understanding how the effectiveness with which an organization is able to perform core organizational tasks, such as hiring and firing personnel, is associated with red tape, complaints from clients to the organization about red tape, and the organization’s ability to serve their clients as a result of red tape. We test our reasoning using data from the National Administrative Studies Project Citizen (NASP-C) gathered on Amazon Mechanical Turk (MTurk) in late 2014. Linear regression analysis confirms all three of our hypotheses. That is, administrative delay leads to more red tape, greater client complaints about red tape, and negatively affects the organizations’ ability to serve clients. These results remain statistically significant after controlling for a large number of individual and organization level factors.
While previous studies have looked at the negative relationship between red tape and organizational performance in general, our findings show that administrative delay is a salient factor that may underlay this relationship. That is, organizations may perform better if administrative delays are reduced. Our study also provides support for the notion that administrative delay and red tape are (largely) perceptual in nature. This means that the time required for completing organizational tasks is not necessarily a delay in the “objective” sense of the word, much like a particular rule or procedure may be considered red tape by some stakeholders, but not others.
Generally speaking, perceptions of administrative delay and red tape may be caused by very different factors. Some of these factors may be administrative in nature (e.g., the number of days required to complete an organizational task), while others may be subjective (e.g., an individual’s bureaucratic personality). When viewed in connection to organizational performance, performance may be improved by streamlining unnecessarily lengthy and time-consuming procedures in some cases, while in other cases clarification of such procedures may be a more effective approach. This line of reasoning reiterates the necessity for future research to carefully disentangle the objective and perceptual components of administrative delay and red tape.
For practitioners, our findings imply a need to critically evaluate the time to completion for core organizational tasks. In this light, managers may benefit from the development of specific benchmarks that capture both the mean and range of administrative delay for different tasks. Such benchmarks can be created for different departments within organizations, or across organizational domains. While organizational contexts can differ markedly, benchmarking can shed light on which (decision-making) processes entail above average delays and may need to be streamlined.
The current study also entails a number of limitations. First, we are well aware that our measure of delay is a rather crude one that does not distinguish between different (types of) organizations. Nor does it necessarily correspond to objective measures of time required, as mentioned above. It should be possible, however, to provide a more informed notion of delay by anchoring the concept against norms for a function across organizations and, indeed, this approach was taken in an early red tape study (Bretschneider & Bozeman, Citation1995). However, relational constructs of delay, while superior, require data we do not have at present.
Like most previous studies of red tape, our research employs cross-sectional survey data, which raises concerns about common source bias. The fact that our independent and dependent variables are all taken from the same survey implies that measurement errors may be correlated and the correlations upwardly biased (Favero & Bullock, Citation2014). However, given that the dependent variables of interest are by nature perceptual measures and that the independent variable of interest—administrative delay—is a socially constructed individual judgment, the use of a survey is an appropriate measurement method (George & Pandey, Citation2017; Podsakoff, MacKenzie, & Podsakoff, Citation2012). While an outside measure of administrative delay might have aided with common source bias, an objective measure of the time taken to start administrative tasks would not measure the socially constructed and perceptual nature of delay—an important component of administrative delay, which we discussed previously. Furthermore, concretely distinct data sources can result in downward biased correlations, as opposed to the upward biased correlations that can occur when using common sources (George & Pandey, Citation2017; Kammeyer-Mueller, Steel, & Rubenstein, Citation2010).
We also note the limitations of using an employee centric measure to capture client red tape complaints. This measure is useful for gauging to what extent employees feel that red tape is a salient topic for clients, but it would be worthwhile to develop an alternative client red tape measure derived directly from clients, rather than indirectly through employees. Other specific issues with endogeneity plague this research, namely, reverse causality and omitted variable bias. We acknowledge the strong possibility that perceptions of red tape would affect perceptions of administrative timing in the reverse order that we present here in this article. Indeed, further research would do well to parse out the temporal differences in which one perceives administrative delay and red tape. However, we also understand and argue that administrative delay may be attributed to differences in norms and informal behavior, to uncontrollable events (Bozeman & Feeney, Citation2011), to organizational centralization, or a lack of resources. Not all of these factors are red tape. We did our best to account for these and other potentially confounding variables with our inclusion of hierarchical position, organization size, job role, subsector, part-time status, hours worked, gender, and age as control variables. At the same time, we acknowledge that omitted variables such as workplace norms, informal behaviors, and others are potentially biasing our results and that future work would do well to take these variables into account.
Finally, using crowd-sourced data from Amazon MTurk has both its advantages and disadvantages. Among the disadvantages is the fact that Amazon MTurk respondents have characteristics known to be somewhat different from the general population (e.g., younger, more computer literate). However, these are known properties that can be accounted for and, moreover, are perhaps no more pernicious than the nonresponse bias accruing from most surveys, especially online surveys. An advantage of Amazon MTurk and crowd sourcing in general is that it is a “velvet glove” approach to research. Rather than appealing to often heavily burdened potential respondents to provide, usually for free, responses to yet another survey, the reliance on individuals paid for their task, ones who are likely less burdened by the ever-growing volume of unsolicited surveys, provides the advantage of matching the interests and motivations of researcher and researched.
Despite the several limitations of our approach, our findings have potentially important implications for future research on organizational rules and rule effectiveness. The next step is to identify the specific causes of these internal delays and understand how these can be minimized. Are delays the result of procedural safeguards, such as accountability and transparency, are they caused by unnecessarily burdensome paperwork, or by other organizational factors? By and large, these are the same themes that red tape scholars have struggled with for decades but anchoring these issues in the study of administrative delay may provide some much needed specificity to existing red tape research.
Additional information
Notes on contributors
Wesley Kaufmann
Wesley Kaufmann is an Associate Professor at Tilburg Institute of Governance, Tilburg University, The Netherlands.
Gabel Taggart
Gabel Taggart is an Assistant Professor of Public Administration at the University of Wyoming.
Barry Bozeman
Barry Bozeman is Regents’ Professor and Arizona Centennial Professor of Technology Policy and Public Management at Arizona State University.
Notes
1 For each respondent the total time to completion is automatically reported in the Qualtrics dataset. These completion times were sorted and the outliers removed. Also see Jilke, van Ryzin, & van de Walle (Citation2016).
References
- Alford, J. (2002). Defining the client in the public sector: a social-exchange perspective. Public Administration Review, 62(3), 337–346.
- Arceneaux, K. (2012). Cognitive biases and the strength of political arguments. American Journal of Political Science, 56(2), 271–285.
- Balla, S. J. (1998). Administrative procedures and political control of the bureaucracy. American Political Science Review, 92(3): 663–673.
- Berinsky, A. J., Huber, G. A., & Lenz, G. S. (2012). Evaluating online labor markets for experimental research: Amazon.com’s Mechanical Turk. Political Analysis, 20(3), 351–368.
- Borry, E. L. (2016). A new measure of red tape: Introducing the three-item red tape (TIRT) scale. International Public Management Journal, 19(4), 573–593.
- Bozeman, B. (1993). A theory of government “red tape”. Journal of Public Administration Research and Theory, 3(3), 273–304.
- Bozeman, B. (2012). Multidimensional red tape: A theory coda. International Public Management Journal, 15(3), 245–265.
- Bozeman, B., & Bretschneider, S. (1994). The “publicness puzzle” in organization theory: A test of alternative explanations of differences between public and private organizations. Journal of Public Administration Research and Theory, 4(2), 197–223.
- Bozeman, B., & Kingsley, G. (1998). Risk culture in public and private organizations. Public Administration Review, 58(2), 109–118.
- Bozeman, B., & Feeney, M. K. (2011). Rules and red tape: A prism for public administration theory and research, Armonk, NY: M.E. Sharpe.
- Bozeman, B., Reed, P. N., & Scott, P. (1992). Red tape and task delays in public and private organizations. Administration & Society, 24(3), 290–322.
- Bozeman, B., & Scott, P. (1996). Bureaucratic red tape and formalization: Untangling conceptual knots. The American Review of Public Administration, 26(1), 1–17.
- Bretschneider, S. (1990). Management information systems in public and private organizations: An empirical test. Public Administration Review, 50(5), 536–545.
- Bretschneider, S., & Bozeman, B. (1995). Understanding red tape and bureaucratic delays. In A. Halachmi and G. Bouckaert (eds.) The enduring challenges of public management. San Francisco, CA: Jossey-Bass, 326–337.
- Brewer, G. A., & Walker, R. M. (2010). The impact of red tape on governmental performance: An empirical analysis. Journal of Public Administration Research and Theory, 20(1), 233–257.
- Brewer, G. A., Walker, R. M., Bozeman, B., Avellaneda, C. N., & Brewer Jr., G. A. (2012). External control and red tape: The mediating effects of client and organizational feedback. International Public Management Journal, 15(3), 288–314.
- Buhrmester, M., Kwang, T., & Gosling, S. D. (2011). Amazon’s Mechanical Turk: A new source of inexpensive, yet high-quality, data? Perspectives on Psychological Science, 6(1), 3–5.
- Burden, B. C., Canon, D. T., Mayer, K. R., & Moynihan, D. P. (2012). The effect of administrative burden on bureaucratic perception of policies: Evidence from election administration. Public Administration Review, 72(5), 741–751.
- Button, K. S., Ioannidis, J. P. A., Mokrysz, C, Nosek, B. A., Flint, J., Robinson, E. S. J., & Munafò, M. R. (2013). Power failure: Why small sample size undermines the reliability of neuroscience. Nature Reviews Neuroscience, 14(5), 365–376.
- Chandler, J., Mueller, P., & Paolacci, G. (2013). Nonnaïveté among Amazon Mechanical Turk workers: Consequences and solutions for behavioral researchers. Behavior Research Methods, 46(1), 112–130.
- Cheung, J. H., Burns, D. K., Sinclair, R., & Sliter, M. (2017). Amazon Mechanical Turk in organizational psychology: An evaluation and practical recommendations. Journal of Business and Psychology, 32(4), 347–361.
- Conner-Spady, B. L., Sanmartin, C., Johnston, G. H., McGurran, J. J., Kehler, M., & Noseworthy, T. W. (2011). The importance of patient expectations as a determinant of satisfaction with waiting times for hip and knee replacement surgery. Health Policy, 101(3), 245–252.
- Cramton, R. C. (1972). Causes and cures of administrative delay. American Bar Association Journal, 58(9), 937–941.
- Davis, R. S., & Pink-Harper, S. A. (2016). Connecting knowledge of rule-breaking and perceived red tape: How behavioral attribution influences red tape perceptions. Public Performance & Management Review, 40(1), 181–200.
- DeHart-Davis, L., & Bozeman, B. (2001). Regulatory compliance and air quality permitting: Why do firms overcomply? Journal of Public Administration Research and Theory, 11(4), 471–508.
- DeHart-Davis, L., & Pandey, S. K. (2005). Red tape and public employees: Does perceived rule dysfunction alienate managers? Journal of Public Administration Research and Theory, 15(1), 133–148.
- Dowling, C. M., & Wichowsky, A. (2015). Attacks without consequence? Candidates, parties, groups, and the changing face of negative advertising. American Journal of Political Science, 59(1), 19–36.
- Dressel, P. L. (1982). Policy sources of worker dissatisfactions: The case of human services in aging. The Social Service Review, 56(3), 406–423.
- Eriksson, K., & Simpson, B. (2011). Perceptions of unfairness in allocations between multiple recipients. Cognitive Psychology, 62(3), 225–244.
- Farber, D. A. (1992). Politics and procedure in environmental law. Journal of Law, Economics, & Organization, 8(1), 59–81.
- Favero, N., & Bullock, J. B. (2014). How (not) to solve the problem: An evaluation of scholarly responses to common source bias. Journal of Public Administration Research and Theory, 25(1), 285–308.
- Feeney, M. K. (2012). Organizational red tape: A measurement experiment. Journal of Public Administration Research and Theory, 22(3), 427–444.
- Feeney, M. K., & Bozeman, B. (2009). Stakeholder red tape: Comparing perceptions of public managers and their private consultants. Public Administration Review, 69(4), 710–726.
- Fishbach, A., Henderson, M. D., & Koo, M. (2011). Pursuing goals with others: Group identification and motivation resulting from things done versus things left undone. Journal of Experimental Psychology: General, 140(3), 520–534.
- Franco, L. M., Bennett, S., & Kanfer, R. (2002). Health sector reform and public sector health worker motivation: A conceptual framework. Social Science & Medicine, 54(1), 1255–1266.
- George, B., & Pandey, S. K. (2017). We know the yin - but where is the yang? Toward a balanced approach on common source bias in public administration scholarship. Review of Public Personnel Administration, 37(2), 245–270.
- Germine, L., Nakayama, K., Duchaine, B. C., Chabris, C. F., Chatterjee, G., & Wilmer, J. B. (2012). Is the web as good as the lab? Comparable performance from web and lab in cognitive/perceptual experiments. Psychonomic Bulletin & Review, 19(5), 847–857.
- Goodman, J. K., Cryder, C. E., & Cheema, A. (2013). Data collection in a flat world: The strengths and weaknesses of Mechanical Turk samples. Journal of Behavioral Decision Making, 26(3), 213–224.
- Healy, A., & Lenz, G. S. (2014). Substituting the end for the whole: Why voters respond primarily to the election‐year economy. American Journal of Political Science, 58(1), 31–47.
- Horton, J. J., Rand, D. G., & Zeckhauser, R. J. (2011). The online laboratory: Conducting experiments in a real labor market. Experimental Economics, 14(3), 399–425.
- Hoy, W. K., Blazovsky, R., & Newland, W. (1983). Bureaucracy and alienation: A comparative analysis. Journal of Educational Administration, 21(2), 109–120.
- Jacobsen, C. B., & Jakobsen, M. L. (2018). Perceived organizational red tape and organizational performance in public services. Public Administration Review, 78(1), 24–36.
- Jilke, S., van Ryzin, G. G., & van de Walle, S. (2016). Responses to decline in marketized public services: An experimental evaluation of choice overload. Journal of Public Administration Research and Theory, 26(3), 421–432.
- Kammeyer-Mueller, J., Steel, P. D., & Rubenstein, A. (2010). The other side of method bias: The perils of distinct source research designs. Multivariate Behavioral Research, 45(2), 294–321.
- Kaufmann, N., Schulze, T. & Veit, D. (2011). More than fun and money. Worker motivation in crowdsourcing - A study on Mechanical Turk. Paper presented at the Americas Conference on Information Systems, Detroit, Michigan, August 4-7, 1–11.
- Kaufmann, W., & Feeney, M. K. (2012). Objective formalization, perceived formalization, and perceived red tape. Public Management Review, 14(8), 1195–1214.
- Kaufmann, W., & Feeney, M. K. (2014). Beyond the rules: The effect of outcome favourability on red tape perceptions. Public Administration, 92(1), 178–191.
- Kaufmann W., & Tummers, L. G. (2017). The negative effect of red tape on procedural satisfaction. Public Management Review, 19(9), 1311–1327.
- Kittur, A., Chi, E. H., & Suh, B. (2008). Crowdsourcing user studies with Mechanical Turk. In Proceedings of the SIGCHI Conference on Human Factors in Computing Systems (pp. 453–456). New York, NY: ACM.
- Kroll, A. (2015). Exploring the link between performance information use and organizational performance: A contingency approach. Public Performance & Management Review, 39(1), 7–32.
- Kumar, P., Kalwani, M. U., & Dada, M. (1997). The impact of waiting time guarantees on customers’ waiting experiences. Marketing Science, 16(4), 295–314.
- Little, G., Chilton, L. B., Goldman, M., & Miller, R. C. (2009). Turkit: Tools for iterative tasks on Mechanical Turk. Presented at the Proceedings of the ACM SIGKDD workshop on human computation, ACM, 29-30.
- Macey, J. R. (1992). Organizational design and political control of administrative agencies. Journal of Law, Economics, & Organization, 8(1), 93–110.
- Manolitzas, P., & Yannacopoulos, D. (2013). Citizen satisfaction: A multicriteria satisfaction analysis. International Journal of Public Administration, 36(9), 614–621.
- Marvel, J. D. (2014). The Boston marathon bombings: Who’s to blame and why it matters for public administration. Public Administration Review, 74(6), 713–725.
- Marvel, J. D. (2015). Public opinion and public sector performance: Are individuals’ beliefs about performance evidence-based or the product of anti-public sector bias? International Public Management Journal, 18(2), 209–227.
- Marvel, J. D. (2016). Unconscious bias in citizens’ evaluations of public sector performance. Journal of Public Administration Research and Theory, 26(1), 143–158.
- Mausolff, C. (2004). Learning from feedback in performance measurement systems. Public Performance & Management Review, 28(1), 9–29.
- Mortensen, K., & Hughes, T. L. (2018). Comparing Amazon’s Mechanical Turk platform to conventional data collection methods in the health and medical research literature. Journal of General Internal Medicine, 33(4), 533–538.
- Moynihan, D. P., Wright, B. E., & Pandey, S. K. (2012). Working within constraints: Can transformational leaders alter the experience of red tape? International Public Management Journal, 15(3), 315–336.
- Moynihan, D. P., Herd, P., & Harvey, H. (2015). Administrative burden: Learning, psychological, and compliance costs in citizen-state interactions. Journal of Public Administration Research and Theory, 25(1), 43–69.
- Mugion, R. G., & Musella, F. (2013). Customer satisfaction and statistical techniques for the implementation of benchmarking in the public sector. Total Quality Management & Business Excellence, 24(5-6), 619–640.
- Necka, E. A., Cacioppo, S., Norman, G. J., & Cacioppo, J. T. (2016). Measuring the prevalence of problematic behaviors among MTurk, campus, and community participants. PloS ONE, 11(6), 1–19.
- Novotney, S., & Callison-Burch, C. (2010). Cheap, fast and good enough: Automatic speech recognition with non-expert transcription. Presented at the Human Language Technologies: The 2010 Annual Conference of the North American Chapter of the Association for Computational Linguistics, Association for Computational Linguistics, 207-215.
- O’Keeffe, L. H. (1985). Administrative law judges, performance evaluation, and production standards: Judicial independence versus employee accountability. George Washington Law Review, 54(4), 591–597.
- Pandey, S. K., & Bretschneider, S. (1997). The impact of red tape’s administrative delay on public organizations’ interest in new information technologies. Journal of Public Administration Research and Theory, 7(1), 113–130.
- Pandey, S. K., Coursey, D. H., & Moynihan, D. P. (2007). Organizational effectiveness and bureaucratic red tape: A multimethod study. Public Performance and Management Review, 30(3), 398–425.
- Pandey, S. K., & Kingsley, G. A. (2000). Examining red tape in public and private organizations: Alternative explanations from a social psychological model. Journal of Public Administration Research and Theory, 10(4), 779–799.
- Pandey, S. K., & Moynihan, D. P. (2006). Bureaucratic red tape and organizational performance: Testing the moderating role of culture and political support. In G A. Boyne, K. J. Meier, L. J. O’Toole Jr., and R. M. Walker (Eds.), Public service performance (pp. 130–151). Cambridge, UK: Cambridge University Press.
- Pandey, S.K., Pandey, S., & van Ryzin, G. G. (2017). Prospects for experimental approaches to research on bureaucratic red tape. In O. James, S. Jilke, and G. G. van Ryzin (Eds.), Experiments in Public Management Research (pp. 219–243). Cambridge, UK: Cambridge University Press.
- Pandey, S. K., & Welch, E. W. (2005). Beyond stereotypes: A multistage model of managerial perceptions of red tape. Administration & Society, 37(5), 542–575.
- Paolacci, G., & Chandler, J. (2014). Inside the Turk: Understanding Mechanical Turk as a participant pool. Current Directions in Psychological Science, 23(3), 184–188.
- Paolacci, G., Chandler, J., & Ipeirotis, P. G. (2010). Running experiments on Amazon Mechanical Turk. Judgment and Decision Making, 5(5), 411–419.
- Podsakoff, P. M., MacKenzie, S. B., & Podsakoff, N. P. (2012). Sources of method bias in social science research and recommendations on how to control it. Annual Review of Psychology, 63(1), 539–569.
- Rainey, H. G., Pandey, S. K., & Bozeman, B. (1995). Research note: Public and private managers’ perceptions of red tape. Public Administration Review, 55(6), 567–574.
- Ross, J., Irani, L., Silberman, M. S., Zaldivar, A., & Tomlinson, B. (2010). Who are the crowdworkers? Shifting demographics in Mechanical Turk. In Proceedings of CHI 2010, Atlanta GA, ACM, 2863-2872.
- Scott, P. G., & Pandey, S. K. (2000). The influence of red tape on bureaucratic behavior: An experimental simulation. Journal of Policy Analysis and Management, 19(4), 615–633.
- Scott, P. G., & Pandey, S. K. (2005). Red tape and public service motivation: Findings from a national survey of managers in state health and human services agencies. Review of Public Personnel Administration, 25(2), 155–180.
- Stritch, J. M., Pedersen, M., & Taggart, G. (2017). The opportunities and limitations of using Amazon’s Mechanical Turk to advance public management scholarship. International Public Management Journal, 20(3), 489–511.
- Tom, G., & Lucey, S. (1995). Waiting time delays and customer satisfaction in supermarkets. Journal of Services Marketing, 9(5), 20–29.
- Yang, K., & Pandey, S. K. (2007). Public responsiveness of government organizations: Testing a preliminary model. Public Performance & Management Review, 31(2), 215–240.
- Van Loon, N. M., Leisink, P. L. M., Knies, E., & Brewer, G. A. (2016). Red tape: Developing and validating a new job-centered measure. Public Administration Review, 76(4), 662–673.
- Van Thiel, S., & Leeuw, F. L. (2002). The performance paradox in the public sector. Public Performance & Management Review, 25(3), 267–281.
- Vigoda, E. (2002). Administrative agents of democracy? A structural equation modeling of the relationship between public-sector performance and citizenship involvement. Journal of Public Administration Research and Theory, 12(2), 241–272.
- Walker, R. M., & Brewer, G. A. (2008). An organizational echelon analysis of the determinants of red tape in public organizations. Public Administration Review, 68(6), 1112–1127.
- Wen, B., & Chi, C. G.-Q. (2013). Examine the cognitive and affective antecedents to service recovery satisfaction: A field study of delayed airline passengers. International Journal of Contemporary Hospitality Management, 25(3), 306–327.
Appendix A: Attention check question from nasp-citizen survey
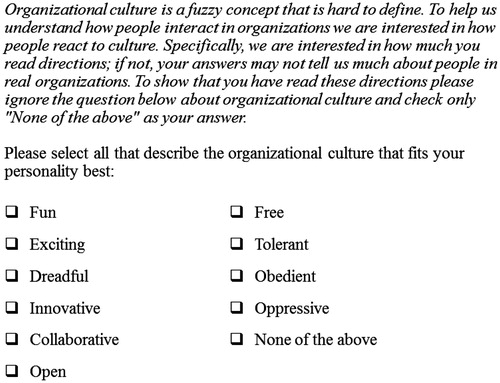
Note: Respondents who did not mark “None of the above” as their answer were marked as inattentive and excluded from the analysis.
Appendix B: Supplemental measurement for administrative delayExploratory Factor Analysis of the Eight Organizational Activities
Exploratory factor analysis on the 498 respondents who provided responses for each task allowed the factors to be freely estimated without estimating the number of factors a priori, which retained four factors. Factor 1 had an eigenvalue of 4.1, and Factors 2–4 had eigenvalues of less than 0.4. Testing for reliability yielded a Cronbach’s α of 0.89.