
ABSTRACT
Regulatory T cells (Tregs) are a small population of CD4+ lymphocytes and play a key role as suppressors of the immune system, a role that can be identified by employing a co-culture suppression assay. Conventional protocol requires a long period of in vitro expansion of Treg numbers; hence, this study describes an establishment of a co-culture suppression assay using a short-term expansion of peripheral blood (PB) Tregs and autologous T cells (Tconvs) IL-2-pre-cultured in parallel for the same length of time, thereby obviating the need of freeze/thawed autologous Tconvs. Tregs and Tconvs were isolated from PB mononuclear cells employing magnetic bead-aided depletion of CD8+ cells followed by cell sorting of CD4+ CD25high+CD127low- (Treg) and CD4+ CD25-CD127+ (Tconv) cell populations. Following a 3-day co-cultivation period under optimized conditions, Treg suppression activity was monitored by comparing using flow cytometry the number of carboxyfluorescein succinimidyl ester-labeled Tconvs to that of Treg-minus control. The assay allowed significant differentiation between Treg suppression activity of patients with active rheumatoid arthritis and those in remission. This method should be more convenient and time-saving than the conventional Treg suppression assay in current use.
Introduction
Regulatory T cell (Treg), a CD4+ CD25high+ CD127low-, is an immune regulator, belonging to a small sub proportion of CD4+ T lymphocytes. Treg expresses intracellular forkhead box P3 transcription factor (Foxp3), a major of regulator of Treg immune suppression function that involves secretion of inhibitory cytokines, such as transforming growth factor beta (TGF-β) and interleukin-10 (IL-10), expression of inhibitory molecules, high-level expression of (interleukin 2) IL-2 receptor, induction of effector cell apoptosis, and inhibition of maturation of antigen-presenting cell (APC) and subsequent antigen presentation.[Citation1]
Studies of Treg functions are performed employing different principles and methods. The standard technique employs flow cytometry, which requires antibodies to specific cell surface antigens and intracellular proteins. Intracellular Foxp3 is used for Treg identification, which can be further delineated by co-staining for cell surface markers, such as CD3, CD4, CD25, CD45RA, CD45RO, and CD127.[Citation2–Citation5] However, the numbers of peripheral blood (PB) Tregs reported depend on the markers used to identify Tregs. More importantly, the variety of types identified may not be sufficient to explore the immune status arising from T cell plasticity, which routinely is manifested in chronic inflammatory, allergic and autoimmune diseases, including cancer.[Citation6–Citation9]
Treg functional study provides a way to explore the immune status, which involves a co-culture suppression assay to evaluate Treg suppression status of a subject.[Citation10,Citation11] However, the amount of Treg in PB of healthy humans constitutes a small fraction (2–5% of CD4+ T cells) required for co-culture experiments, especially in patients with autoimmune and allergic diseases, conditions in which Treg numbers are decreased or normal but with impaired function.[Citation12–Citation14] Consequently, expansion of Treg numbers is required employing both in vitro and ex vivo methods. The majority of protocols require a long-term period to allow Treg expansion, an average of 14–21 days to increase Treg numbers 10–20 folds.[Citation10,Citation15–Citation17] This long period of cell culture results in the requirement for sub-culture or replacement of culture medium, increasing the risk of microbial contamination.[Citation18]
A co-culture suppression assay using a small number (5x10³) of freshly isolated Tregs was established for solid tumors studies, in which Treg expansions are not required as sufficient numbers of Treg can be isolated from tumor-infiltrating lymphocytes.[Citation19] PB Tregs have been used in suppression assays, involving isolated IL-17-producing Tregs from rheumatoid arthritis patients.[Citation20] However, this new method still requires long-term expansion of Tregs.[Citation21] In conditions such as active rheumatoid arthritis (RA) patients have very small numbers of PB Tregs, making it more difficult to isolate sufficient cells for functional studies without long-term expansion.[Citation22,Citation23]
This study describes the establishment of a co-culture suppression assay employing short-term expansion (4 days) of PB Tregs and requiring no freeze/thaw of autologous conventional T cells (Tconvs). This assay was applied to PB Tregs from active and in-remission RA patients permitting statistically significant differences of Treg suppressive activity in co-culture assays between patients and normal controls. This method provides an alternative method to accelerate assays of PB Treg suppressive activity in conditions where these cells are present in limited amounts without recourse to long-term cell expansion protocols with their inherent drawbacks.
Materials and methods
Subjects
PB of healthy volunteers and RA patients, classified by ACR/EULAR 2010 or ACR 1987 criteria, was collected at Ramathibodi Hospital, Mahidol University, Bangkok, Thailand. Prior written informed consent was obtained from each participant. The study was approved to the Ethics Committee, Ramathibodi Hospital, reference number; 10–57-37. Inclusion criteria for definition of remission were: 1) the DAS28 score <2.6 or clinical remission (No pain symptom and neither swollen nor tender joint is detected; 2) clinical remission is sustained for at least 6 months. Inclusion criteria for active RA included: 1) the DAS28 score >2.6 or presence of clinical symptoms; and ESR > 50 mm/hr or CRP > 15 mg/L. Exclusion criteria for both states of RA were: patients with a history of infection for at least 2 weeks prior to the study, and patients with underlying diseases such as cancer and immune deficiency. Inclusion criteria for healthy volunteers were as followed: those who have white blood cell count within normal limit and no history of any underlying diseases and immunosuppressant drug use.
Materials and reagents
Fluorescence-activated cell sorting flow cytometer (FACS Aria III, Becton Dickinson, USA) was employed for cell sorting. Flow cytometer (FC500, Beckman Colter, USA) was used for CFSE proliferation determination. Incubator, centrifuge, vortex mixer, and automatic cell counter were from Thermo Fisher Scientific Inc., (USA). Slides were examined under an Olympus (Japan) microscope. CD8 T cell depletion kit was from X-Zell Biotec (Thailand) and recombinant human Intereukin-2 from ImmunoTools (Germany); 96-well plates, penicillin-streptomycin, phosphate-buffered saline pH 7.4 (PBS), hydroxyethyl piperazineethanesulfonic acid (HEPES), sodium pyruvate, 2-mercaptoethanol and 0.04% Trypan blue were from Sigma-Aldrich (USA), heparin and ethylenediaminetetraacetic acid (EDTA) vacutainer tube from Becton Dickinson (USA), glutamine-supplemented RPMI-1640 medium, CFSE proliferation kit, anti-human CD3/CD28 bead (cat 111.31D) and fetal bovine serum (FBS) from Life Technologies (USA); mouse anti-human CD4PE-Cy7 (cat.557852), CD8APC (cat.340584), CD25PE-Cy5 (cat.555750) and CD127PE (cat.557938) antibodies from Becton Dickinson (USA), and Rat anti-human Foxp3Alexafluor660 antibodies (ref.50477642), fixing/permeabilizing (fix/perm) solution and perm buffer from Affymetrix ebioscience (USA).
PB mononuclear cells (MCs) isolation and CD8+ cell depletion
Fresh heparinized whole blood samples (16 mL) from healthy volunteers (n = 10) and RA patients (n = 6) in vacutainer tube were centrifuged at 1700 g at 20°C for 20 min, washed twice with PBS, and re-centrifuged at 500 g for 5 min at 4ºC. PBMCs (10–15x106) in a sterile tube then were incubated with anti-CD8 antibodies for 5 min, washed with PBS, centrifuged at 450 g for 10 min at 4ºC, and incubated with nano-magnetic bead reagent (85 µL) for 10 min. Following addition with 1 mL aliquot of buffer solution, the cell suspension was transferred to a magnetic column and the flow-through solution containing CD8+-depleted PBMCs was centrifuged at 500 g for 10 min at 4ºC. Cells were suspended in 400 µl aliquot of culture medium (glutamine-enriched RPMI-1640 medium supplemented with 10% FBS, 1% penicillin/streptomycin, 1% HEPES buffer, 1% Sodium pyruvate, and 0.1% 2-mercaptoethanol) to sterile ficol tube.
Antibody staining and cell sorting
CD4+-enriched PBMCs (1x10⁶ in 100 µL of culture medium) were incubated with mouse anti-human CD4PE-Cy7, CD25PE-Cy5 and CD127PE antibodies for 10 min in the dark, washed twice with PBS and resuspend cell in PBS containing 10% culture medium. Then, cells were filtered through a sterile 70 µm sieve prior to cell sorting by FACS sorting. Gating strategy was initiated with droplet discrimination using a dot plot of FSC-H (Forward scatter-height) and FSC-A (Forward scatter-area), then target cells were gated by SSC-W (Side scatter-width) and SSC-H (Side scatter-height), followed by FSC-W (Forward scatter-width) and FSC-H. Target lymphocytes were gated by SSC-A (Side scatter-area) and FSC-H and CD4+ population by SSC-A and CD4. Treg is defined as CD4+ CD25high+ CD127low-, with CD127 gated from up to 10% of dim-positive CD127+ population and CD25 from cells having bright positive CD25 population.[Citation22,Citation24] Tconv is defined as CD4+ CD25- CD127+. Temperature of tube sorter was set at 4°C and cells were sorted using a 4-way purity mode at a frequency limited to 6,000 cells/s through the flow cell. Sorted cells were stored in collection medium (culture medium containing 50% FBS) at 4°C.[Citation25] Treg phenotype was confirmed by the presence of intracellular Foxp3 following both cell sorting and Treg expansion procedure. Tregs were incubated with 100 µL of fix/perm solution at ambient temperature for 45 min, followed by incubation with rat anti-human Foxp3 Alexafluor660 and isotype Alexafluor660 antibodies for 30 min at ambient temperature in the dark. Cells were washed twice with perm buffer, suspended in 300 µL of PBS and analyzed for Foxp3 expression by flow cytometer.
Optimization of Tconvs proliferation and co-culture conditions
Tconvs in a clear flat-bottom polystyrene 96-well plate (1x10⁴ cells/200 µL of culture medium well) were activated with bead-bound anti-human CD3/CD28 antibodies at a bead:cell ratios of 1:1–1:32 (two-fold serial dilution). Tregs and Tconvs were co-cultivated in culture medium supplemented with 100 (low dose), 500 (moderate dose) and 1,000 (high dose) International Units per milliliter (IU/mL) recombinant IL-2 at 37°C for 72 h under an atmosphere of 5% carbon dioxide (CO2).
Short-term Treg expansion protocol
Tregs in a 96-well plate, flat bottom polystyrene (1.0x10⁴ cells/well) were incubated with 200 µl of culture medium supplemented with 500 (IU/mL) IL-2 (optimal) and containing anti-human CD3/CD28 bead at a ratio of 3:1 bead:cell (optimal ratio) for four days 37°C under an atmosphere of 5% CO2. Then, the beads were removed using a magnetic column and any adhering cells were washed off with culture medium. Prior to co-cultivation with Tconv, viability of expanded Tregs was determined using a standard trypan blue assay and phenotype confirmed by the presence of intracellular FOXP3+ as described above.
IL-2-pre-cultured Tconv protocol and carboxyfluorescein succinimidyl ester (CFSE) staining
Cell-sorted Tconvs were centrifuged at 500 g for 5 min and suspended in 4 mL of culture medium. 0.5–1 × 10⁵ Tconvs/well were seeded in a flat-bottom 96-well plate in 200 µL of culture medium supplemented with 500 IU/mL IL-2 in total and incubated for 4 days at 37ºC under an atmosphere of 5% CO2, after which cells were washed RPMI-1640 medium without FBS. The pre-cultured Tconvs (0.5-1x10⁶ cells/mL in pre-warmed RPMI-1640 medium) were added to 1 mL of 10 µM CFSE solution and incubated at 37ºC for 10 min in the dark. Then, a stop solution of 200 µL of FBS was added and the cell suspension was incubated at ambient temperature for 10 min in the dark. Cells were washed three times with culture medium, centrifuged at 800 g for 5 min at 4ºC, re-suspended in culture medium, viability determined by trypan blue assay, and counted using an automated cell counter. In addition, Foxp3+ expression in pre-cultured Tconvs was performed to confirm their phenotype, which was not altering to positive Foxp3 population after the pre-cultured assay. Foxp3 determination protocol was described in a part of Treg phenotype confirmation.
Co-culture suppression assay
1 x 10⁴ pre-cultured Tconvs and short-term expanded Tregs were co-cultured in different Tconv:Treg ratios of 1:0 (negative control), 1:1, 1:2.5, 1:5, 1:10 and 1:20 in triplicate in a flat bottom polystyrene 96-well plate containing 200 µL/well of culture medium supplemented with 500 IU/mL recombinant human IL-2 and anti-human CD3/CD28 beads at 1:2 bead:cell (optimal) ratio at 37°C for 72 h under an atmosphere of 5% CO2. Then, cells were centrifuged at 500 g for 5 min at 4°C, washed with PBS and re-centrifuged as before. Tconv proliferation is presented as a histogram of percent gated CFSE-stained CD4+ cells relative to negative control. Treg suppressive activity is calculated using the formula: % suppression = 100 – (percent Tconv proliferation in co-culture)/(percent Tconv proliferation in absence of Treg) x 100.
Statistical analysis
Descriptive results are presented as median and percentage ± standard deviation (SD) Corresponding inferential comparisons of Treg suppressive activity (percent suppression) are calculated using t-test and Mann-Whitney U test.
Results
Isolation of PBMCs and CD8+ cell depletion
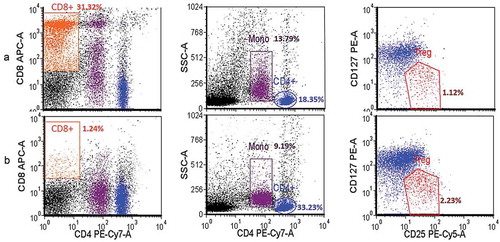
From 12–20 × 106 PBMCs (measured using an automated cell counter) obtained from 16 mL of whole blood using a BD Vacutainer® CPT™ tube, CD8+ lymphocyte depletion using nano-magnetic beads resulted in 8–10 × 106 CD4+- enriched lymphocyte for cell sorting by FACSAria III. Before depletion, CD4+ cell population was 16.02–18.35% of PBMCs and Treg cell population (CD4+ CD25high+ CD127low-) 1.46–1.97% of PBMCs () and following CD8+ depletion, percent CD4+ and Treg cells increased to 33.23–34.28 and 2.23–5.82% of PBMCs population, respectively (). However, the depletion protocol did not alter the number of Treg cells in CD4+ population. In addition, this protocol allowed the exclusion of non-target cells such as monocytes and cell debris.
Figure 1. PBMCs population before (A) and after (B) CD8+ depletion using anti-CD8+-coated magnetic beads. CD4+, CD8+, monocyte (Mono) and regulatory T cell (Treg) were gated to allow determination of population densities. Data from healthy donors (n = 3; experiment conducted in triplicate) were acquired using BD LSRFortessa and analyzed using FCS Express v.4. Following the depletion step, CD8+ cells were almost absent gating and did not interfere with Treg population density.
Gating strategy for cell sorting
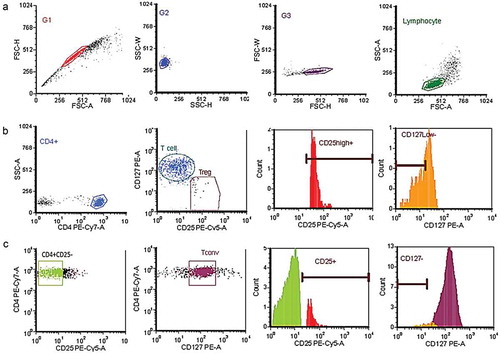
Treg and Tconv are defined as CD4+ CD25high+ CD127low- and CD4+ CD25-CD127+, respectively. A gating strategy to delete doublets was devised () to allow CD4+ population to be gated by SSC-A using PE-Cy7-A-labeled CD4 cells () and Treg by a population positive for high expression of CD25 (>5% MFI-positive CD25 cells) and zero to low expression of CD127 (<10% MFI-positive CD127 cells), the latter correlating with high (>98%) Foxp3 expression in the Treg population (data not shown). Tconv was gated by CD4+ CD25- population and followed by CD127 positive cell (). MFI-based gating of CD25 and CD127 cells showed the different level of both markers on Tregs and Tconvs population. The purity of isolated cell populations was determined by repeating the cell sorting using the same gating, which indicated >90% homogeneity in both cell populations, and standard trypan blue assay showed >92% cell viability in both populations.
Figure 2. Gating strategy for sorting of CD4+-enriched regulatory (Treg) and autologous (Tconv) T cells. Cells were sorted by BD FACSAria III and analyzed by FCS Express v. (a) Doublet discrimination initiated by dot-plot between FSC-H and FSC-A, followed by SSC-W and SSC-H, then FSC-W and FSC-H, and SSC-A and FSC-A for final discrimination. (b) CD4+ population gated by SSC-A and CD4 PE-Cy7-A, then Treg gated from CD4+ by CD127low-CD25high+ population. (c) Tconv population gated by CD4+ CD25-CD127+ population.
Anti-human CD3/CD28 and IL-2 dose optimization
Anti-human CD3/CD28 beads at bead:cell ratios ranging from 1:1 to 1:32 could stimulate Tconv proliferation >50%, but the optimal ratio was 1:2 (Supplementary figure S1A). As the recombinant human IL-2 is necessary for both Treg and Tconv survival in human cell culture, assessment of Tconv and Treg proliferation for 3 days in culture medium supplemented with 100 (low), 500 (moderate) and 1000 (high) IU/mL IL-2 and activated by anti-human CD3/CD28 beads at optimal bead:cell indicated Tconv proliferation of >70% in moderate and high dose of IL-2, and Treg proliferation can proliferate of >90% in all doses of IL-2 (Supplementary figure S1B). Consequently, 500 IU/mL IL-2 was employed in subsequent Tconv and Treg survival and proliferation assays. In addition, Tconv proliferation was tested in both U and flat-bottom 96-well plates; although percentage Tconv proliferation was superior in 95.89% in U than flat-bottom wells, the division peak of proliferative cell in the former well type had no clear sub-divisions compared to the latter (Supplementary figure S1C), so flat-bottom plates were used in all experiments.
Short-term Treg expansion
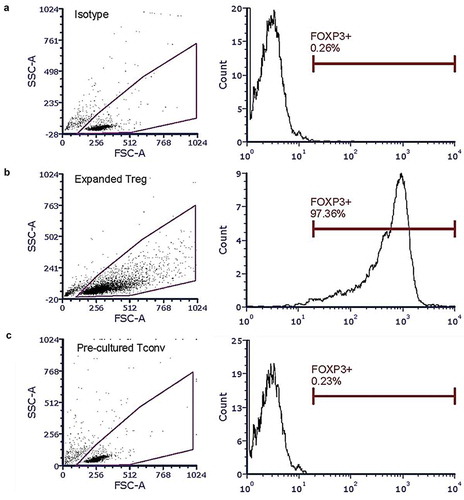
Under the optimized short-term expansion conditions, Tregs numbers increased 10-fold from 42,700 ± 10,583.48 (mean ± SD) to 537,000 ± 172,687.58 (mean ± SD) cells on day 4. Treg phenotype was maintained during the expansion, with 96% Foxp3 expression at the conclusion of the expansion ().
Figure 3. Intracellular Foxp3+ mensuration in short-term expanded Treg and pre-cultured Tconv. Expanded Tregs and pre-cultured Tconv were treated with Foxp3Alexafluor660 antibodies, then analyzed using a BD FACSAria III and FCS Express v.4. (a) Isotype test. (b) Foxp3 expression in Tregs after short-term expansion. (c) Foxp3 expression in Tconv after pre-cultured assay.
IL-2-pre-cultured Tconv
Tconvs were pre-cultured in culture medium supplemented with 500 IU/mL IL-2 for 4 days, in parallel with the period of Treg short-term expansion, to compare the proliferative ability of IL-2-pre-cultured Tconv with that isolated from fresh blood of the same donor. The pre-cultured Tconvs proliferated normally, not significantly from those of fresh cells (Supplementary figure S2). Moreover, pre-cultured Tconvs phenotype was confirmed. Foxp3+ expression in pre-cultured Tconvs still have no expression after the pre-culture assay (). In addition, Pre-cultured Tconvs from all healthy donors and RA patients demonstrated >40% proliferation when stimulated by anti-human CD3/CD28 beads (at 1:2 bead:cell ratio). This obviated the need of freeze/thawed Tconvs or to collect fresh blood from the same subject for isolating Tconv for co-culture suppression assays.
Co-culture suppression assay
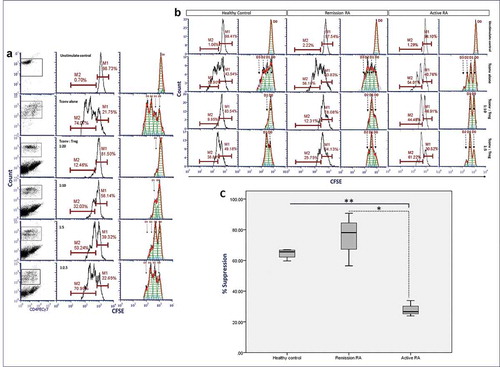
Short-term expanded Treg were co-cultivated with pre-cultured Tconv in culture medium supplemented with 500 IU/mL recombinant human IL-2 and anti-human CD3/CD28 beads at 1:2 bead:cell ratio at 37ºC under an atmosphere of 5% CO2 for 72 h. Treg suppression of Tconv proliferation occurred at Tconv:Treg ratios of 1:5 (26.67%) to 1:20 (83.51%) (). Proliferative cell division also was analyzed using a proliferation analysis plot, which clearly showed division peaks of every generation of Tconv proliferation. Moreover, we compared the suppression assay between Treg co-culture with fresh-isolated Tconv and IL-2-pre-cultured Tconv to confirm the suppressive ability of Treg did not alter by using the pre-cultured Tconv (Supplementary figure S3). The percent Treg suppression from active RA patient group is significantly lower than that of a healthy donor and in-remission RA patient groups (p-value < 0.0001 and < 0.05, respectively), but percent Treg suppression of in-remission RA patient group is not significantly different from healthy donor group (). Median of percent suppression in active RA group was 26.60 (range 23.90–33.88, 95% confidence interval (CI) 15.38–40.81) while that of in-remission RA and healthy control was 78.13 (range 56.49–90.72, 95% confidence interval (CI) 32.10–118.12) and 65.62 (range 59.66–66.97, 95% confidence interval (CI) 54.80–72.46) respectively ().
Figure 4. Co-culture suppression assay with short-term regulatory T cells (Treg) expansion and IL-2-pre-cultured autologous T cells (Tconvs) from healthy donors and patients with active rheumatoid arthritis (RA) and patients in remission which classified by ACR/EULAR 2010 or ACR 1987 criteria. IL-2-pre-cultured Tconv (1x10⁴ cells) were co-cultured with short-term expanded Tregs in culture medium supplemented with 500 IU/mL of human recombinant IL-2 and anti-CD3/28 beads for 72 h at 37ºC under an atmosphere of 5% CO2. Following co-culture, Tconvs were labeled with carboxyfluorescein succinimidyl ester (CSFE), counted in a Beckman Colter-FC500 and analyzed by FCS Express v.4. (a) Percent Tconv at different ratios of Tconv:Treg from a healthy donor. Left, center and right column: dot plot, histogram and histogram curve analysis, respectively, of CFSE-labeled Tconvs. (b) Percent Tconv at different ratios of Tconv:Treg from a healthy donor, a patient with active RA and an RA patient in remission donor. Left and right panel of each donor type: histogram and histogram curve analysis, respectively, of CFSE-labeled Tconvs. (c) Plot of percent suppression (in Tconvs:Treg ratio as 1:10) of healthy control donors (n = 4), patients with active RA (n = 3) and RA patients in remission (n = 3). Horizontal line, vertical line, and box represent group of patients and healthy control, percent suppression of Treg, box-plot with mean and range of the percent suppression, respectively. M1, original cell population; M2, proliferated cell population; D0, original cell division; D1, the first cell division; D2, the second cell division; D3, the third cell division; *p-value = 0.011, **p-value <0.0001; independent sample t-test.
Discussion
The study demonstrates measurement of Treg suppression activity was possible employing an optimized co-culture system composed of short-term (4 days) expanded Treg and IL-2-pre-cultured (also 4 days) Tconv. Method workflow was summarized as supplementary figure S4. This protocol enabled differentiation of Treg suppression ability between active RA patients and those in an in-remission state, the latter being no different from healthy controls. This is an improvement over the conventional Treg expansion procedure of 10-15 days.[Citation10,Citation15] Treg phenotype was maintained during the expansion period as demonstrated by the expression of intracellular Foxp3. The co-culture suppression assay was optimal at Tconv:Treg ratio of 1:5 or less, in agreement with previous reports.[Citation26]
A study reporting a requirement of 5–10 × 103 fresh Treg cells/suppression assay (normally requiring 1.0–2.0 × 10⁴ cells) isolated from infiltrating lymphocytes,[Citation19] but Tregs from such sources are known to be highly active to prevent the incursion of other immune cells.[Citation27–Citation29] On the other hand, autoimmune or allergic diseases have a small number of PB Tregs with compromised suppression functions, which depend on the amount of pro-inflammatory cytokines, site of inflammation and T cell plasticity.[Citation8,Citation30,Citation31] In patients with active RA, the numbers of PB Tregs (CD4+ CD25high+ CD127low-) are significantly lower than those from RA patients in remission state or healthy controls.[Citation22] Thus, a larger volume of blood has to be drawn from these patients to provide a sufficient quantity of cells for isolation of Tregs. CD4+-enriched cell was obtained through the use of magnetic bead-aided CD8+ depletion to facilitate subsequent cell sorting of Tregs.[Citation32]
A Tconv pre-cultured protocol was established to eliminate the need to use previously stored frozen subject cells, a procedure not only detrimental to cell viability but runs the risk of inflicting alterations to the expression of T cell phenotype markers.[Citation33] The IL-2-pre-cultured period was carried out in parallel with the short-term Treg expansion step so that both set of cells were ready at the time for use in co-culture suppression assay. The 4-day period for both procedures was to accommodate sufficient time for Treg expansion and maintenance of Tconv viability and proliferative ability, which wane after 5 days under pre-cultured conditions (data not shown). In addition, there are a number of critical factors that have to be optimized in a co-culture suppression assay. For example; Tregs number, Tconv:Treg ratio, concentration of IL-2,[Citation34] anti-human CD3/CD28 bead:cell ratio (if used), and even shape of assay well bottom.[Citation35] The optimized protocol was evaluated in a small number of patients with active RA and those in remission, demonstrating the ability of the co-culture assay to discriminate between Treg suppression properties of the two groups of patients.[Citation36–Citation38]
This protocol takes only 7 days to complete, from cell sorting, Tconv pre-culture, short-term Treg expansion, and co-culture suppression assay, compared to 14–17 days in a conventional co-culture suppression assay in autoimmune disease.[Citation39] An alternative Treg expansion protocol, involving cell isolation based on CD25Bright by single step with magnetic isolation and stimulated with anti-CD3 and anti-CD28 monoclonal antibodies, resulting in 5–6 fold increase in Treg numbers but still takes 14–21 days, with a yield of 69% Foxp3-expressing cells.[Citation17] Moreover, large-scale expansion of Treg protocol was established by using xenoantigen stimulation and also obtained only 60.1% Foxp3 expressing Tregs after 21 days of cell stimulation.[Citation40]
Conclusion
In conclusion, a practical short-term Treg expansion method was established for co-culture suppression assay employing autologous Tconvs pre-cultured by IL-2 in parallel with the expansion period. This protocol should facilitate future Treg suppression assays and could be applicable in Treg functional studies of various disease conditions, especially in case of small number of PB Treg such as rheumatoid arthritis and autoimmune diseases.
Conflict of Interest
All authors: Nothing to declare
Supplemental Material
Download MS Word (1.4 MB)Acknowledgments
Authors would like to thank all laboratory staffs, Department of Pathology, Ramathibodi hospital and Department of Microbiology, Faculty of Science, Mahidol University for co-working and thank all nurses of division of allergy immunology and rheumatology, Ramathibodi hospital, for blood collection. This study was supported by a research scholarship from the National Research Council of Thailand and by Mahidol University. ID 214261.
Supplementary Material
Supplemental data for this article can be accessed here.
Additional information
Funding
Related Research Data
References
- Sakaguchi, S.; Miyara, M.; Costantino, C. M.; Hafler, D. A. FOXP3+ Regulatory T Cells in the Human Immune System. Nat. Rev. Immunol. 2010, 10, 490. DOI: 10.1038/nri2785.
- Fontenot, J. D.; Rasmussen, J. P.; Williams, L. M.; Dooley, J. L.; Farr, A. G.; Rudensky, A. Y. Regulatory T Cell Lineage Specification by the Forkhead Transcription Factor Foxp3. Immunity. 2005, 22(3), 329–341. DOI: 10.1016/j.immuni.2005.01.016.
- Rudensky, A. Y.;. Regulatory T Cells and Foxp3. Immunol. Rev. 2011, 241(1), 260–268. DOI: 10.1111/j.1600-065X.2011.01018.x.
- Feuerer, M.; Hill, J. A.; Mathis, D.; Benoist, C. Foxp3+ Regulatory T Cells: Differentiation, Specification, Subphenotypes. Nat. Immunol. 2009, 10, 689. DOI: 10.1038/ni.1760.
- Venken, K.; Hellings, N.; Broekmans, T.; Hensen, K.; Rummens, J.-L.; Stinissen, P. Natural Naive CD4+CD25+CD127low Regulatory T Cell (Treg) Development and Function are Disturbed in Multiple Sclerosis Patients: Recovery of Memory Treg Homeostasis during Disease Progression. J. Immunol. 2008, 180(9), 6411. DOI: 10.4049/jimmunol.180.9.6411.
- Afzali, B.; Lombardi, G.; Lechler, R. I.; Lord, G. M. The Role of T Helper 17 (th17) and Regulatory T Cells (treg) in Human Organ Transplantation and Autoimmune Disease. Clin. Exp. Immunol. 2007, 148(1), 32–46. DOI: 10.1111/j.1365-2249.2007.03356.x.
- Kleinewietfeld, M.; Hafler, D. A. The Plasticity of Human Treg and Th17 Cells and Its Role in Autoimmunity. Semin. Immunopathol. 2013, 25(4), 305–312. DOI: 10.1016/j.smim.2013.10.009.
- Ueno, A.; Jeffery, L.; Kobayashi, T.; Hibi, T.; Ghosh, S.; Jijon, H. Th17 Plasticity and Its Relevance to Inflammatory Bowel Disease. J. Autoimmun. 2018, 87, 38–49. DOI: 10.1016/j.jaut.2017.12.004.
- Ward-Hartstonge, K. A.; Kemp, R. A. Regulatory T-cell Heterogeneity and the Cancer Immune Response. Clin. Transl. Immunol. 2017, 6(9), e154. DOI: 10.1038/cti.2017.43.
- Collison, L. W.; Vignali, D. A. A. In Vitro Treg Suppression Assays. Methods Mol. Biol. (Clifton, N.J.). 2011, 707, 21–37. DOI: 10.1007/978-1-61737-979-6_2.
- McMurchy, A. N.; Levings, M. K. Suppression Assays with Human T Regulatory Cells: A Technical Guide. Eur. J. Immunol. 2011, 42(1), 27–34. DOI: 10.1002/eji.201141651.
- Schmidt, A.; Rieger, C. C.; Venigalla, R. K.; Éliás, S.; Max, R.; Lorenz, H.-M.; Gröne, H.-J.; Krammer, P. H.; Kuhn, A. Analysis of FOXP3+ Regulatory T Cell Subpopulations in Peripheral Blood and Tissue of Patients with Systemic Lupus Erythematosus. Immunol. Res. 2017, 65(2), 551–563. DOI: 10.1007/s12026-017-8904-4.
- Dejaco, C.; Duftner, C.; Grubeck-Loebenstein, B.; Schirmer, M. Imbalance of Regulatory T Cells in Human Autoimmune Diseases. Immunology. 2006, 117(3), 289–300. DOI: 10.1111/j.1365-2567.2005.02317.x.
- Morita, T.; Shima, Y.; Wing, J. B.; Sakaguchi, S.; Ogata, A.; Kumanogoh, A. The Proportion of Regulatory T Cells in Patients with Rheumatoid Arthritis: A Meta-Analysis. Plos One. 2016, 11(9), e0162306. DOI: 10.1371/journal.pone.0162306.
- Godfrey, W. R.; Ge, Y. G.; Spoden, D. J.; Levine, B. L.; June, C. H.; Blazar, B. R.; Porter, S. B. In Vitro-expanded Human CD4+CD25+ T-regulatory Cells Can Markedly Inhibit Allogeneic Dendritic Cell–stimulated MLR Cultures. Blood. 2004, 104(2), 453. DOI: 10.1182/blood-2003-11-3979.
- Elpek, K. G.; Yolcu, E. S.; Franke, D. D. H.; Lacelle, C.; Schabowsky, R.-H.; Shirwan, H. Ex Vivo Expansion of CD4+CD25+FoxP3+ T Regulatory Cells Based on Synergy between IL-2 and 4-1BB Signaling. J. Immunol. 2007, 179(11), 7295. DOI: 10.4049/jimmunol.179.11.7295.
- Chakraborty, R.; Mahendravada, A.; Perna, S. K.; Rooney, C. M.; Heslop, H. E.; Vera, J. F.; Savoldo, B.; Dotti, G. Robust and Cost Effective Expansion of Human Regulatory T Cells Highly Functional in a Xenograft Model of Graft-versus-host Disease. Haematologica. 2013, 98(4), 533. DOI: 10.3324/haematol.2012.076430.
- Mirjalili, A.; Parmoor, E.; Moradi Bidhendi, S.; Sarkari, B. Microbial Contamination of Cell Cultures: A 2 Years Study. Biologicals. 2005, 33(2), 81–85. DOI: 10.1016/j.biologicals.2005.01.004.
- Ward, S. T.; Li, -K.-K.; Curbishley, S. M. A Method for Conducting Suppression Assays Using Small Numbers of Tissue-isolated Regulatory T Cells. MethodsX. 2014, 1, 168–174. DOI: 10.1016/j.mex.2014.08.012.
- Wang, T.; Sun, X.; Zhao, J.; Zhang, J.; Zhu, H.; Li, C.; Gao, N.; Jia, Y.; Xu, D.; Huang, F.-P.; et al. Regulatory T Cells in Rheumatoid Arthritis Showed Increased Plasticity toward Th17 but Retained Suppressive Function in Peripheral Blood. Ann. Rheumatic Dis. 2015, 74(6), 1293. DOI: 10.1136/annrheumdis-2013-204228.
- Long, A. E.; Tatum, M.; Mikacenic, C.; Buckner, J. H. A Novel and Rapid Method to Quantify Treg Mediated Suppression of CD4 T Cells. J. Immunol. Methods. 2017, 449, 15–22. DOI: 10.1016/j.jim.2017.06.009.
- Kawashiri, S.-Y.; Kawakami, A.; Okada, A.; Koga, T.; Tamai, M.; Yamasaki, S.; Nakamura, H.; Origuchi, T.; Ida, H.; Eguchi, K. CD4+CD25highCD127low/- Treg Cell Frequency from Peripheral Blood Correlates with Disease Activity in Patients with Rheumatoid Arthritis. J. Rheumatol. 2011, 38(12), 2517. DOI: 10.3899/jrheum.100724.
- Oh, S.; Rankin, A. L.; Caton, A. J. CD4+CD25+ Regulatory T Cells in Autoimmune Arthritis. Immunol. Rev. 2009, 233(1), 97–111. DOI: 10.1111/j.0105-2896.2009.00848.x.
- Liu, W.; Putnam, A. L.; Xu-yu, Z.; Szot, G. L.; Lee, M. R.; Zhu, S.; Gottlieb, P. A.; Kapranov, P.; Gingeras, T. R.; de St. Groth, B. F.; et al. CD127 Expression Inversely Correlates with FoxP3 and Suppressive Function of Human CD4+ T Reg Cells. J. Exp. Med. 2006, 203(7), 1701. DOI: 10.1084/jem.20060772.
- Zucker, R. M.;. Going with the Flow. “flow Cytometry and Sorting, 2nd Edition,” M. R. Melamed, T. Lindmo, and M. L. Mendelsohn (eds). New York: Wiley-Liss, Inc., 1990, 824 Pp, $89.50. Environ. Mol. Mutagen. 1991, 17(1), 69. DOI: 10.1002/(ISSN)1098-2280.
- Mayer, C. T.; Sparwasser, T. Assessing the Suppressive Activity of Foxp3+ Regulatory T Cells. In T-Helper Cells: Methods and Protocols; Waisman, A., Becher, B., Eds.; Springer New York: New York, 2014; pp 85–96.
- Facciabene, A.; Motz, G. T.; Coukos, G.; Regulatory Cells:, T. Key Players in Tumor Immune Escape and Angiogenesis. Cancer Res. 2012, 72(9), 2162–2171. DOI: 10.1158/0008-5472.CAN-11-3687.
- Griffiths, R. W.; Elkord, E.; Gilham, D. E.; Ramani, V.; Clarke, N.; Stern, P. L.; Hawkins, R. E. Frequency of Regulatory T Cells in Renal Cell Carcinoma Patients and Investigation of Correlation with Survival. Cancer Immunol. Immunother. 2007, 56(11), 1743–1753. DOI: 10.1007/s00262-007-0318-z.
- French, J. D.; Weber, Z. J.; Fretwell, D. L.; Said, S.; Klopper, J. P.; Haugen, B. R.; Lymphocytes, T.-A. Increased FoxP3(+) Regulatory T Cell Frequency Correlate with More Aggressive Papillary Thyroid Cancer. J. Clin. Endocrinol. Metab. 2010, 95(5), 2325–2333. DOI: 10.1016/j.jim.2007.07.012.
- Dominguez-Villar, M.; Hafler, D. A. Regulatory T Cells in Autoimmune Disease. Nat. Immunol. 2018, 19(7), 665–673. DOI: 10.1038/s41590-018-0120-4.
- Levine, A. G.; Mendoza, A.; Hemmers, S.; Moltedo, B.; Niec, R. E.; Schizas, M.; Hoyos, B. E.; Putintseva, E. V.; Chaudhry, A.; Dikiy, S.; et al. Stability and Function of Regulatory T Cells Expressing the Transcription Factor T-bet. Nature. 2017, 546, 421. DOI: 10.1038/nature22360.
- Peters, J. H.; Preijers, F. W.; Woestenenk, R.; Hilbrands, L. B.; Koenen, H. J. P. M.; Joosten, I. Clinical Grade Treg: GMP Isolation, Improvement of Purity by CD127(pos) Depletion, Treg Expansion, and Treg Cryopreservation. PLoS ONE. 2008, 3(9), e3161. DOI: 10.1371/journal.pone.0003161.
- Owen, R. E.; Sinclair, E.; Emu, B.; Heitman, J. W.; Hirschkom, D. F.; Epling, C. L.; Tan, Q. X.; Custer, B.; Harris, J. M.; Jacobson, M. A.; et al. Loss of T Cell Responses following Long-term Cryopreservation. J. Immunol. Methods. 2007, 326(1–2), 93–115. DOI: 10.1016/j.jim.2007.07.012.
- Strauss, L.; Bergmann, C.; Whiteside, T. L. Human Circulating CD4+CD25highFoxp3+Regulatory T Cells Kill Autologous CD8+but Not CD4+Responder Cells by Fas-Mediated Apoptosis. J. Immunol. 2009, 182(3), 1469. DOI: 10.4049/jimmunol.0802775.
- Shafaie, S.; Hutter, V.; Brown, M. B.; Cook, M. T.; Chau, D. Y. S. Influence of Surface Geometry on the Culture of Human Cell Lines: A Comparative Study Using Flat, Round-bottom and V-shaped 96 Well Plates. PLoS ONE. 2017, 12(10), e0186799. DOI: 10.1371/journal.pone.0186799.
- Cooles, F. A. H.; Isaacs, J. D.; Anderson, A. E. Treg Cells in Rheumatoid Arthritis: an Update. Curr. Rheumatol. Rep. 2013, 15(9), 352. DOI: 10.1007/s11926-013-0352-0.
- Valencia, X.; Stephens, G.; Goldbach-Mansky, R.; Wilson, M.; Shevach, E. M.; Lipsky, P. E. TNF Downmodulates the Function of Human CD4(+)CD25(hi) T-regulatory Cells. Blood. 2006, 108(1), 253–261. DOI: 10.1182/blood-2005-11-4567.
- Bromberg, J.;. TNF-α Trips up Treg Cells in Rheumatoid Arthritis. Nat. Med. 2013, 19, 269. DOI: 10.1038/nm.3124.
- Rossetti, M.; Spreafico, R.; Saidin, S.; Chua, C.; Moshref, M.; Leong, J. Y.; Tan, Y. K.; Thumboo, J.; van Loosdregt, J.; Albani, S. Ex Vivo–Expanded but Not in Vitro–Induced Human Regulatory T Cells are Candidates for Cell Therapy in Autoimmune Diseases Thanks to Stable Demethylation of the FOXP3 Regulatory T Cell–Specific Demethylated Region. J. Immunol. 2015, 194(1), 113. DOI: 10.4049/jimmunol.1402705.
- Jin, X.; Lu, Y.; Zhao, Y.; Yi, S. Large-scale in Vitro Expansion of Human Regulatory T Cells with Potent Xenoantigen-specific Suppression. Cytotechnology. 2016, 68(4), 935–945. DOI: 10.1007/s10616-015-9845-1.