
 ?Mathematical formulae have been encoded as MathML and are displayed in this HTML version using MathJax in order to improve their display. Uncheck the box to turn MathJax off. This feature requires Javascript. Click on a formula to zoom.
Abstract
The KArlsruhe TRItium Neutrino (KATRIN) collaboration aims to determine the neutrino mass with a sensitivity of 0.2 eV/c2 (90% confidence level). This will be achieved by probing the end-point region of the β-electron spectrum of gaseous tritium with an electrostatic spectrometer. A gold-coated stainless steel disk defines the reference potential for high-precision neutrino mass measurement, and it terminates the β-electron flux as the physical boundary of the tritium source. This so-called rear wall is exposed to tritium, which leads to adsorption and absorption. This in turn leads to systematic uncertainties for the neutrino mass measurements that need to be understood and mitigated. In maintenance phases, during which the gaseous tritium source was emptied (<10−5 of nominal gas density), the activity that accumulated on the rear wall during normal operation was monitored using beta-induced X-ray spectrometry (BIXS) and direct observation of emitted β electrons with a silicon detector. Dependency of the observed activity increase on the integral tritium throughput was investigated and found to converge from limited exponential growth to continuous linear growth. This paper gives an overview of the results that were obtained using several methods of in situ decontamination of the rear wall while continuously monitoring the activity. The decontamination methods included heating during continuous evacuation; flushing the system with nitrogen, deuterium, or air with residual humidity at different pressures; and illumination of the rear wall with ultraviolet (UV) light. These well-known methods led to only a small (15%) decrease in the observed activity. However, a decrease of the surface activity by three orders of magnitude in less than 1 week was achieved by combination of different methods using UV light, a heated surface, and a low (5 to 100 mbar) pressure of air inside the chamber, leading to the production of highly reactive ozone. This proved to be by far the most efficient method, drastically reducing the contribution of the rear wall surface activity to the β spectrum of the gaseous source.
I. INTRODUCTION
The KArlsruhe TRItium Neutrino (KATRIN) Experiment Collaboration aims to measure the neutrino mass with an unprecedented sensitivity of
eV/c2 from high-precision spectroscopy of the β electrons from tritium decay.[Citation1] A nonvanishing neutrino mass affects the spectral shape near the kinematic end point of
keV/c2. The experiment design allows for measuring this tiny signature with high statistics and low systematic uncertainty. The β electrons are generated within a tritium source characterized by its pressure profile, temperature, and isotopic composition.[Citation2] During operation of KATRIN, surfaces exposed to tritium, like the so-called rear wall, accumulate activity. The β electrons originating from the rear wall have a slightly different electron spectrum that overlays with the one from the gaseous tritium. This makes consideration of this secondary spectrum necessary to avoid biasing the neutrino mass analysis. This phenomenon, i.e., the undesired impact of residual tritium to measurement systems sensitive to tritium, is known as the tritium memory effect. Its suppression[Citation3] as well as its removal[Citation4,Citation5] is actively discussed in literature.
In the scope of this work, the accumulation of tritium on the KATRIN rear wall was investigated, and several established in situ decontamination methods were compared. The activity during those processes was continuously monitored using beta-induced X-ray spectrometry (BIXS),[Citation6] and the final decontamination efficiency was determined with KATRIN’s main detector.
II. THE REAR WALL IN THE KATRIN SETUP
The 70-m-long KATRIN setup is depicted in the right side of . A detailed description of the hardware can be found in Aker et al.[Citation7] Molecular tritium is circulated in the windowless gaseous tritium source (WGTS) with a throughput of up to 40 g∙day−1, corresponding to an activity of Bq.[Citation8] The β electrons are transported downstream by magnetic fields toward the main spectrometer, which acts as an electrostatic high-pass filter. Electrons that can overcome the variable retardation potential are counted by the main detector, called the focal plane detector (FPD),[Citation9] based on multipixel silicon p-i-n-diode technology at the end of the beamline. Recording the count rate as a function of retardation potential finally results in an integral β spectrum that contains information about the neutrino mass in its shape near the end point.
Fig. 1. The sketch of the KATRIN experiment hosted in the Tritium Laboratory Karlsruhe is shown on the right. The concept of the rear wall chamber is shown on the left. The rear wall is a stainless steel disk ( mm) that is sputter-coated with 1 μm of gold.
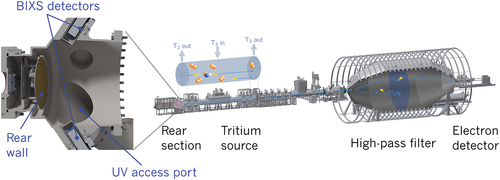
Determination of the neutrino mass is achieved by a multiparameter fit, taking into account the model of β decay and the experimental configuration.[Citation10] The upstream direction of the source is terminated by the so-called rear wall (see the left side of ). The rear wall, consisting of a stainless steel disk with a diameter of 145 mm, is sputter-coated with a 1-μm-thick layer of gold and has a central hole with a diameter of 5 mm. It is mounted on a support fixed to the stainless steel vacuum chamber, with the gold-coated side facing KATRIN’s tritium source. More than 99% of all β electrons and positive tritium ions (T+, ,
, …) will eventually end up on the rear wall as their motions are confined on cyclotron tracks along the magnetic field lines.
The injection pressure of T2 in the center of the tritium source is about 10−3 to 10−2 mbar. The pressure is reduced by differential pumping to 10−6 mbar within the rear wall chamber. The rear wall chamber is equipped with two beta-induced X-ray spectrometers.[Citation6] These detectors are facing the rear wall surface under different angles and can monitor the activity using X-rays generated by β electrons interacting with the gold surface.
III. ACCUMULATION OF TRITIUM ACTIVITY ON THE REAR WALL OF KATRIN
III.A. Impact of Tritium Accumulation on the Rear Wall
The rear wall is the physical boundary of the tritium source and as such is exposed to impinging tritium molecules and tritium (cluster) ions, which leads to adsorption and absorption of tritium on its surface. This can occur via different processes. While the adsorption of molecular tritium is the most basic process, literature suggests that its effect on gold at room temperature is marginal[Citation11,Citation12] and is thus neglected here. Adsorption of HTO can lead to persistent surface contamination.[Citation13,Citation14] This process, which is relevant for the activity buildup at the rear wall, is also described for gold in Sharpe[Citation15] and references therein. The formation of tritiated co-deposited carbon layers is another, intensely investigated, process of tritium accumulation on a surface.[Citation16–18] Especially, the formation of tritiated amorphous carbon (aC:T) in a highly energetic tritium plasma in fusion reactors is discussed.[Citation19]
However, the formation of aC:T should also be considered in tritium systems not exposed to fusion plasma. Growth of amorphous carbon (aC) or aC:H is also induced by electron beam–induced carbon deposition. This is a well-investigated occurrence in electron microscopes that utilize electrons with kinetic energies comparable to those created by tritium β decay.[Citation20,Citation21] This suggests the formation of aC:T in any system with gaseous tritium, especially on the KATRIN rear wall due to the electron flux guided toward the surface. This can happen by an initial growth of aC, whose open bonds are prone to tritiation by T2 and respective ions; tritiation of initial aC:H by isotope exchange; or direct formation of aC:T from tritiated precursor molecules.
Surface-adsorbed tritium on the rear wall undergoes β decay and thus contributes to the β spectrum from the gaseous tritium source measured by the FPD. However, the effective rear wall electron spectrum is not identical to the β spectrum from the gaseous tritium source. It can be shifted in energy by the effective work function and can be distorted by unaccounted electron energy losses, backscattering effects, and the effective final state distribution (FSD).
The β decay from the initial states of the molecular tritium species, QT (Q = H, D, T), involves ro-vibrational as well as electronic excitation of the final states of the 3HeQ+ ions, respectively.[Citation22] This FSD is accurately described by quantum chemistry calculations.[Citation23] However, the FSD of surface-bound tritium on the rear wall differs from that of gaseous tritium in the WGTS and depends on the adsorbed species and molecular structure, which are currently unknown. Thus, the contribution of the rear wall spectrum to the combined spectrum would bias the neutrino mass analysis.
Quantification of the process of tritium accumulation on the rear wall is thus paramount to consider the impact of the secondary spectrum on the neutrino mass analysis and to mitigate the respective systematic uncertainty.
III.B. Observation of Tritium Accumulation
Dedicated measurements of the activity accumulated on the rear wall are performed using the entire KATRIN beamline. At fixed retardation potential of kV, the count rate [
] per pixel at the detector provides a high-precision measurement in 10 min of acquisition time. This type of measurement is performed during maintenance phases and dedicated measurement periods during which no tritium is circulated in the WGTS and when it is being evacuated to less than
of the nominal gas density.
In , the evolution of the rate during one measurement campaign is plotted as a function of the integral T2 throughput through the tritium source. The rate was found to continuously increase and can be well described by limited exponential growth converging into linear growth. Such a model would be fitting for the formation of an initial layer on a clean surface or the saturation of an already existing layer, followed by linear layer growth. This measurement is sensitive to emitted β electrons with a kinetic energy of more than 14 keV. At this retarding potential, only β electrons from the surface or near-surface regions of the rear wall can be detected. While tritium below the surface can contribute to the measured rate, the achieved decontamination results imply that subsurface tritium is only a minor contributor to the observed rate.
Fig. 2. Rate increase as a function of integral tritium flow through the KATRIN WGTS with the best-fit result of the function , with
,
mbar∙ℓ−1,
mbar∙ℓ, and
cps/mbar∙ℓ. The rate was scaled up to show the expected rate of the entire β spectrum. During one of the measurements, a deviation in the set retarding potential occurred, which explains the larger error on this data point. (cps = counts per second.)
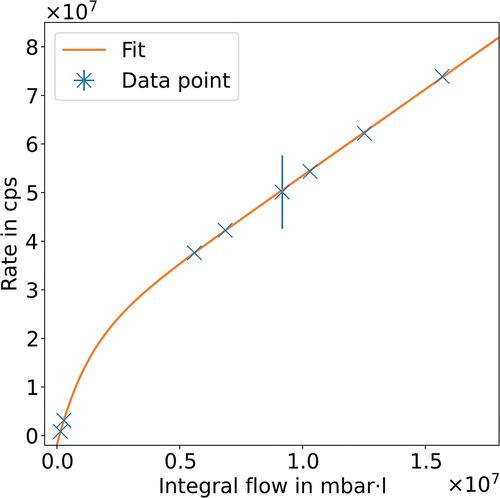
The applied decontamination techniques are typically used for surface cleaning, and a significant decontamination effect for subsurface tritium would not be expected. However, a high decontamination factor was achieved (see Sec. IV.B), which implies that surface bound tritium is the dominating contributor to the observed rate. Since no information about the exact tritium depth profile can be obtained, only a lower limit for the activity of the rear wall at the end of each measurement campaign can be assessed. This value is 1.5 MBq∙cm−2 for the measurement campaign prior to the decontamination study described below. For its determination, the measured rate at the FPD is extrapolated considering the cutoff in the spectrum at 14 keV and the transmission probability depending on the electron emission angle relative to the guiding magnetic field. With the detector background of 220 mcps, the lower limit of detection is on the order of Bq∙cm−2.
IV. REMOVAL OF ACCUMULATED ACTIVITY
Besides monitoring of the accumulated tritium on the rear wall and thus considering the resulting β spectrum in the analysis, removal of the adsorbed/absorbed activity from the rear wall is the preferable countermeasure to minimize systematic effects on the neutrino mass analysis. There exists a variety of decontamination techniques that were applied within the scope of this work. The system was flushed with inert N2,[Citation24] humid air,[Citation25] or other hydrogen isotopes, utilizing the isotopic exchange process as a decontamination mechanism.[Citation26] These techniques are typically combined with heating of the system to desorb tritiated water from surfaces. Additionally, UV/ozone cleaning was investigated in this work. It is known to effectively remove hydrocarbon contaminants on a large variety of surfaces[Citation27] and has successfully been investigated as a means of surface decontamination for tritium.[Citation5,Citation28]
IV.A. Setup for Rear Wall Decontamination
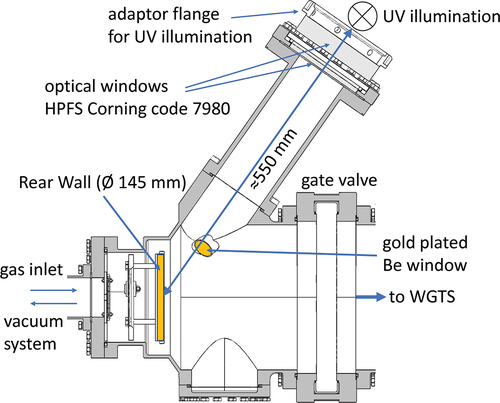
The rear wall chamber of KATRIN is depicted in . The rear wall chamber can be separated from the tritium source via a gate valve. The vacuum system behind the rear wall allows for flushing the system with various gases and evacuation down to less than 10−6 mbar. Two Hg-UV lampsFootnotea with each 24 W of electrical power are located behind an optical port to illuminate the rear wall with discrete lines at wavelengths of 185 and 253 nm. Additionally, the two BIXS systems usually used for monitoring the activity of the tritium source can be used for inline monitoring of the decontamination process. During the decontamination procedures, the gate valve is closed; thus, activity monitoring by the KATRIN main detector becomes unavailable. The rear wall chamber and the rear wall itself are equipped with heaters, allowing the system to be heated at maximal temperatures of 100°C to 110°C (chamber) and 165°C (rear wall). N2, D2, and filtered air with residual humidity were selected as flushing gases.
Fig. 3. Cut through the middle plane of the rear wall chamber. The walls of the primary system are shown in gray. On the left side, the rear wall chamber is connected via a DN63 tube to the so-called mid chamber (not shown) where the gas injection and the vacuum system are attached. The two UV lamps are located at -mm distance to the rear wall behind two vacuum view ports HPFS Corning code 7980. The intermediate space between the lamp and the optical window is purged with nitrogen during operation of the UV lamps. For the BIXS system, a silicon drift detector is installed behind the beryllium window, which was used to monitor the decontamination effect. The gate valve to the WGTS was closed during the whole decontamination procedure.
IV.B. Decontamination Procedure and Results
The recorded BIXS rate is shown in after 35 days of evacuation, with marked intervals of the subsequently performed decontamination steps. During evacuation, a reduction of the rate of roughly 1.5% was observed. Prior to step 1, the UV illumination was activated for a duration of 4 days, which led to a rate decline of less than 2.5%. For better visibility, this is not shown in the plot. Step 1 marks the start of the heating while evacuation was continued constantly with step 2.
Fig. 4. BIXS count rate readings during the rear wall decontamination procedure. The numbers mark the different decontamination steps performed, according to the legend in the plot. Another period of UV illumination over a time span of 4 days prior to step 1 is not shown for visibility reasons. During this period, a rate reduction of less than 2.5% was achieved.
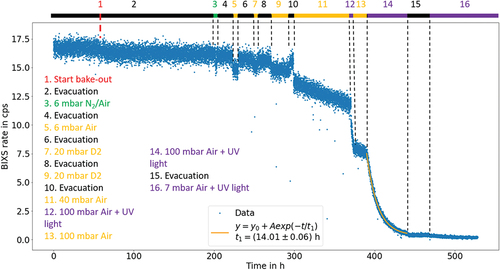
Following the heating, a rate decrease of 3% was observed after a time period of 5 days, with the decline happening mainly within 1 day. Flushing the system with N2 (6 mbar) and air (
5 mbar) over a short period of time (step 3) resulted in a reduction of the recorded count rate due to scattering and absorption of the emitted β electrons in the gas. Subsequent evacuation of the system (step 4) resulted in a return to the previous rate level. Repetition of the same process with longer exposure times with
6 mbar of air (steps 5 and 6) or
20 mbar of D2 (steps 7, 8, 9, and 10) yielded the same results, indicating that no significant decontamination was achieved.
The exposure of the system to 40 mbar of ambient air with residual humidity (step 11) led to another reduction in the observed count rate followed by a continuous linear rate decrease of roughly 5% days−1. The latter is attributed to the decontamination effect of the residual humidity since water vapor[Citation29–31] is known to effectively remove tritium contamination from surfaces. Tritium removed from the surface leads to a lower BIXS signal since the emitted β electrons are less likely to hit the rear wall and generate X-rays that BIXS detects. This effect is further increased by the attenuation by the gas mentioned earlier. In step 12, the pressure of the air was increased to roughly 100 mbar, and the UV illumination was activated resulting in a steep, continuous decrease of the observed count rate.
During step 13, the rate continues the previously observed slower, linear decline after turning the illumination off. No sharp transition to another rate level or regeneration of the count rate is being observed, verifying that the count rate decrease is a result of a persistent decontamination effect. Continuing the UV illumination in step 14 causes a continued decline of the count rate following an exponential trend with a time constant of h.
In step 15, the system was evacuated, resulting in an % decline of the count rate due to the removal of tritiated gas species. The decontamination with activated UV light and ambient air at a pressure of 7 mbar was continued for 9 days resulting in a further decrease of the observed count rate to 21% compared to the rate during step 15. Over a time span of 14 days, no significant recovery of the count rate was observed.
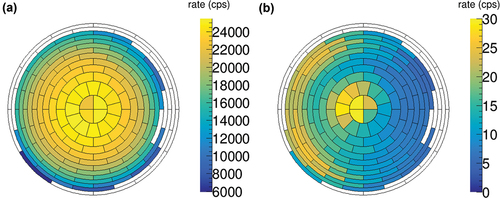
The final achieved decontamination factor of roughly 1300 was determined by comparing measurements before and after the above described procedure using the KATRIN setup as described in Sec. III.B. The assessed lower value for the surface activity of the rear wall after the decontamination was 1.1 kBq∙cm−2. In the distribution of the activity on the rear wall as seen by the FPD is shown for those two measurements. While the first measurement shows homogeneous radial distribution of the activity, the second measurement shows a notably lower count rate at the right side. This area coincides with the incoming UV illumination, indicating stronger decontamination effects on areas where a higher UV light intensity or ozone concentration could be expected. It is not entirely clear from literature whether the UV light directly causes the decontamination[Citation18] or whether the effect is solely caused by ozone as suggested by Ishikawa and Hirose.[Citation32] However, our data demonstrate that the combined UV/ozone approach is significantly more effective than UV alone.
Fig. 5. Distribution of the near-surface tritium on the rear wall as seen by the segmented FPD (a) before and (b) after the UV/ozone decontamination. The total rate was decreased by a factor of roughly 1300. In (b), a rate hot spot in the center is visible. The hot spot is caused by β electrons being emitted from tritium contamination behind the rear wall and passing its central hole.
After reaccumulation of tritium on the rear wall during standard KATRIN operation of roughly 1 year, the decontamination process was repeated with an 80:20 He/O2 mixture to exclude any possible contribution of non-oxygen components in the gas mixture. The initial count rate was at a comparable level to the previously shown data. Illumination with UV light resulted in an exponential decline of the count rate with a time constant h, which is comparable to the previous result considering the multiple different decontamination approaches combined in the first process.
IV.C. Discussion of Results
The marginal decline in rate observed during the prolonged evacuation indicates a minimal amount of residual tritium gas present in the recipient and that no significant outgassing occurred. This explains the lack of decontamination achieved by flushing the system with inert N2 as carrier gas for low concentrations of gaseous tritium.
The actual composition of the tritiated molecules on the surface of the rear wall cannot be determined with the presented data. However, a working hypothesis was created, stating that the adsorbed activity on the rear wall is caused by several tritiated species, consisting partially of adsorbed HTO and mainly aC:T.
The presence of HTO is suggested by the observed decontamination of heating and flushing with ambient air.[Citation14,Citation30] From the presented data, no robust conclusion can be drawn from the lack of decontamination achieved by D2 flushing, apart from the known fact that decontamination with humid air is more effective.
The resistance against the initial decontamination attempts and the subsequent strong decontamination effect achieved by UV/ozone cleaning suggest strongly bound tritium as, e.g., tritiated co-deposited carbon layers.[Citation16–18] This leads to aC:T being a possible candidate for the contaminating species removed by this step. The formation under the present conditions is expected, and aC:T can be resistant to all the other decontamination procedures performed, while UV/ozone cleaning, which is widely applied for removal of organic contaminants, proved to be effective.
V. CONCLUSION AND OUTLOOK
The accumulation of near-surface tritium on a gold-coated stainless steel disk that was exposed to impinging tritium molecules, electrons, and tritium ions coming from cold tritium plasma with pressures of less than 10−5 mbar was observed. Out of the different in situ decontamination techniques investigated, UV/ozone cleaning proved to be by far the most efficient, yielding a decontamination factor of roughly 1300 over the span of a few days, achieving comparably low levels of surface activity.
UV/ozone cleaning proved to be much more effective in the removal of tritiated molecules that resist common decontamination techniques like heating or flushing with inert gases, D2, or humid air. Using this technique allows the KATRIN rear wall to be decontaminated quickly to comparably low levels of activity. A reduction of the activity to % (
‰) can be achieved within 1 week (2 weeks). This includes the time needed to put the system in the required state, which includes ramping down the superconducting magnets and removal of all tritium. The high decontamination effect and the relatively short time required for the procedure makes it suited for regular application within maintenance breaks of the experiment in order to keep the systematic impact of accumulated tritium in the neutrino mass analysis low.
In general, UV/ozone cleaning is a promising candidate for the surface decontamination of systems without materials that are susceptible to damage caused by ozone or oxidation. Materials prone to deterioration caused by UV illumination have to be shielded from it. The effectiveness of this technique for samples exposed to higher pressures of tritium; the effect of tritium within the bulk; and the effective range of ozone in larger, less accessible systems are subjects of ongoing and future investigations.
Acknowledgments
We acknowledge the support of Helmholtz Association; Ministry for Education and Research BMBF (05A17PM3, 05A17PX3, 05A17VK2, 05A17PDA, 05A17WO3, 05A20VK3, 05A20PMA and 05A20PX3); Helmholtz Alliance for Astroparticle Physics; doctoral school KSETA at Karlsruhe Institute of Technology (KIT); Helmholtz Young Investigator Group (VH-NG-1055); Max Planck Research Group (MaxPlanck@TUM); Deutsche Forschungsgemeinschaft DFG (Research Training Group grant numbers GRK 1694 and GRK 2149); Graduate School grant number GSC 1085-KSETA, SFB-1258, and Excellence Cluster ORIGINS in Germany; Ministry of Education, Youth and Sport (CANAM-LM2015056, LTT19005) in the Czech Republic; U.S. Department of Energy through grants DE-FG02-97ER41020, DE-FG02-94ER40818, DE-SC0004036, DE-FG02-97ER41033, DE-FG02-97ER41041, DE-SC0011091 and DE-SC0019304; and Federal Prime Agreement DE-AC02-05CH11231 in the United States. This project has received funding from the European Research Council under the European Union Horizon 2020 research and innovation programme (grant agreement number 852845). We thank the computing cluster support at the Institute for Astroparticle Physics at KIT, Max Planck Computing and Data Facility, and National Energy Research Scientific Computing Center at Lawrence Berkeley National Laboratory. We acknowledge support by the KIT-Publication Fund of KIT.
Disclosure Statement
No potential conflict of interest was reported by the author(s).
Notes
a miniZ RBD Instruments, United States.
References
- M. AKER et al., “KATRIN: Status and Prospects for the Neutrino Mass and Beyond,” J. Phys. G: Nucl. Part. Phys., 49, 10, 100501 (2022); https://doi.org/10.1088/1361-6471/ac834e.
- M. BABUTZKA et al., “Monitoring of the Operating Parameters of the KATRIN Windowless Gaseous Tritium Source,” New J. Phys., 14, 10, 103046 (2012); https://doi.org/10.1088/1367-2630/14/10/103046.
- R. WAGNER et al., “Improvement and Characterization of Small Cross-Piece Ionization Chambers at the Tritium Laboratory Karlsruhe,” Fusion Sci. Technol., 60, 3, 968 (2011); https://doi.org/10.13182/FST11-A12577.
- M. NISHIKAWA et al., “Ionization Chamber System to Eliminate the Memory Effect of Tritium,” Nucl. Instrum. Methods Phys. Res., Sect. A, 278, 2, 525 (1989); https://doi.org/10.1016/0168-9002(89)90875-9.
- G. K. LARSEN, K. NGUYEN, and S. E. H. MURPH, “Preventing Tritium Memory Effects in Ion Chambers Using Ultraviolet LEDs,” IEEE Trans. Nucl. Sci., 69, 5, 1092 (2022); https://doi.org/10.1109/TNS.2022.3163630.
- M. RÖLLIG et al., “Activity Monitoring of a Gaseous Tritium Source by Beta Induced X-Ray Spectrometry,” Fusion Eng. Des., 88, 6, 1263 (2013); https://doi.org/10.1016/j.fusengdes.2012.11.001. Proc. 27th Symp. Fusion Technology (SOFT-27), Liège, Belgium, September 24–28, 2012; https://www.sciencedirect.com/science/article/pii/S0920379612004632.
- M. AKER et al., “The Design, Construction, and Commissioning of the KATRIN Experiment,” J. Instrum., 16, 8, T08015 (2021); https://doi.org/10.1088/1748-0221/16/08/T08015.
- M. STURM et al., “Kilogram Scale Throughput Performance of the KATRIN Tritium Handling System,” Fusion Eng. Des., 170, 112507 (2021); https://doi.org/10.1016/j.fusengdes.2021.112507.
- J. AMSBAUGH et al., “Focal-Plane Detector System for the KATRIN Experiment,” Nucl. Instrum. Methods Phys. Res., Sect. A, 778, 40 (2015); https://doi.org/10.1016/j.nima.2014.12.116.
- M. AKER et al., “Analysis Methods for the First KATRIN Neutrino-Mass Measurement,” Phys. Rev. D, 104, 1, 012005 (2021); https://doi.org/10.1103/PhysRevD.104.012005.
- L. STOBIŃSKI and R. DUŚ, “Model of Atomic Hydrogen Adsorption on Thin Gold Film Surface,” Vacuum, 45, 2–3, 299 (1994); https://doi.org/10.1016/0042-207X(94)90194-5.
- L. STOBIŃSKI, L. ZOMMER, and R. DUŚ, “Molecular Hydrogen Interactions with Discontinuous and Continuous Thin Gold Films,” Appl. Surf. Sci., 141, 3–4, 319 (1999); https://doi.org/10.1016/S0169-4332(98)00517-0.
- M. NISHIKAWA, T. TAKEISHI, and K. KATAYAMA, “Tritium Decontamination from Various Materials (Experiment with Used Tritium Gas Cylinder),” Materials for Advanced Energy Systems and Fission & Fusion Engineering, pp. 111–120, World Scientific.
- Y. OYA et al., “Tritium Contamination and Decontamination Study on Materials for ITER Remote Handling Equipment,” Fusion Eng. Des., 55, 4, 449 (2001); https://doi.org/10.1016/S0920-3796(01)00217-4.
- M. SHARPE, “On the Interaction of Tritium with the Surfaces of Aluminum, Copper, Stainless Steel (Type 316), and Gold,” PhD Thesis, University of Rochester (2016).
- T. J. VENHAUS et al., “The Effect of UV Light Irradiation on the Removal of Tritium from the Codeposited Carbon–Tritium Layer in Fusion Reactors,” J. Nucl. Mater., 302, 2–3, 224 (2002); https://doi.org/10.1016/S0022-3115(02)00808-5.
- W. M. SHU et al., “Tritium Decontamination of TFTR Carbon Tiles Employing Ultra Violet Light,” J. Nucl. Mater., 290, 482 (2001); https://doi.org/10.1016/S0022-3115(00)00441-4.
- Y. OYA et al., “A Study of Tritium Decontamination of Deposits by UV Irradiation,” J. Nucl. Mater., 290, 469 (2001); https://doi.org/10.1016/S0022-3115(00)00440-2.
- Y. S. CHENG et al., “Characterization of Carbon Tritide Particles in a Tokamak Fusion Reactor,” Fusion Sci. Technol., 41, 3P2, 867 (2002); https://doi.org/10.13182/FST02-A22708.
- W. DING et al., “Mechanics of Hydrogenated Amorphous Carbon Deposits from Electron-Beam-Induced Deposition of a Paraffin Precursor,” J. Appl. Phys., 98, 1, 014905 (2005); https://doi.org/10.1063/1.1940138.
- M. T. POSTEK, A. E. VLADÁR, and K. P. PURUSHOTHAM, “Does Your SEM Really Tell the Truth? How Would You Know? Part 2,” Scanning: J. Scanning Microsc., 36, 3, 347 (2014); https://doi.org/10.1002/sca.21124.
- L. BODINE, D. PARNO, and R. ROBERTSON, “Assessment of Molecular Effects on Neutrino Mass Measurements from Tritium β Decay,” Phys. Rev. C, 91, 3, 035505 (2015); https://doi.org/10.1103/PhysRevC.91.035505.
- A. SAENZ, S. JONSELL, and P. FROELICH, “Improved Molecular Final-State Distribution of HeT+ for the β-Decay Process of T2,” Phys. Rev. Lett., 84, 2, 242 (2000); https://doi.org/10.1103/PhysRevLett.84.242.
- N. P. KHERANI and W. T. SHMAYDA, “In-Line Process Tritium Monitors,” Fusion Technol., 21, 2P2, 340 (1992); https://doi.org/10.13182/FST21-2P2-340.
- M. MATSUYAMA et al., “Contamination of Ionization Chamber Due to Tritium Exposure,” Fusion Technol., 8, 2P2, 2461 (1985); https://doi.org/10.13182/FST85-A24648.
- W. M. SHU et al., “Characteristics of a Promising Tritium Process Monitor Detecting Bremsstrahlung X-Rays,” Nucl. Instrum. Methods Phys. Res., Sect. A, 521, 2–3, 423 (2004); https://doi.org/10.1016/j.nima.2003.10.110.
- J. R. VIG, “UV/Ozone Cleaning of Surfaces,” J. Vac. Sci. Technol. A Vac. Surf. Films, 3, 3, 1027 (1985); https://doi.org/10.1116/1.573115.
- J. P. KRASZNAI and R. MOWAT, “UV/Ozone Treatment to Decontaminate Tritium Contaminated Surfaces,” Fusion Technol., 28, 3P2, 1336 (1995); https://doi.org/10.13182/FST95-A30597.
- B. V. IVANOV et al., “Detritiation of the Electrostatic Spectrometer of Troitsk Nu-Mass Experiment,” Fusion Sci. Technol., 78, 1, 44 (2022); https://doi.org/10.1080/15361055.2021.1951533.
- Y. TORIKAI et al., “Effect of Water Vapor on Tritium Decontamination of Stainless Steel 316,” Fusion Sci. Technol., 41, 3P2, 736 (2002); https://doi.org/10.13182/FST02-2.
- K. Y. WONG et al., “Tritium Decontamination of Machine Components and Walls,” Fusion Eng. Des., 16, 159 (1991); https://doi.org/10.1016/0920-3796(91)90190-2.
- Y. ISHIKAWA and H. Y. HIROSE, “Etching of Nondiamond Carbon in Diamond Thin Films Synthesized by Hot-Filament Chemical Vapor Deposition with Ultraviolet Irradiation,” Japanese J. Appl. Phys., 36, 3R, 1233 (1997); https://doi.org/10.1143/JJAP.36.1233.