
ABSTRACT
Background
Lung cancer is the deadliest form of malignancy and the most common subtype is non-small cell lung cancer (NSCLC). Hypoxia is a typical feature of solid tumor microenvironment. In the current study, we clarified the effects of hypoxia on stemness and metastasis and the molecular mechanism.
Methods
The biological functions were assessed using the sphere formation assay, Transwell assay, and XF96 extracellular flux analyzer. The protein levels were detected by western blot. The lactylation modification was assessed by western blot and immunoprecipitation. The role of SOX9 in vivo was explored using a xenografted tumor model.
Results
We observed that hypoxia promoted sphere formation, migration, invasion, glucose consumption, lactate production, glycolysis, and global lactylation. Inhibition of glycolysis suppressed cell stemness, migration, invasion, and lactylation. Moreover, hypoxia increased the levels of SOX9 and lactylation of SOX9, whereas inhibition of glycolysis reversed the increase. Additionally, knockdown of SOX9 abrogated the promotion of cell stemness, migration, and invasion. In tumor-bearing mice, overexpression of SOX9 promoted tumor growth, and inhibition of glycolysis suppressed tumor growth.
Conclusion
Hypoxia induced the lactylation of SOX9 to promote stemness, migration, and invasion via promoting glycolysis. The findings suggested that targeting hypoxia may be an effective way for NSCLC treatment and reveal a new mechanism of hypoxia in NSCLC.
Introduction
Lung cancer is still the first cause of cancer-related death globally. The most common type non-small cell lung cancer (NSCLC) accounts for 85% of lung cancer.Citation1 The diagnosis of NSCLC is delayed due to the lack of obvious symptoms in the early stage.Citation2 Over the past years, molecular targeted therapy and immunotherapy have significantly improved NSCLC clinical outcomes.Citation3,Citation4 Although the therapy strategies are developing, the 5-year survival rate of NSCLC at advanced stage remains poor.Citation5 Therefore, novel therapeutic methods of NSCLC are urgently required.
Growing evidence has confirmed that the tumor microenvironment (TME) promotes cancer development. Soluble factors, enriched in TME, induce abnormal proliferation, metastasis, angiogenesis, and drug resistance of tumor cells.Citation6 Hypoxia is a typical characteristic of TME in almost all solid tumors.Citation7 The rapid growth of tumor cells leads to a decrease in oxygen levels in the surrounding area. Chronic hypoxia can induce necrosis of tumor cells around blood vessels. However, once the tumor cells adapt to the hypoxic environment, the tumor cells will become more aggressive and drug-resistant.Citation8,Citation9 In addition, hypoxia is associated with the phenotypes of cancer stem cells (CSCs) and induces epithelial-mesenchymal transition (EMT) and chemoradiotherapy resistance of CSCs.Citation10,Citation11 However, the underlying mechanisms of hypoxia are complex and remain largely unclear.
SRY-related high mobility group-box 9 (SOX9), a transcription factor, is a member of the SOX family. SOX9 is highly conserved and regulates embryonic development and determines sex.Citation12 SOX9 is overexpressed in NSCLC and related to poor prognosis. SOX4 promotes cellular proliferation, invasion, and EMT of NSCLC.Citation13,Citation14 Additionally, the expression levels of SOX9 in TME are regulated by non-coding RNA, RNA methylation, and protein modifications such as phosphorylation and acetylation.Citation15 However, whether hypoxia could regulate SOX9 in NSCLC is still unknown.
In this study, we aimed to investigate the effects of hypoxia on NSCLC cell stemness and metastasis. We found that hypoxia promoted the stemness, migration, and invasion of NSCLC cells by mediating SOX9 lactylation. The findings identified a new mechanism of hypoxia in NSCLC and suggested that targeting hypoxia might be a novel treatment for NSCLC.
Materials and methods
Cell culture
A549 and H838 cells (ATCC, USA) were cultured in Dulbecco’s Modified Eagle Medium (DMEM; Gibco, USA) supplemented with 10% fetal bovine serum (FBS, Gibco, USA) and 1% penicillin/streptomycin in an incubator at 37°C with 5% CO2.
Hypoxia induction
A549 and H838 cells were seeded into 6-well plates at the concentration of 2 × 10Citation5 cells/well. The cells were incubated at 37°C with 1% O2 for 8, 16, and 24 h. The cells in the 0 h group were maintained in normoxia conditions (20% O2).
Cell transfection
A549 and H838 cells were seeded into 6-well plates at the concentration of 2 × 10Citation5 cells/well and incubated for 24 h before transfection. Then, the cells were transfected with short hairpin RNA (Sh)-SOX9 and corresponding negative control (sh-NC) acquired from Genepharma (China) using Lipofectamine 2000 (Invitrogen, USA). 6 hours later, the medium was replaced with fresh medium. After 48 h, the transfected cells were harvested.
2-deoxyglucose (2-DG) treatment
A549 and H838 cells were treated with 20 mM glycolysis inhibitor 2-DG (Sigma-Aldrich, USA) for 48 h as previously reported.Citation16
Sphere formation assay
CSCs were sorted from A549 and H838 cells using the spherocyte medium. Briefly, A549 and H838 cells were digested and washed with PBS twice. The cells were seeded into 6-well ultra-low cluster plates and incubated with DMEM/F12 without serum containing 20 ng/mL epidermal growth factor, 20 ng/mL b-fibroblast growth factor, 2% B27, and 4 μg/mL insulin (all from Sigma-Aldrich) for 10 days. The spheres were observed under a microscope (Olympus, Japan) and the sphere formation rate was quantified.
Transwell assay
Cell migration was evaluated using 8 μm 24-well chambers (Corning, USA). The cell suspension containing 2 × 10Citation5 cells was placed on the top chambers, and the DMEM with 10% FBS (500 μL) was filled with the bottom chambers. Following 24 h of incubation at 37°C with 5% CO2, the migrated cells were fixed with 4% paraformaldehyde for 20 min and stained with 0.1% crystal violet for 20 min. The stained cells were counted under a microscope (Olympus).
Cell invasion was assessed using the same chambers as used in cell migration detection but pre-coated with Matrigel (BD Biosciences, USA). The other operations were the same as that of cell migration mentioned above.
Determination of glucose consumption
Glucose consumption was detected using a glucose uptake assay kit (Sigma-Aldrich) according to the manufacturer’s instructions. The cells were lysed using lysis buffer on ice. The samples (50 μL) were incubated with 8 μL assay buffer and 2 μL enzyme mix for 60 min at 37°C. Next, glutathione reductase (20 μL), substrate-DTNB (16 μL), and recycling mix (2 μL) were added in each well. The absorbance was measured at 412 nm.
Determination of lactate production
Lactate production was detected using a lactic acid assay kit (Sigma-Aldrich) following the manufacturer’s protocol. Briefly, cells were homogenized in lactate assay buffer and centrifuged at 13,000 ×g for 10 min. The supernatant (50 μL) was incubated with 50 μL reaction mix (containing 46 μL lactate assay buffer, 2 μL lactate enzyme mix, and 2 μL lactate probe) at room temperature for 30 min. The absorbance was measured at 570 nm.
Determination of ATP level
Cellular ATP level was measured using an ATP assay kit (Beyotime, China) in line with the manufacturer’s protocol. Briefly, A549 and H838 cells were lysed and the supernatant was collected after centrifuging at 12,000 ×g for 5 min. ATP detection working solution (100 μL) was mixed with 20 μL supernatant, and the results were detected using a luminometer.
Extracellular acidification rate (ECAR) and oxygen consumption rate (OCR) analysis
A549 and H838 cells at the density of 1.2 × 10Citation4 cells/well were seeded into XF96 cell culture plates and incubated until 90% confluence. For ECAR and OCR analysis, the culture medium was replaced by the assay medium without bicarbonate provided by Seahorse Bioscience (USA). Then, the ECAR and OCR were assessed using the XF96 extracellular flux analyzer (Seahorse Bioscience). For ECAR analysis, glucose, oligomycin A, and 2-DG were automatically added in turn, and the results were reported as mpH/min. For OCR analysis, oligomycin A, carbonyl cyanide 4-(trifluoromethoxy)phenylhydrazone (FCCP), and antimycin A and rotenone (rote/AA) were automatically added in turn, and the results were reported as pmol/min.
Western blot analysis
Total proteins were isolated from cells in RIPA lysis buffer. Following detecting the protein concentration using a BCA kit (Pierce, USA), 30 μg proteins were separated by 10% sodium dodecyl sulfate – polyacrylamide gels (SDS-PAGE). Then, the proteins were transferred onto PVDF membranes. The membranes were incubated with specific primary antibodies at 4°C overnight followed by incubating with the secondary antibody. Protein bands were visualized with ECL western blot substrate (Pierce). The antibodies were listed as follows: anti-NANOG (ab109250, 1/3000, Abcam, USA), anti-CD133 (ab222782, 1/2000, Abcam), anti-GAPDH (ab181602, 1/10000, Abcam), anti-SOX1 (ab109290, 1/1000, Abcam), anti-SOX2 (ab97959, 1/1000, Abcam), anti-SOX3 (ab183606, 1/2000, Abcam), anti-SOX9 (ab185230, 1/5000, Abcam), anti-SOX12 (23939–1-AP, 1/500; Proteintech, USA). The secondary antibody was goat anti-rabbit IgG conjugated HRP (ab6721, 1/3000, Abcam). Anti-Pan-Histone lysine lactylation (Kla; PTM1401, 1/1000, PTM Biolabs, China) was used to detect total lactylation protein levels.
Immunoprecipitation (IP)
A549 and H838 cells were lysed using the pre-cold IP lysis buffer. After centrifugation, the supernatant was collected to incubate with anti-SOX1 (ab109290, 1/50, Abcam), anti-SOX2 (ab133337, 1/10, Abcam), anti-SOX3 (ab183606, 1/100, Abcam), anti-SOX9 (ab185230, 1/60, Abcam), anti-SOX12 (23939–1-AP, 1/20, Proteintech) at 4°C overnight. Meanwhile, the protein A/G-agarose beads were suspended with lysis buffer containing protease inhibitor. These suspensions were added to the samples in the next day to incubate for 4 h at 4°C.
Quantitative real-time polymerase chain reaction (qRT-PCR)
Total RNA was extracted by the TRIzol reagent (Invitrogen) and 1 μg RNA was used to perform reverse transcription to obtain cDNAs using the SuperScript™ IV first-strand synthesis system (ThermoFisher Scientific, USA). qPCR was carried out using the SYBR Green PCR Mastermix (Solarbio life science, China) and the cDNA as templates. The relative expression of SOX9 was calculated using the 2−ΔΔCT method. The specific primers of SOX9 were: F 5ʹ-CAAGAAGGACCACCCGGATT-3ʹ and R 5ʹ-AAGATGGCGTTGGGGGAGAT-3ʹ. The specific primers of the loading control ACTB were: F 5ʹ-CCTCTCCCAAGTCCACACAG-3ʹ and R 5ʹ- GGGCACGAAGGCTCATCATT-3ʹ.
Animal study
The nude mice were randomly allocated into four groups (6 mice per group): vector, vector + 2-DG, SOX9, and SOX9 + 2-DG. A549 cells were transfected with SOX9 overexpressing vectors and empty vectors and adjusted cell density at 5 × 10Citation7 cells/mL. The mice were subcutaneously injected with 100 μL transfected cells to establish a tumor-bearing mouse model. When the tumors reached about 50 mm3, mice were intraperitoneal injected with 500 mg/kg/day 2-DG,Citation17 once every 2 days during the experiment. Tumor volume was measured using a vernier caliper every week and quantified using the formula: Volume (mmCitation3 =(length×widthCitation2/2. After the fourth measurement of tumor volume, the mice were sacrificed. The tumors were isolated from all mice.
Immunohistochemistry (IHC) assay
Tumor tissue paraffin sections (4 μm) were incubated with anti-SOX9 (ab185230, 1/2000, Abcam) at 4°C overnight followed by incubating with the secondary antibody (ab6721, 1/1000, Abcam) at room temperature for 0.5 h. Then, the sections were stained with DAB solution for 3 min at room temperature. After washing using moving water and sealing, the images were visualized under a microscope.
Statistical analysis
Data analysis was performed using GraphPad Prism 8.0 software. The results are shown as mean ± SD. The comparisons between two groups were assessed using Student’s t-test and the comparisons among multiple groups were assessed using one-way analysis of variance. p < .05 indicated statistically significant.
Results
Hypoxia promotes cell stemness, migration, and invasion of NSCLC
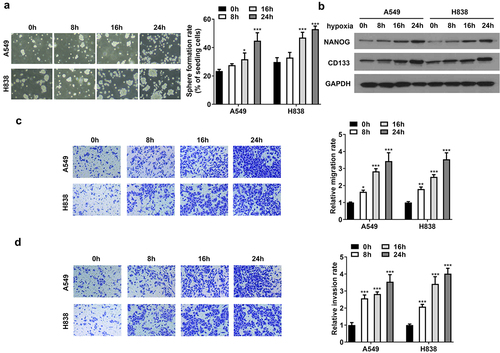
To explore the biological functions of hypoxia, we evaluated sphere formation of CSCs and metastasis of NSCLC cells. Compared with normoxia conditions, sphere formation rate was increased by hypoxia in a time-dependent way (). The protein levels of NANOG and CD133 were upregulated in a time-dependent manner (). Additionally, the capability of cellular migration and invasion of NSCLC cells was facilitated by hypoxia in a time-dependent manner (). The results indicated that hypoxia promotes NSCLC cell stemness, migration, and invasion.
Figure 1. Hypoxia promotes cell stemness, migration, and invasion of NSCLC. (a) Sphere formation of CSCs sorted from A549 and H838 cells. (b) The protein levels of the markers of cell stemness including NANOG and CD133. (c) The represent images of cell migration under a microscope. The migration rate was quantified. (d) The represent images of cell invasion under a microscope. The invasion rate was quantified. *p<.05, **p<.01, and ***p<.001 vs. 0 h group.
Hypoxia promotes glycolysis in NSCLC cells
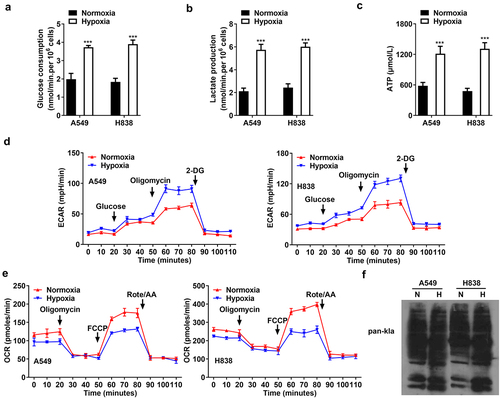
Subsequently, we explored the effects of hypoxia on glycolysis. A549 and H838 cells treated with normoxia and hypoxia for 48 h were used. The results showed that hypoxia promoted glucose consumption, lactate production, and ATP level (). The results of ECAR curve showed that the glycolysis capability was higher in the hypoxia group than that in the normoxia group (). As shown in , hypoxia reduced OCR, compared with normoxia, suggesting hypoxia inhibited aerobic respiration. Additionally, the total lactylation proteins were increased after hypoxia treatment (). The results indicated that hypoxia promotes NSCLC cell glycolysis.
Figure 2. Hypoxia promotes glycolysis in NSCLC cells. (a) The glucose consumption, (b) lactate production, and (c) ATP level in A549 and H838 cells. (d) The glycolytic capability of NSCLC cells was evaluated using ECAR curve. (e) The respiration was evaluated by OCR curve. (f) The lactylation proteins in A549 and H838 cells after normoxia (n) and hypoxia (h) treatment. *p<.01 vs. normoxia group.
2-DG reverses the cell stemness, migration, invasion, and glycolysis induced by hypoxia
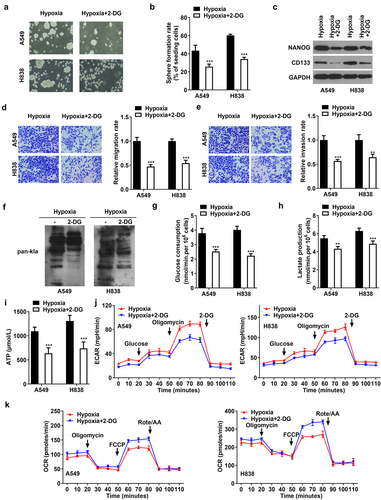
To investigate the effects of glycolysis on the biological functions of NSCLC cells, 2-DG was treated to suppress glycolysis. 2-DG decreased sphere formation of hypoxia-induced cells (). Moreover, 2-DG downregulated NANOG and CD133 protein levels, compared with hypoxia treatment (). Cell migration and invasion of hypoxia-induced cells were suppressed by 2-DG (). As compared with hypoxia, 2-DG reduced the total lactylation of cells (). Besides, 2-DG abrogated the increase of glucose consumption, lactate production, and ATP level induced by hypoxia (). The glycolysis capability was suppressed and anaerobic respiration was promoted by 2-DG treatment in hypoxia-induced cells (). The results showed that suppression of glycolysis inhibited cell stemness, migration, and invasion of NSCLC.
Figure 3. 2-DG reverses the cell stemness, migration, invasion, and glycolysis induced by hypoxia. After hypoxia and 2-DG treatment, (A, B) sphere formation of CSCs sorted from A549 and H838 cells. (C) The protein levels of NANOG and CD133. (D) The represent images of cell migration under a microscope. The migration rate was quantified. (E) The represent images of cell invasion under a microscope. The invasion rate was quantified. (F) The total lactylation proteins in A549 and H838 cells. (G) The glucose consumption in A549 and H838 cells. (G) The lactate production in A549 and H838 cells. (H) The ATP production in A549 and H838 cells. (J) The glycolytic capability of NSCLC cells was evaluated using ECAR curve. (K) The respiration was evaluated by OCR curve. *p<.01 and **p<.001 vs. hypoxia group.
Hypoxia induces lactylation of SOX9
The molecular mechanism of hypoxia was further investigated. The results of western blot showed that hypoxia elevated the protein levels of SOX1, SOX2, SOX3, SOX9, and SOX12, compared with normoxia (). However, hypoxia only increased the lactylation levels of SOX9, but did not affect the lactylation levels of SOX1, SOX2, SOX3, and SOX12 (). Moreover, 2-DG downregulated the protein levels and lactylation levels of SOX9 (). The results illustrated that hypoxia promoted SOX9 lactylation modification by promoting glycolysis.
Figure 4. Hypoxia induces lactylation of SOX9. (a) The protein levels of SOX1, SOX2, SOX3, SOX9, and SOX12 in A549 and H838 cells under normoxia and hypoxia conditions. (b) The lactylation levels of SOX1, SOX2, SOX3, SOX9, and SOX12 in A549 and H838 cells under normoxia and hypoxia conditions. (c) The protein levels and lactylation levels of SOX9 in NSCLC cells treated with hypoxia and 2-DG.
Knockdown of SOX9 abrogates cell stemness, migration, and invasion
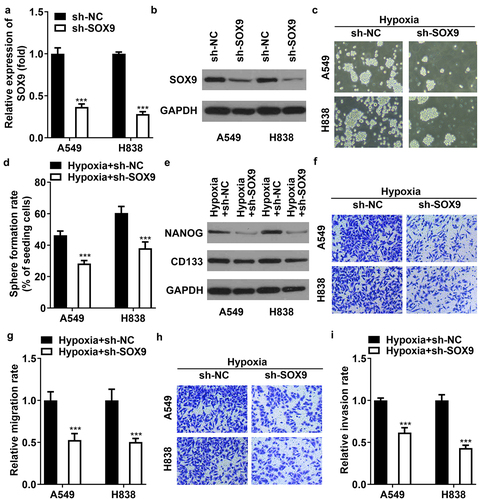
To explore the role of SOX9, A549 and H838 cells were transfected with sh-SOX9. As compared with sh-NC, the mRNA and protein levels of SOX9 were downregulated after transfection with sh-SOX9 (). In hypoxia-treated cells, knockdown of SOX9 inhibited sphere formation and downregulated the levels of NANOG and CD133 (). The migration and invasion were both inhibited by SOX9 knockdown in hypoxia-induced cells (). The results illustrated that hypoxia promotes cell stemness, migration, and invasion of NSCLC via mediating SOX4 levels.
Figure 5. Knockdown of SOX9 abrogates cell stemness, migration, and invasion of NSCLC cells. (a) Transfection efficiency of SOX9 following transfection with sh-NC and sh-SOX9 was measured using qRT-PCR. (b) The efficiency SOX9 following transfection was measured using western blot. (c, d) sphere formation of CSCs sorted from A549 and H838 cells. (e) The protein levels of NANOG and CD133. (f, g) the represent images of cell migration under a microscope. The migration rate was quantified. (h, i) the represent images of cell invasion under a microscope. The invasion rate was quantified. *p<.001 vs. sh-NC group in (a). **p<.001 vs. hypoxia +sh-NC group in (d-i).
2-DG rescued the promotion of tumor growth induced by SOX9
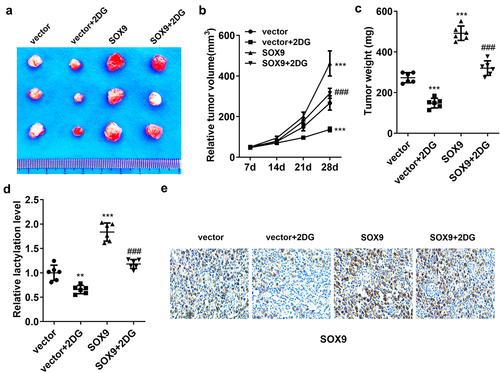
Finally, we established the tumor-bearing mouse model to explore the role of 2-DG and SOX9 in vivo. The results showed that 2-DG reduced tumor size and weight, whereas SOX9 increased tumor size and weight, compared with the vector group. 2-DG reversed the effects induced by SOX9 (). The lactylation level was decreased by 2-DG and was elevated by SOX9. 2-DG rescued SOX9-mediated lactylation level (). The protein levels of SOX9 were downregulated by 2-DG and upregulated by SOX9 overexpression. Moreover, the levels were reversed by 2-DG, compared with the SOX9 group (). Taken together, SOX9 accelerated tumor growth in glycolysis glycolysis-dependent manner.
Figure 6. 2-DG rescued the promotion of tumor growth induced by SOX9. (a) The represent images of tumors from mice of each group. (b) Tumor volume was measured weekly. (c) Tumor weight. (d) The lactylation levels in tumor tissues. (e) IHC assessed SOX9 levels in tumors. *p<.001 and **p<.01 vs. The vector group. ***p<.01 vs. The SOX9 group.
Discussion
Advanced NSCLC is accompanied by distal metastasis of the tumor, resulting in cancer-related death. Thus, inhibition of tumor metastasis can improve clinical outcomes of NSCLC. Hypoxia is the main characteristic of TME in solid cancers. It regulates tumor growth, angiogenesis, metabolism, immune response, and drug resistance.Citation18 On one hand, hypoxia inhibits tumor cell growth due to lack of oxygen; however, on the other hand, hypoxia promotes cell invasion and then accelerates malignant advancement.Citation19 CSCs regulate self-renewing and differentiation, and hypoxia promotes self-renewal of CSCs.Citation20 Herein, we performed sphere formation, western blot, and Transwell assay to analyze NSCLC cellular processes, and found that hypoxia promoted cell stemness, migration, and invasion in a time-dependent manner, suggesting that inhibition of hypoxia could decelerate the progression of NSCLC. Thus, targeting hypoxia may be a novel treatment for NSCLC.
Glycolysis is a key pathway to provide energy for tumor cells and maintain tumor growth. Otto Warburg observed that cancer cells metabolize glucose through the glycolytic pathway and then convert it to lactic acid, terming Warburg effect.Citation21 The Warburg effect makes cancer cells have more powerful antioxidant capacity and promotes their metastasis.Citation22 Hypoxic TME is an important factor to enhance glycolysis in cancer cells. Under hypoxic conditions, tumor cells maintain ATP levels through glycolysis to ensure their survival and growth.Citation23 In the current study, we used commercial kits to detect glucose, lactate, and ATP, and used seahorse assay to assess ECAR and OCR. We found that hypoxia promoted glucose consumption, lactate production, ATP level, and glycolysis, consistent with previous studies.Citation24,Citation25 Moreover, inhibition of glycolysis by 2-DG abrogated the promotion of cell stemness, migration, and invasion induced by hypoxia, and also suppressed tumor growth in vivo. The data suggested that hypoxia facilitated NSCLC cell stemness and metastasis by enhancing glycolysis.
Lactic acid is a metabolite of glycolysis that acts as a substrate to support cell growth and regulate biological functions. Histone lysine lactylation (Kla) is a newly identified epigenetic modification, providing potential targets for cancer therapy.Citation26 Lactylation is involved in numerous diseases, such as inflammation, fibrosis, and malignancy.Citation27 Hypoxia induces glycolysis to produce lactic acid, stimulating histone lactylation.Citation28 In this study, we explored that hypoxia increased the global lactylation levels in NSCLC cells through western blot, consistent with the previous study.Citation28 Moreover, inhibition of glycolysis reduced lactylation, suggesting that hypoxia promoted lactylation by promoting glycolysis.
At present, accumulating evidence has shown that multiple proteins have Kla sites except for histones. They widely exist in the nucleus, mitochondria, and cytoplasm.Citation29 Previous studies have revealed that hypoxia regulates cancer progression by lactylation of several proteins. For example, Qiao et al.Citation30 have identified that hypoxia facilitates glycolysis and stemness of esophageal cancer cells by SHMT2 lactylation. Miao et al.Citation31 have reported that hypoxia lactylates β-catenin promotes colorectal cancer cell proliferation and stemness. In this study, we focused on the proteins of the SOX family, which are involved in tumor initiation and progression.Citation32 In view of the role of glycolysis and lactylation, we speculated that SOX proteins could be undergone by lactylation modification. IP and western blot were performed to detect the protein and lactylation levels of the members in the SOX family. The results showed that hypoxia promoted lactylation of SOX9, and did not affect the lactylation of the other members of the SOX family. Moreover, inhibition of glycolysis downregulated the protein levels of SOX9 and the lactylation of SOX9. SOX9 is closely related to the progression of tumors. Importantly, SOX9 is involved in regulation of tumor cellular processes including glycolysis. SOX9 facilitates glycolysis in multiple cancers, such as gastric cancer,Citation33 colorectal cancer,Citation34 and NSCLC.Citation35 Therefore, we evaluated the role of SOX9 in NSCLC. Rescue experiments indicated that knockdown of SOX9 inhibited cell stemness, migration, and invasion in hypoxia-treated NSCLC cells. In tumor-bearing mice, overexpression of SOX9 accelerated tumor growth, accompanied by an increased lactylation level, and 2-DG rescued the promotion. The findings suggested that hypoxia promoted lactylation of SOX9, and knockdown of which inhibited the progression of NSCLC.
There are several limitations in this study. We only investigated the effects of hypoxia and SOX9 on stemness, migration, and invasion; however, their effects on other phenotypes, such as apoptosis, angiogenesis, immune escape, and drug resistance, remain unknown. Moreover, the underlying mechanism of hypoxia may be complex, including but not limited to SOX9 lactylation. We will further study this in our future work.
In conclusion, hypoxia facilitated the lactylation modification of SOX9 to promote cell stemness, migration, and invasion of NSCLC by enhancing glycolysis. Moreover, overexpression of SOX9 accelerated tumor growth through inducing glycolysis. The results suggested that inhibition of hypoxia is a novel treatment for NSCLC. How to translate the conclusions into clinical application still needs a lot of research.
Ethical approval
No ethics approval was required for this study as it involved no human participants or animals.
Disclosure statement
No potential conflict of interest was reported by the author(s).
Data availability statement
The datasets used and analyzed during the current study are available from the corresponding author on reasonable request.
Additional information
Funding
Notes on contributors
Fei Yan
Fei Yan obtained her Master’s degree in Oncology from Nanjing Medical University. Currently, she is a doctoral candidate in Oncology at Nanjing Medical University and serves as an attending physician in the Department of Oncology at Jiangsu Cancer Hospital. Her primary research interest lies in the diagnosis and treatment of lung cancer.
Yue Teng
Yue Teng earned her Master’s degree in Oncology from Nanjing University. Presently, she is pursuing a Ph.D. in Oncology at Nanjing Medical University while concurrently working as an attending physician in the Department of Oncology at at Jiangsu Cancer Hospital. Her primary research focus is on molecular studies related to cancer.
Xiaoyou Li
Xiaoyou Li earned her Ph.D. in Oncology from Nanjing Medical University. She currently holds the position of Associate Chief Physician in the Department of Oncology at Jiangsu Cancer Hospital. Her primary research area is precision diagnosis and treatment of lung cancer.
Yuejiao Zhong
Yuejiao Zhong obtained her Master’s degree in Oncology from Nanjing Medical University. She currently holds the position of Chief Physician in the Department of Oncology at Jiangsu Cancer Hospital. Her primary research area is internal medical treatment of tumors.
Chunyi Li
Chunyi Li earned his Master’s degree in Oncology from Nanjing Medical University. He is currently a doctoral candidate in Oncology at Nanjing University. His primary research area centers around the mechanistic study of tumors.
Feng Yan
Feng Yan is currently a doctoral supervisor at Nanjing Medical University and serves as the Director of the Clinical Laboratory at Jiangsu Cancer Hospital. Her primary research areas include clinical testing in oncology and precision diagnosis.
Xia He
Xia He is currently a doctoral supervisor at Nanjing Medical University and holds the positions of Vice President and Director of the Radiotherapy Department at Jiangsu Cancer Hospital. His primary research area is targeted radiotherapy for cancer.
References
- Suster DI, Mino-Kenudson M. Molecular pathology of primary non-small cell lung cancer. Arch Med Res. 2020;51(8):784–10. doi:10.1016/j.arcmed.2020.08.004.
- Zarogoulidis P, Matthaios D, Kosmidis C, Hohenforst-Schmidt W, Tsakiridis K, Mpaka S, Boukovinas I, Drougas D, Theofilatou V, Zaric B, et al. Effective early diagnosis for NSCLC: an algorithm. Expert Rev Respir Med. 2021;15(11):1437–1445. doi:10.1080/17476348.2021.1969916.
- Sankar K, Gadgeel SM, Qin A. Molecular therapeutic targets in non-small cell lung cancer. Expert Rev Anticancer Ther. 2020;20(8):647–661. doi:10.1080/14737140.2020.1787156.
- Broderick SR. Adjuvant and neoadjuvant immunotherapy in non-small cell lung cancer. Thorac Surg Clin. 2020;30(2):215–220. doi:10.1016/j.thorsurg.2020.01.001.
- Duma N, Santana-Davila R, Molina JR. Non-small cell lung cancer: epidemiology, screening, diagnosis, and treatment. Mayo Clin Proc. 2019;94(8):1623–1640. doi:10.1016/j.mayocp.2019.01.013.
- Wu T, Dai Y. Tumor microenvironment and therapeutic response. Cancer Lett. 2017;387:61–68. doi:10.1016/j.canlet.2016.01.043.
- Shao C, Yang F, Miao S, Liu W, Wang C, Shu Y, Shen H. Role of hypoxia-induced exosomes in tumor biology. Mol Cancer. 2018;17(1):120. doi:10.1186/s12943-018-0869-y.
- Jing X, Yang F, Shao C, Wei K, Xie M, Shen H, Shu Y. Role of hypoxia in cancer therapy by regulating the tumor microenvironment. Mol Cancer. 2019;18(1):157. doi:10.1186/s12943-019-1089-9.
- Mennerich D, Kubaichuk K, Kietzmann T. Dubs, hypoxia, and cancer. Trends Cancer. 2019;5(10):632–653. doi:10.1016/j.trecan.2019.08.005.
- Sun X, Lv X, Yan Y, Zhao Y, Ma R, He M, Wei M. Hypoxia-mediated cancer stem cell resistance and targeted therapy. Biomed Pharmacother. 2020;130:110623. doi:10.1016/j.biopha.2020.110623.
- Salem A, Asselin MC, Reymen B, Jackson A, Lambin P, West CML, O’Connor JPB, Faivre-Finn C. Targeting hypoxia to improve non–small cell lung cancer outcome. J Natl Cancer Inst. 2018;110(1):14–30. doi:10.1093/jnci/djx160.
- Gruber HE, Norton HJ, Ingram JA, Hanley EN. The SOX9 transcription factor in the human disc: decreased immunolocalization with age and disc degeneration spine (phila Pa 1976). Spine. 2005;30(6):625–630. doi:10.1097/01.brs.0000155420.01444.c6.
- Huang JQ, Wei FK, Xu XL, Ye SX, Song JW, Ding PK, Zhu J, Li HF, Luo XP, Gong H, et al. SOX9 drives the epithelial-mesenchymal transition in non-small-cell lung cancer through the Wnt/β-catenin pathway. J Transl Med. 2019;17(1):143. doi:10.1186/s12967-019-1895-2.
- Zhou Y, Shi H, Du Y, Zhao G, Wang X, Li Q, Liu J, Ye L, Shen Z, Guo Y, et al. lncRNA DLEU2 modulates cell proliferation and invasion of non-small cell lung cancer by regulating miR-30c-5p/SOX9 axis. Aging (Albany NY). 2019;11(18):7386–7401. doi:10.18632/aging.102226.
- Panda M, Tripathi SK, Biswal BK. SOX9: an emerging driving factor from cancer progression to drug resistance. Biochim Biophys Acta Rev Cancer. 2021;1875(2):188517. doi:10.1016/j.bbcan.2021.188517.
- Sinthupibulyakit C, Ittarat W, Clair WH, Clair DK. p53 protects lung cancer cells against metabolic stress. Int J Oncol. 2010;37(6):1575–1581. doi:10.3892/ijo_00000811.
- Zeng C, Wu Q, Wang J, Yao B, Ma L, Yang Z, Li J, Liu B. NOX4 supports glycolysis and promotes glutamine metabolism in non-small cell lung cancer cells. Free Radic Biol Med. 2016;101:236–248. doi:10.1016/j.freeradbiomed.2016.10.500.
- Li Y, Zhao L, Li XF. Hypoxia and the tumor microenvironment. Technol Cancer Res Treat. 2021;20:15330338211036304. doi:10.1177/15330338211036304.
- Chang J, Erler J. Hypoxia-mediated metastasis. Adv Exp Med Biol. 2014;772:55–81. doi:10.1007/978-1-4614-5915-6_3.
- Otero-Albiol D, Carnero A. Cellular senescence or stemness: hypoxia flips the coin. J Exp Clin Cancer Res. 2021;40(1):243. doi:10.1186/s13046-021-02035-0.
- Bose S, Le A. Glucose metabolism in cancer. Adv Exp Med Biol. 2018;1063:3–12. doi:10.1007/978-3-319-77736-8_1.
- Lu J, Tan M, Cai Q. The Warburg effect in tumor progression: mitochondrial oxidative metabolism as an anti-metastasis mechanism. Cancer Lett. 2015;356(2 Pt A):156–164. doi:10.1016/j.canlet.2014.04.001.
- Kierans SJ, Taylor CT. Regulation of glycolysis by the hypoxia-inducible factor (HIF): implications for cellular physiology. J Physiol. 2021;599(1):23–37. doi:10.1113/JP280572.
- Hua Q, Mi B, Xu F, Wen J, Zhao L, Liu J, Huang G. Hypoxia-induced lncRNA-AC020978 promotes proliferation and glycolytic metabolism of non-small cell lung cancer by regulating PKM2/HIF-1α axis. Theranostics. 2020;10(11):4762–4778. doi:10.7150/thno.43839.
- Zhang L, Ke J, Min S, Wu N, Liu F, Qu Z, Li W, Wang H, Qian Z, Wang X. Hyperbaric oxygen therapy represses the Warburg effect and epithelial-mesenchymal transition in hypoxic NSCLC cells via the HIF-1α/PFKP axis. Front Oncol. 2021;11:691762. doi:10.3389/fonc.2021.691762.
- Zhang Y, Zhai Z, Duan J, Wang X, Zhong J, Wu L, Li A, Cao M, Wu Y, Shi H, et al. Lactate: the mediator of metabolism and immunosuppression. Front Endocrinol (Lausanne). 2022;13:901495. doi:10.3389/fendo.2022.901495.
- Chen AN, Luo Y, Yang YH, Fu JT, Geng XM, Shi JP, Yang J. Lactylation, a novel metabolic reprogramming code: current status and prospects. Front Immunol. 2021;12:688910. doi:10.3389/fimmu.2021.688910.
- Zhang D, Tang Z, Huang H, Zhou G, Cui C, Weng Y, Liu W, Kim S, Lee S, Perez-Neut M, et al. Metabolic regulation of gene expression by histone lactylation. Nature. 2019;574(7779):575–580. doi:10.1038/s41586-019-1678-1.
- Gao M, Zhang N, Liang W. Systematic analysis of lysine lactylation in the plant fungal pathogen botrytis cinerea. Front Microbiol. 2020;11:594743. doi:10.3389/fmicb.2020.594743.
- Qiao Z, Li Y, Li S, Liu S, Cheng Y. 2024. Hypoxia-induced SHMT2 protein lactylation facilitates glycolysis and stemness of esophageal cancer cells. Mol Cell Biochem. doi:10.1007/s11010-023-04913-x.
- Miao Z, Zhao X, Liu X. Hypoxia induced β-catenin lactylation promotes the cell proliferation and stemness of colorectal cancer through the wnt signaling pathway. Exp Cell Res. 2023;422(1):113439. doi:10.1016/j.yexcr.2022.113439.
- Xu YR, Yang WX. SOX-mediated molecular crosstalk during the progression of tumorigenesis. Semin Cell Dev Biol. 2017;63:23–34. doi:10.1016/j.semcdb.2016.07.028.
- Zhang Y, Wu Y, Su X. PLOD1 promotes cell growth and aerobic glycolysis by regulating the SOX9/PI3K/Akt/mTOR signaling pathway in gastric cancer. Front Biosci (Landmark Ed). 2021;26(8):322–334. doi:10.52586/4946.
- Siu MKY, Jiang YX, Wang JJ, Leung THY, Han CY, Tsang BK, Cheung ANY, Ngan HYS, Chan KKL. Hexokinase 2 regulates ovarian cancer cell migration, invasion and stemness via FAK/ERK1/2/MMP9/NANOG/SOX9 signaling cascades. Cancers Basel. 2019;11(6):813. doi:10.3390/cancers11060813.
- Ji J, Xie M, Qian Q, Xu Y, Shi W, Chen Z, Ren D, Liu W, He X, Lv M, et al. SOX9-mediated UGT8 expression promotes glycolysis and maintains the malignancy of non-small cell lung cancer. Biochem Biophys Res Commun. 2022;587:139–145. doi:10.1016/j.bbrc.2021.11.099.